
Immune response microbiology bpt 2nd year
innate and adaptive immunity overview diagram cells
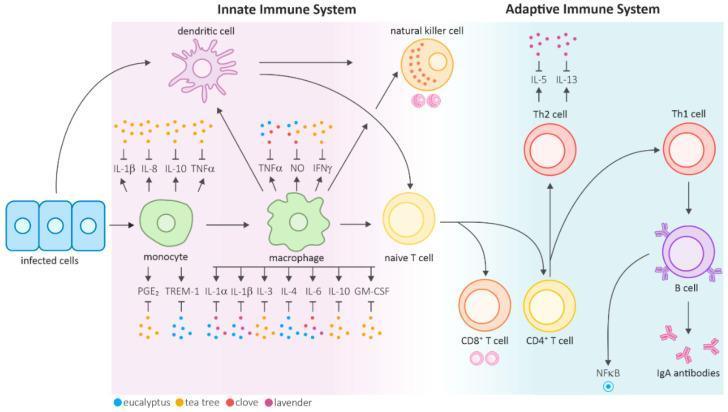
This medical pathophysiology diagram illustrates the mammalian immune response, divided into innate and adaptive systems, with an emphasis on the immunomodulatory effects of essential oils (eucalyptus, tea tree, clove, and lavender). The innate immunity section (left) depicts the transition from infected cells to monocytes and activated macrophages. It shows the secretion of pro-inflammatory and regulatory cytokines, including IL-1β, IL-8, IL-10, TNFα, PGE2, and TREM-1. Key cells shown include dendritic cells and natural killer (NK) cells. The adaptive immunity section (right) demonstrates the maturation of naive T cells into CD8+, CD4+, Th1, and Th2 lineages. It also illustrates the interaction between Th1 cells and B cells leading to the production of IgA antibodies. Colored dots represent specific essential oils that inhibit various signaling molecules, such as TNFα, NO, IFNγ, and various interleukins (IL-1α through IL-13), highlighting their roles in downregulating inflammatory pathways and nuclear factor kappa B (NFιB) signaling. This diagram serves as a clinical overview of cytokine signaling and the therapeutic potential of phytogenic compounds in immune regulation.
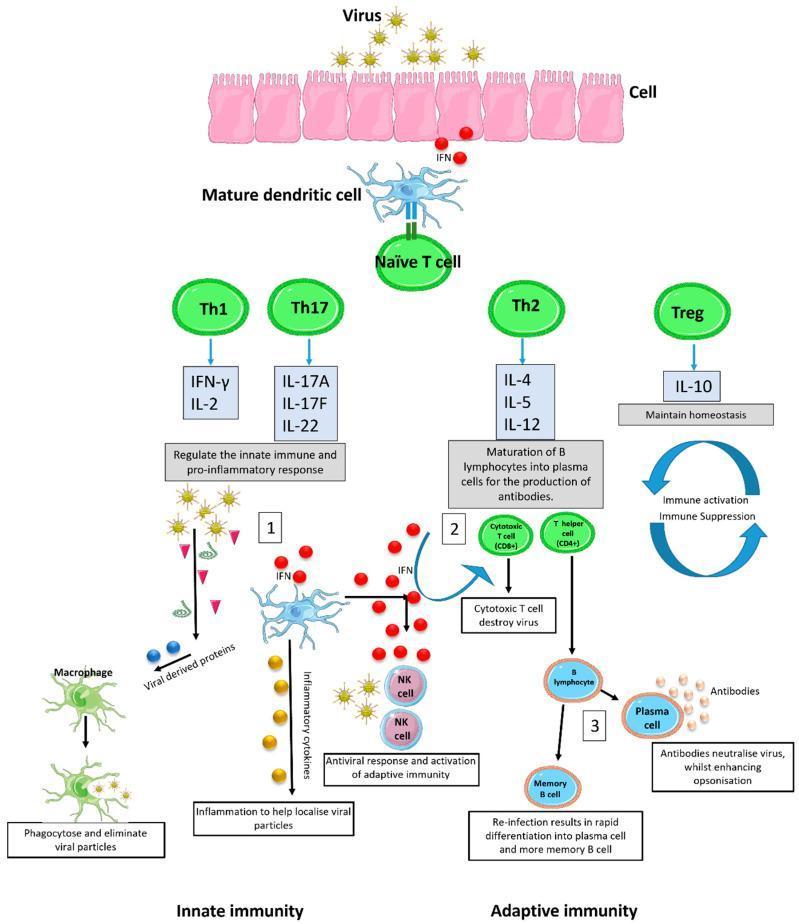
A comprehensive pathophysiology diagram illustrating the integrated human innate and adaptive immune responses to a viral infection. The diagram is divided into two primary sections. The 'Innate Immunity' side depicts viral entry into host cells, triggering the release of interferon (IFN) and inflammatory cytokines. This leads to the activation of natural killer (NK) cells and macrophages for phagocytosis. Concurrently, professional antigen-presenting cells, specifically mature dendritic cells, bridge the two systems by presenting viral antigens to naïve T cells. The 'Adaptive Immunity' side details the differentiation of naïve T cells into specific helper subsets: Th1 and Th17 (secreting IFN-γ, IL-2, IL-17A/F, IL-22 for pro-inflammatory regulation), Th2 (secreting IL-4, IL-5, IL-12 for B lymphocyte maturation), and Treg (secreting IL-10 for homeostasis). The cellular response shows cytotoxic T cells (CD8+) destroying infected cells and T helper cells (CD4+) stimulating B lymphocytes. The humoral response highlights B cell differentiation into plasma cells for antibody production (neutralization and opsonization) and memory B cells for rapid response upon re-infection.
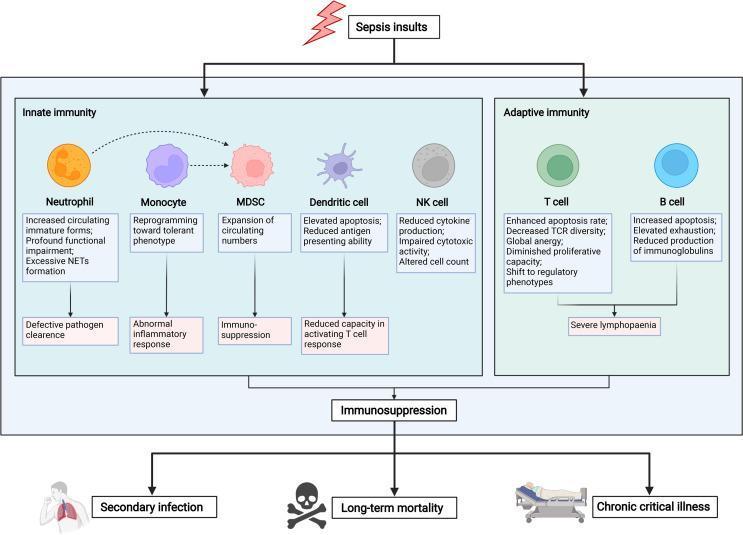
A pathophysiology diagram illustrating the mechanisms and clinical consequences of sepsis-induced immunosuppression, divided into innate and adaptive immune responses. The 'Innate immunity' section details dysfunctions in neutrophils (increased immature forms, excessive NETs), monocytes (tolerant phenotype), MDSCs (expansion), dendritic cells (elevated apoptosis), and NK cells (impaired cytotoxicity), leading to defective pathogen clearance and abnormal inflammatory responses. The 'Adaptive immunity' section highlights T cell and B cell changes, including enhanced apoptosis, global anergy, decreased TCR diversity, and reduced immunoglobulin production, culminating in severe lymphopenia. These convergent pathways result in a central state of 'Immunosuppression.' The bottom of the flowchart depicts the long-term clinical sequelae of this state: increased susceptibility to secondary infections, chronic critical illness, and elevated long-term mortality. The diagram serves as an educational summary of immune paralysis for medical students and clinicians studying critical care immunology.
complement activation pathways classical alternative lectin
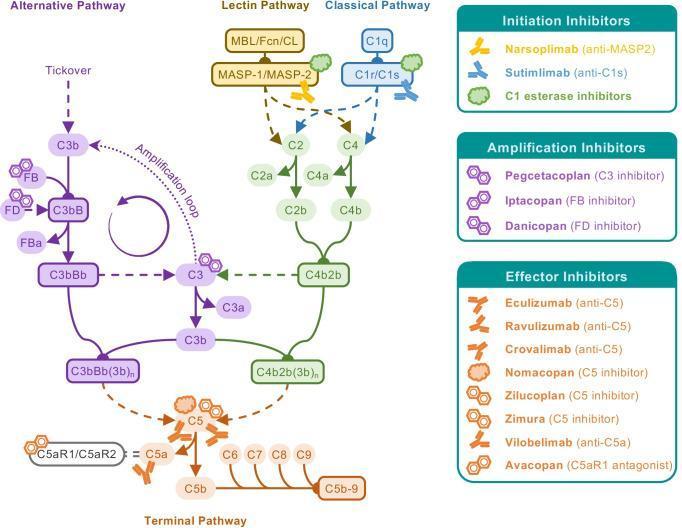
A comprehensive pathophysiology diagram illustrating the three activation pathways of the human complement system—Alternative, Lectin, and Classical—and their convergence into the Terminal Pathway. The Classical pathway is initiated by C1q and C1r/s complexes, the Lectin pathway by MBL/Fcn/CL and MASP-1/2 complexes, and the Alternative pathway via spontaneous 'tickover' starting with C3b. The diagram details the formation of C3 convertases (C3bBb and C4b2b) and C5 convertases, leading to the terminal assembly of the Membrane Attack Complex (MAC, C5b-9) and the release of anaphylatoxins C3a and C5a. Superimposed on the biochemical cascade are clinical therapeutic targets and their respective inhibitors. 'Initiation Inhibitors' include Narsoplimab and Sutimlimab; 'Amplification Inhibitors' include Pegcetacoplan, Iptacopan, and Danicopan; and 'Effector Inhibitors' include Eculizumab, Ravulizumab, and Avacopan. This educational infographic serves as a guide for understanding complement-driven diseases and the pharmacological mechanisms of current and emerging biological treatments.
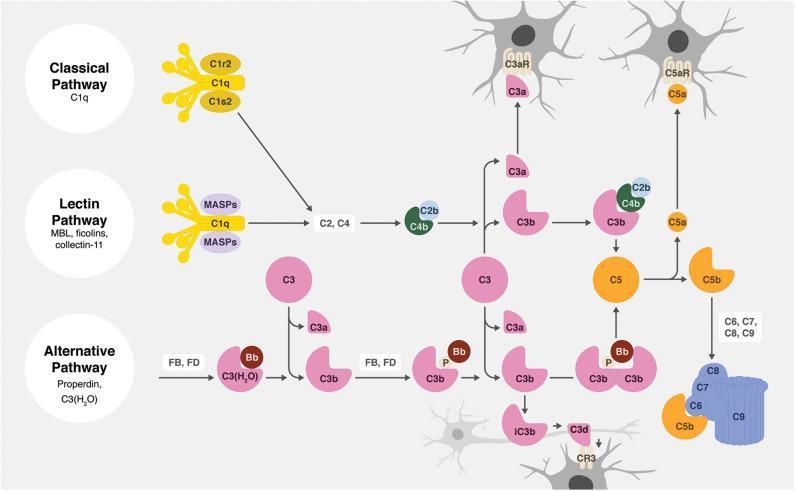
A comprehensive pathophysiology diagram illustrating the three activation pathways of the human complement system: Classical, Lectin, and Alternative. The Classical pathway is initiated by C1q (complexed with C1r2 and C1s2); the Lectin pathway utilizes MBL, ficolins, and collectin-11 with MASPs; and the Alternative pathway involves Properdin and C3(H2O) with Factors B and D. All three pathways converge at the enzymatic cleavage of C3 into C3a and C3b. The C4b2b complex (C3 convertase) is shown mediating this in the classical/lectin routes, while C3bBb performs this in the alternative route. The downstream cascade leads to C5 cleavage, producing the anaphylatoxin C5a and fragment C5b. Educational highlights include the assembly of the Membrane Attack Complex (MAC, C5b-9) depicted as a blue pore-forming structure, and the production of opsonins (iC3b, C3d). The diagram specifically contextualizes the immune response within the nervous system, showing receptors like C3aR, C5aR, and CR3 on glial-like cells, illustrating the role of complement in neuroinflammation or synaptic pruning.
MHC antigen presentation T cell activation
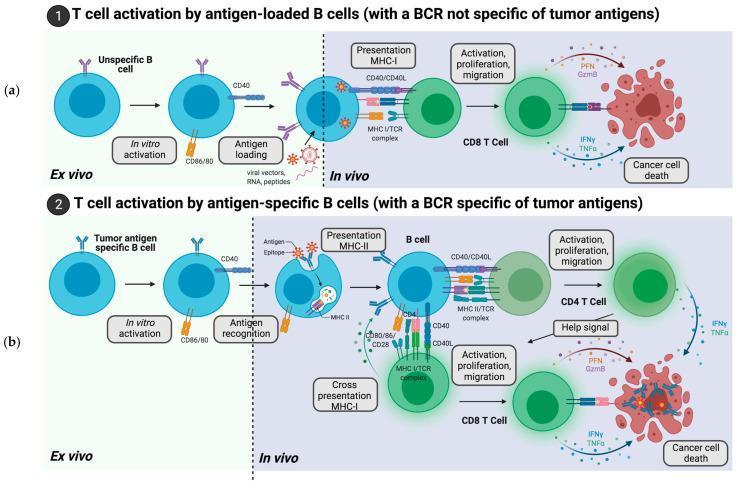
A pathophysiology diagram illustrating two pathways for B cell-mediated tumor-specific T cell activation. The diagram is divided into 'Ex vivo' and 'In vivo' stages across two panels: (a) T cell activation by antigen-loaded B cells and (b) T cell activation by antigen-specific B cells. In panel (a), an unspecific B cell is activated in vitro to express CD86/80 and CD40, then loaded with tumor antigens via viral vectors or peptides. In vivo, it presents antigens on MHC-I to activate CD8+ T cells via MHC-I/TCR and CD40/CD40L interactions, leading to CD8+ proliferation and secretion of lytic molecules (perforin, granzyme B) and cytokines (IFNy, TNFa) to induce cancer cell death. In panel (b), a tumor-specific B cell undergoes similar in vitro activation but utilizes its B-cell receptor (BCR) for in vivo antigen recognition. This pathway results in antigen presentation on MHC-II to activate CD4+ T cells and cross-presentation on MHC-I to activate CD8+ T cells. Additional costimulation via CD80/86 and CD28 is shown. CD4+ T cells provide a 'help signal' to CD8+ cells, resulting in a coordinated immune response and cancer cell lysis.
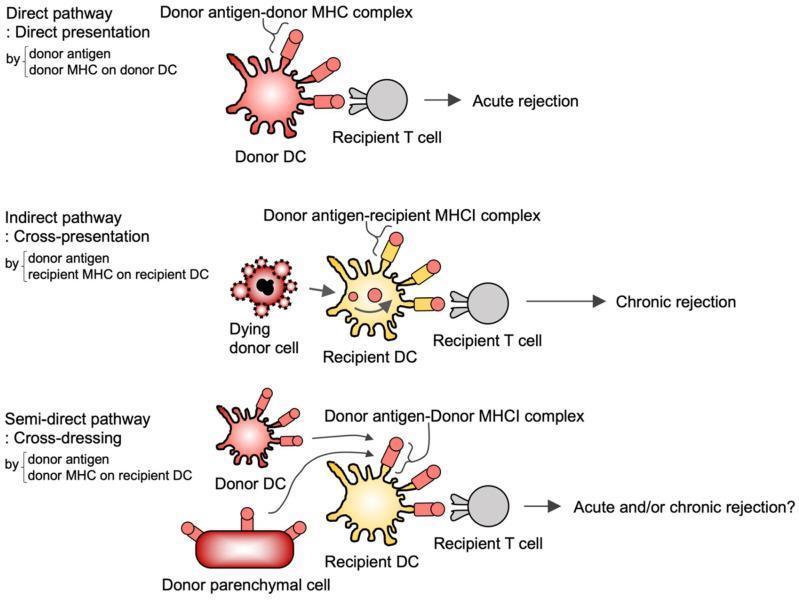
A pathophysiology diagram illustrating three pathways of alloreactive T cell activation in the context of allograft transplantation: direct, indirect, and semi-direct. 1) Direct Pathway (Direct Presentation): A red Donor Dendritic Cell (DC) presents donor antigen-donor MHC complexes directly to a Recipient T cell, leading to acute rejection. 2) Indirect Pathway (Cross-presentation): A dying donor cell is phagocytosed by a yellow Recipient DC, which then presents donor antigen-recipient MHCI complexes to a Recipient T cell, promoting chronic rejection. 3) Semi-direct Pathway (Cross-dressing): Recipient DCs acquire preformed donor antigen-donor MHCI complexes from donor DCs or donor parenchymal cells via trogocytosis (membrane transfer). The cross-dressed Recipient DC then interacts with a Recipient T cell, potentially leading to acute and/or chronic rejection. The diagram uses color-coded cells (red for donor, yellow for recipient, grey for T cells) and labeled molecular complexes to distinguish between direct recognition of alloantigens and recipient-mediated antigen processing.
Immune Response - Microbiology (BPT 2nd Year)
1. Introduction
| Feature | Innate Immunity | Adaptive Immunity |
|---|---|---|
| Speed | Immediate (minutes-hours) | Slow (days-weeks) |
| Specificity | Broad (pattern recognition) | Highly specific (antigen-specific) |
| Memory | Limited | Yes (immunological memory) |
| Components | Skin, macrophages, neutrophils, NK cells, complement | T lymphocytes, B lymphocytes, antibodies |
| Diversity | Low (germline encoded) | Very high (somatic recombination) |
2. Innate Immunity (Non-Specific Immunity)
Components of Innate Immunity
- Skin (intact epidermis) - first line of defense
- Mucous membranes with cilia
- Acidic secretions (gastric acid, sweat, vaginal secretions)
- Lysozyme in tears and saliva
- Normal flora competition
- Neutrophils - first cells recruited to infection sites; major phagocytes during acute inflammation
- Macrophages - tissue-resident phagocytes; process and present antigens; produce cytokines
- Dendritic cells (DCs) - most specialized antigen-presenting cells (APCs); bridge innate and adaptive immunity; transport antigens to lymphoid organs
- Natural Killer (NK) cells - kill virus-infected cells and tumor cells without prior sensitization
- Mast cells - release histamine and other mediators in allergic and parasitic responses
- Innate Lymphoid Cells (ILCs) - produce cytokines rapidly
- Complement system (see below)
- Interferons (IFN-α, IFN-β) - antiviral proteins; stimulate NK cell activity
- Acute phase proteins - C-reactive protein (CRP), mannose-binding lectin (MBL)
- Cytokines - TNF, IL-1, IL-6, IL-12 (pro-inflammatory)
Pattern Recognition
- LPS (gram-negative bacteria) → TLR4
- Peptidoglycan → TLR2
- Flagellin → TLR5
- dsRNA (viruses) → TLR3
3. Adaptive Immunity (Specific Immunity)
Cardinal Features
- Specificity - responds to specific antigens/epitopes
- Diversity - can recognize 10^7 to 10^9 distinct antigenic determinants
- Memory - stronger, faster response on re-exposure
- Self-tolerance - does not attack host tissues
- Clonal expansion - multiplication of antigen-specific cells
Development of Adaptive Immune Response (Steps)
- Antigen entry - invades through epithelial barriers
- Antigen capture - DCs pick up antigen and migrate to lymph nodes
- Antigen presentation - APCs present peptides to naive T cells
- Lymphocyte activation - T and B cells become activated
- Clonal expansion - proliferation of antigen-specific cells
- Effector phase - elimination of antigen (antibodies, cytotoxic killing)
- Contraction - most effector cells die by apoptosis
- Memory - long-lived memory cells persist
4. Humoral Immunity (B Cell - Antibody Mediated)
Antibody Classes (Immunoglobulins)
| Class | Function |
|---|---|
| IgG | Most abundant; opsonization; crosses placenta (passive immunity to newborn); activates complement; longest half-life (~3 weeks) |
| IgM | First antibody produced in primary response; pentamer; best complement activator |
| IgA | Found in secretions (saliva, breast milk, respiratory/GI mucosa); mucosal immunity |
| IgE | Binds mast cells; mediates allergy and anti-parasitic responses |
| IgD | B cell surface receptor; function largely unknown |
Functions of Antibodies
- Neutralization - blocks pathogen from infecting cells (only mechanism that prevents infection before it's established)
- Opsonization - coats microbes for phagocytosis (IgG + Fc receptors on phagocytes)
- Complement activation - IgG and IgM activate classical complement pathway
- Antibody-Dependent Cell-Mediated Cytotoxicity (ADCC) - NK cells kill IgG-coated targets
- Mucosal protection - IgA in secretions
Key: Helper T cells (CD4+) are required for B cells to respond to protein antigens. This is called T-dependent B cell activation. It also enables isotype switching (IgM → IgG/IgA/IgE) and affinity maturation. Source: Cellular and Molecular Immunology
5. Cell-Mediated Immunity (T Cell Mediated)
Two Main Types of T Cells
- Recognize antigen on MHC class II (on APCs: DCs, macrophages, B cells)
- Activate other immune cells via cytokines
- Subtypes:
- Th1: secrete IFN-γ; activate macrophages for intracellular killing
- Th2: secrete IL-4, IL-5, IL-13; help B cells, anti-parasitic response
- Th17: secrete IL-17; anti-fungal and anti-bacterial (extracellular)
- T-reg (Treg): secrete IL-10, TGF-β; suppress immune responses and maintain self-tolerance
- Recognize antigen on MHC class I (on all nucleated cells)
- Kill virus-infected cells, tumor cells
- Mechanisms: release perforin (pore-forming) and granzymes (activate apoptosis)
MHC Class I vs Class II
| Feature | MHC Class I | MHC Class II |
|---|---|---|
| Found on | All nucleated cells | APCs (DCs, macrophages, B cells) |
| Presents to | CD8+ T cells | CD4+ T cells |
| Antigen source | Endogenous (intracellular, e.g., viruses) | Exogenous (phagocytosed pathogens) |
6. Complement System
Three Activation Pathways
| Pathway | Trigger | First component |
|---|---|---|
| Classical | Antigen-antibody complex (IgM or IgG) | C1q |
| Alternative | Microbial surface (LPS, polysaccharides) without antibody | C3b, Factor B, Factor D |
| Lectin | Mannose-binding lectin (MBL) binds microbial carbohydrates | MBL/MASP |
Functions of Complement
- Inflammation - C3a, C4a, C5a are anaphylatoxins → recruit neutrophils, release histamine, increase vascular permeability
- Opsonization - C3b coats microbes → facilitates phagocytosis
- Cell lysis - MAC creates pores in bacterial membrane → cell death (especially Neisseria)
7. Cytokines - Key Messengers
| Cytokine | Source | Function |
|---|---|---|
| IL-1, IL-6, TNF-α | Macrophages | Pro-inflammatory; fever; acute phase response |
| IL-2 | T cells | T cell proliferation |
| IL-4 | Th2 | IgE production, allergy |
| IL-5 | Th2 | Eosinophil activation |
| IFN-γ | Th1, NK cells | Macrophage activation; anti-viral |
| IFN-α/β | Virus-infected cells | Antiviral; stimulate NK cells |
| IL-10 | Treg, macrophages | Anti-inflammatory; suppress immune response |
| TGF-β | Treg | Suppress inflammation; tolerance |
| IL-12 | DCs, macrophages | Promote Th1 differentiation; NK activation |
8. Primary vs Secondary Immune Response
| Feature | Primary Response | Secondary Response |
|---|---|---|
| First exposure? | Yes | No (re-exposure) |
| Lag period | Longer (7-10 days) | Shorter (1-3 days) |
| Antibody level | Lower | Much higher |
| Antibody class | IgM first, then IgG | Predominantly IgG |
| Affinity | Lower | Higher (affinity maturation) |
| Duration | Shorter | Longer |
| Basis | Naive lymphocyte activation | Memory cell activation |
9. Types of Immunity - Summary
| Type | Mechanism | Example |
|---|---|---|
| Active natural | Infection → own immune response | Recovery from measles |
| Active artificial | Vaccination | Polio vaccine |
| Passive natural | Maternal IgG via placenta/breast milk | Neonatal immunity |
| Passive artificial | Injection of antibodies/antiserum | Anti-tetanus serum |
10. Immunological Memory
- Memory T cells and Memory B cells survive for years in lymphoid tissues and bone marrow
- On re-exposure, they rapidly expand and differentiate into effector cells
- Secondary responses are faster, stronger, and more specific
- Long-lived plasma cells in bone marrow continuously secrete low-level antibodies, providing immediate protection
Quick Revision Points for Exam
- Innate = non-specific, fast, no memory | Adaptive = specific, slow, has memory
- PRRs (TLRs) recognize PAMPs on pathogens
- MHC I → CD8+ CTL | MHC II → CD4+ Helper T cell
- Plasma cells secrete antibodies | Memory cells provide long-term protection
- IgM = first in primary response; IgG = crosses placenta; IgA = secretory/mucosal; IgE = allergy
- Complement pathways (Classical, Alternative, Lectin) → MAC → cell lysis; C3b = opsonin; C3a/C5a = anaphylatoxins
- Th1 = intracellular pathogens (IFN-γ) | Th2 = extracellular/parasites (IL-4/IL-5) | Treg = suppression
- Vaccination works by creating immunological memory (secondary response)