
Growth charts
Reading File
Growth charts are tools used in pediatrics to monitor a child's physical development over time by plotting measurements against age-based reference data. The main parameters tracked are height/length, weight, head circumference (in younger children), and BMI-for-age.
Searching sources...
Finding Sources
Finding Sources
Good sources found. Let me read the key sections from Park's and Harriet Lane.
Reading File
Reading File
Reading File
Reading File
Now let me get the uses of growth chart section and fetch a relevant chart image.
Reading File
Finding Sources
Now let me fetch the comparison chart image and the ICDS growth chart image:
Loading Image
Finding Sources
I now have all the information needed for a thorough answer. Let me compile it.
Growth Charts
A growth chart (also called the "road-to-health" chart) is a visual display of a child's physical growth and development over time. First designed by David Morley and later modified by the WHO, it is primarily used for the longitudinal follow-up (growth monitoring) of a child so that changes over time can be interpreted.
- Park's Textbook of Preventive and Social Medicine, p. 637
Why Weight is the Primary Measure
Weight is the most sensitive measure of growth - any deviation from normal can be detected easily by comparison with reference curves. A child can lose weight but not height. Growth charts offer a simple, inexpensive way to monitor weight gain and, by extension, overall child health.
Standard Growth Chart Systems
WHO Child Growth Standards (2006) - for children < 2 years
The WHO conducted the Multicentre Growth Reference Study (MGRS) between 1997 and 2003 in Brazil, Ghana, India, Norway, Oman and USA, gathering data from 9,440 healthy breast-fed infants and young children (0-60 months) from diverse ethnic backgrounds. Mothers followed best practices: breastfeeding, non-smoking.
Standards generated include (for boys and girls, 0-60 months):
- Length/height-for-age
- Weight-for-age
- Weight-for-length
- Weight-for-height
- BMI-for-age
CDC Growth Charts - for children ≥ 2 years
As per the Harriet Lane Handbook, the standard recommendation is:
- < 24 months: WHO international growth charts
- ≥ 2 years: CDC growth charts
Premature Infants
- Use corrected age (chronological age minus weeks of prematurity) up to 3 years
- Fenton, Bertino, and Olsen charts are used from birth up to ~50 weeks corrected
- After 4-8 weeks post-term, the WHO chart applies
Condition-Specific Charts
Condition-specific charts exist for: Down syndrome, Prader-Willi syndrome, Williams syndrome, Cornelia de Lange syndrome, Turner syndrome, and Marfan syndrome - however, WHO or CDC charts are still recommended alongside them.
- The Harriet Lane Handbook, 23rd ed., p. 756
WHO vs. NCHS Comparison (Weight-for-Age Z-scores, Girls 0-60 months)
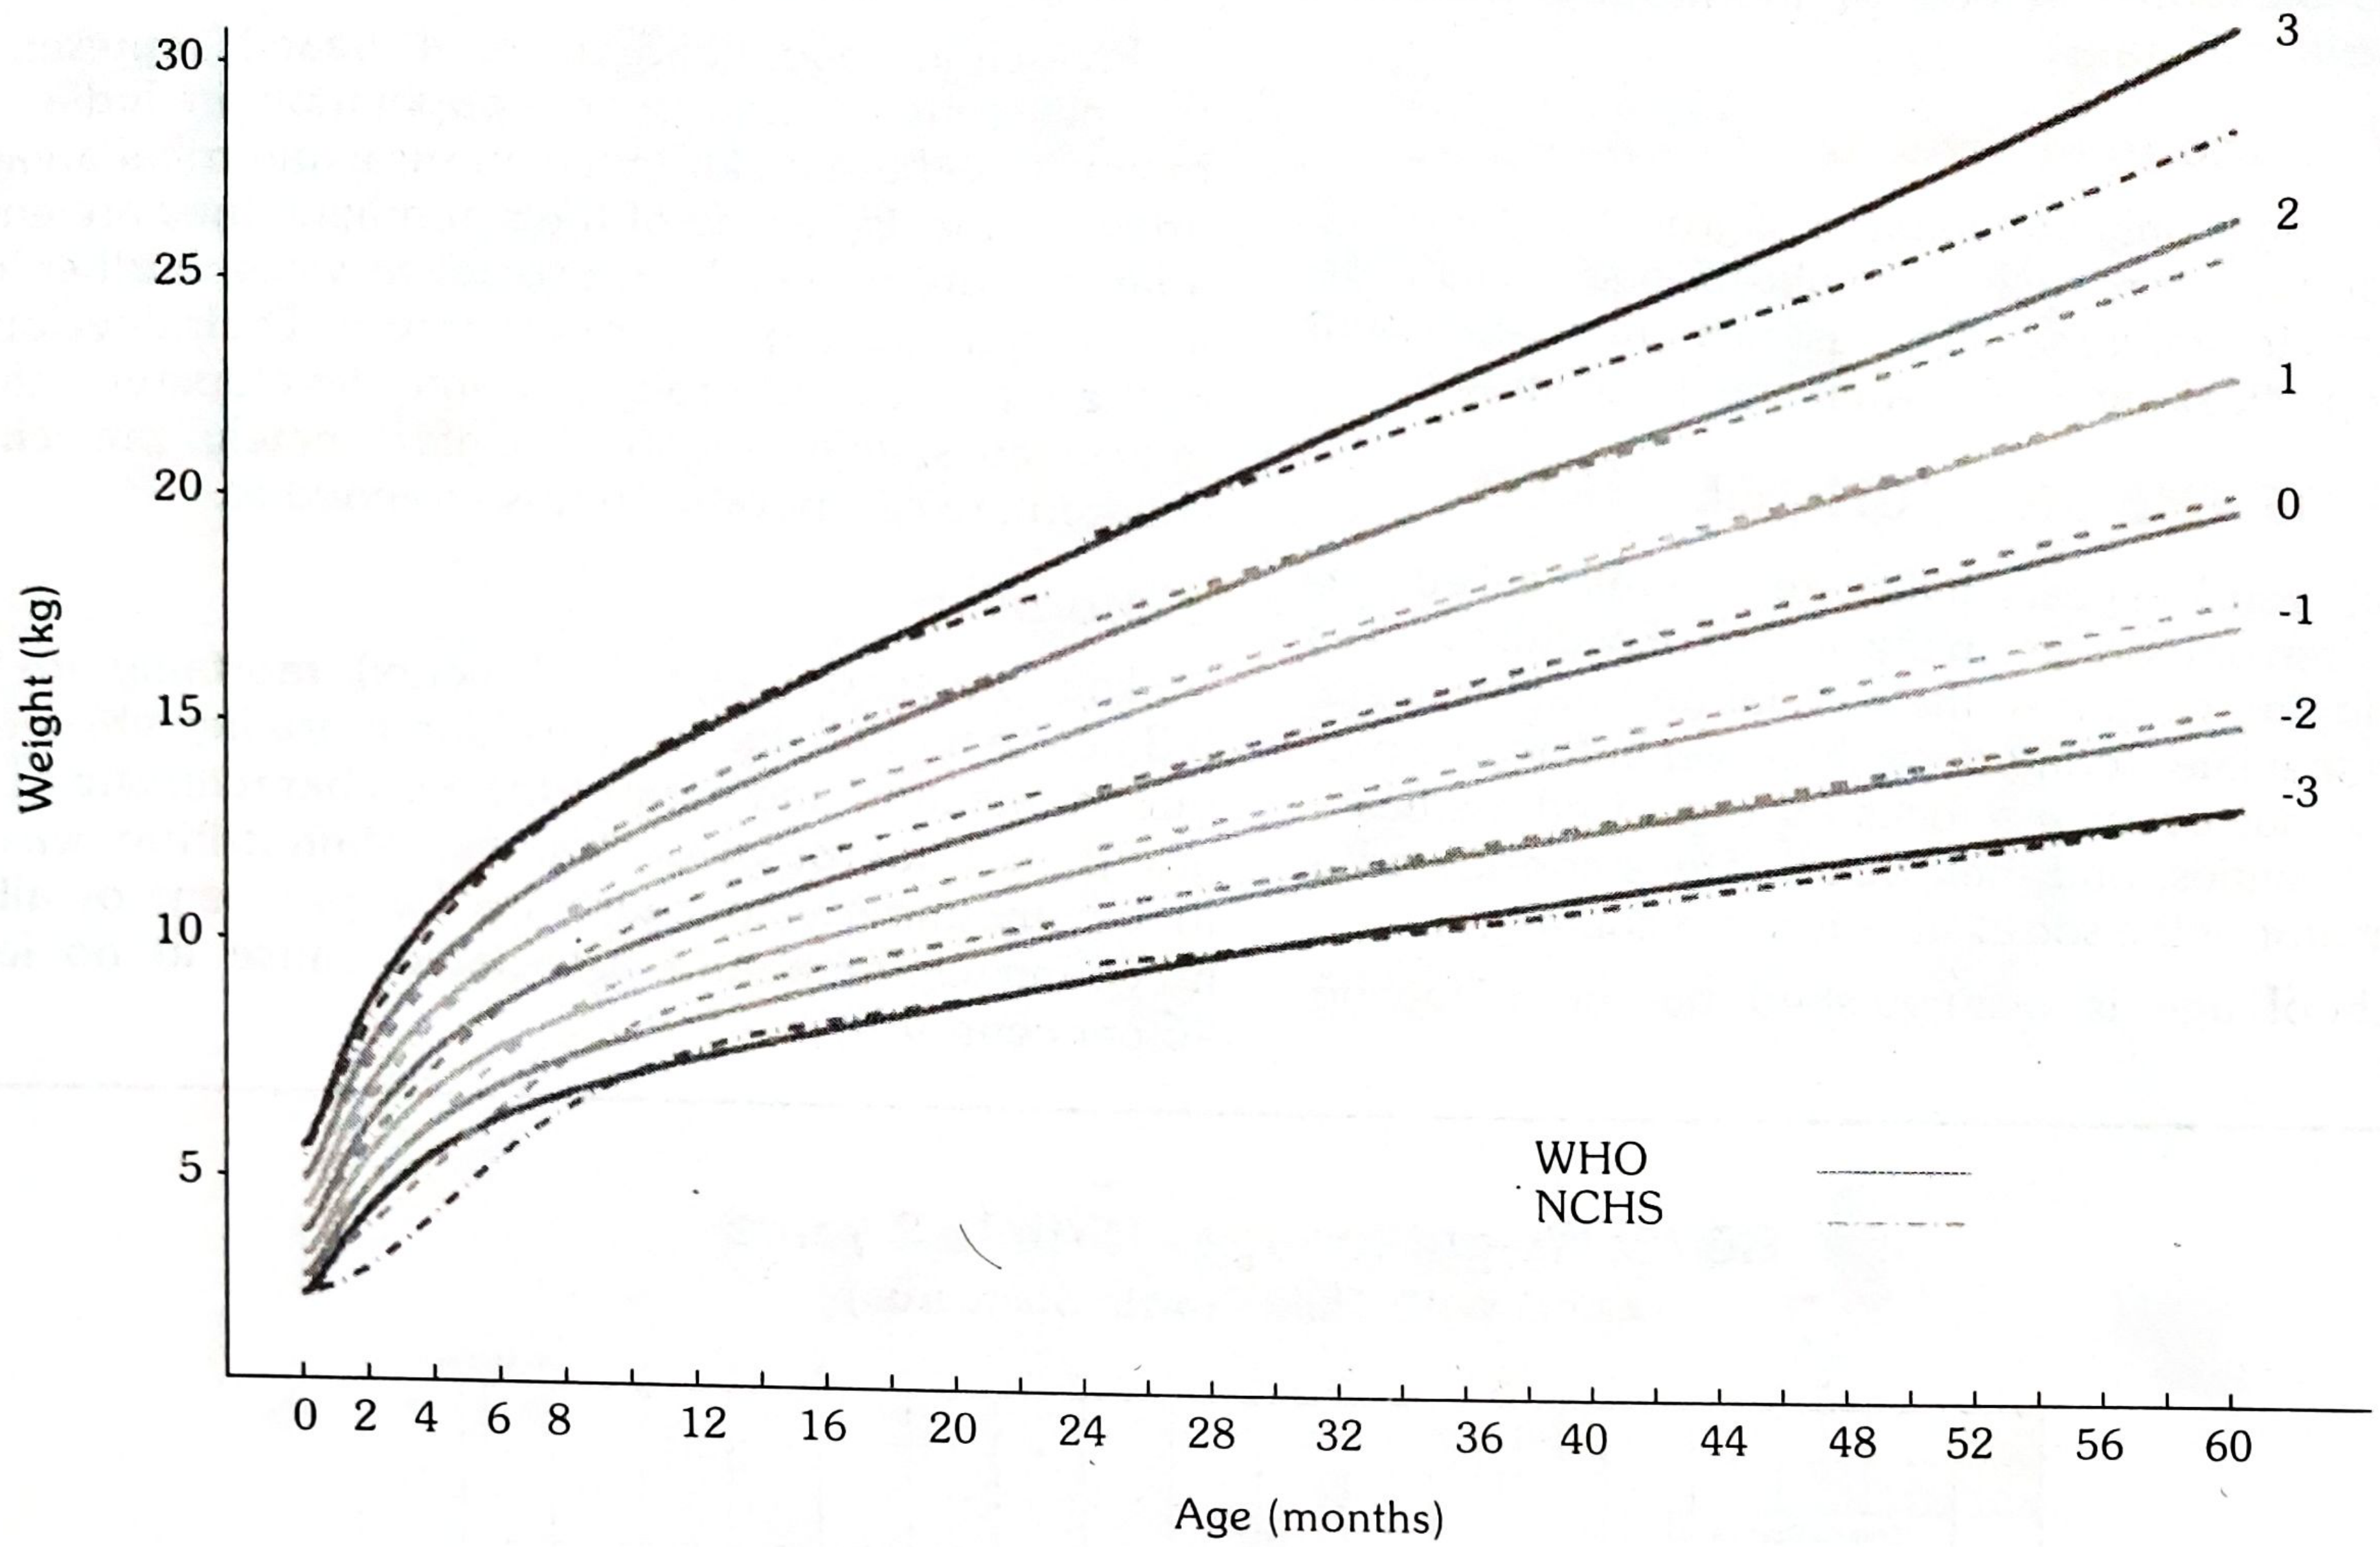
Fig. 6 - Solid lines = WHO standards; dashed lines = NCHS reference. Z-score bands labelled -3 to +3. Differences are most notable in infancy.
Key differences when using WHO vs. NCHS:
- Stunting is greater throughout childhood with WHO standards
- Underweight rates increase in the first half of infancy with WHO standards, then decrease
- Wasting rates are substantially higher with WHO standards during infancy
- Overweight prevalence is higher with WHO standards
Interpretation Thresholds (Harriet Lane)
| Parameter | Threshold | Interpretation |
|---|---|---|
| Length/Height-for-age | < 5th percentile | Stunting / short stature |
| Weight-for-length (< 2 yr) | < 5th percentile | Underweight |
| BMI-for-age (≥ 2 yr) | < 5th percentile | Underweight |
| BMI-for-age | 5th to < 85th percentile | Healthy weight |
| BMI-for-age (≥ 2 yr) | 85th to < 95th percentile | Overweight |
| BMI-for-age (≥ 2 yr) | ≥ 95th percentile | Obese |
| Weight-for-length (< 2 yr) | > 95th percentile | Overweight |
Normal Growth Milestones (Harriet Lane)
| Age | Expected Growth |
|---|---|
| Birth to 2 weeks | Lose 5-10% birth weight, then regain |
| 0-3 months | 20-30 g/day weight gain |
| 3-9 months | 15-22 g/day weight gain |
| 9-12 months | 6-11 g/day weight gain |
| 4-5 months | Birth weight doubled |
| 1 year | Birth weight tripled |
| 3-4 years | Birth length/height doubled |
| 3-10 years | ~2.5 inches (6.3 cm)/year height gain |
| 4 years | Average: 40 inches, 35 lb |
Uses of the Growth Chart
Per Park's (p. 637), a growth chart has multiple roles:
- Growth monitoring - longitudinal follow-up; the direction of the curve matters more than the absolute position
- Diagnostic tool - identifies "high-risk" children; malnutrition can be detected before clinical signs appear
- Planning and policy - provides objective basis for health policy at local and national levels
- Educational tool - the visual nature helps educate mothers and encourages active participation in child care
- Tool for action - prompts the health worker and mother to act when growth falters
- Passport to child health care - internationally recognized standard of child health monitoring
Key Principle: Direction Over Position
"It is the direction of growth that is more important than the position of dots on the line."
- Flattening or falling of the weight curve = growth failure - the earliest sign of protein-energy malnutrition, often preceding clinical signs by weeks to months.
Growth Chart in India (ICDS)
India adopted the WHO Child Growth Standards 2006 in February 2009 for use in the National Rural Health Mission and ICDS program. A joint "Mother and Child Protection Card" was developed that incorporates the growth chart and:
- Family/birth/pregnancy records
- Immunization schedule
- Breastfeeding and complementary feeding guidance
- Developmental milestones
- Zones: Normal, Undernutrition (< -2 SD), Severely Underweight (< -3 SD)
The card is kept by the mother and brought to every health centre visit.
Alternative Growth Monitoring Indicators
Beyond weight-for-age charts, other indicators include:
-
Height-for-age (detects stunting)
-
Weight-for-height (detects wasting; independent of age)
-
Mid-upper arm circumference (MUAC) - especially useful when age is unknown
-
Park's Textbook of Preventive and Social Medicine, p. 637-638
-
The Harriet Lane Handbook, 23rd ed., p. 756-757
Epidemology studies parks text book
Epidemiological studies are research designs used to investigate the distribution and determinants of disease in populations. The main types are observational (descriptive and analytical) and experimental.
Searching sources...
Finding Sources
This is a shared conversation. Sign in to Orris to start your own chat.