

Explain
menstrual cycle hormonal changes FSH LH estrogen progesterone luteal phase diagram
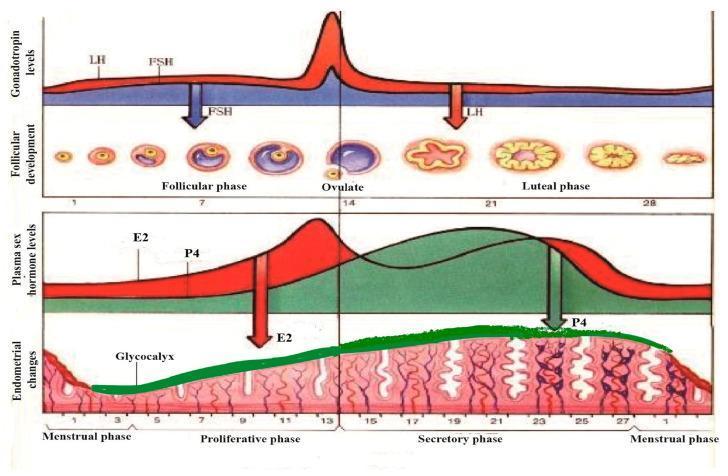
A multi-panel pathophysiology diagram illustrating the synchronous physiological changes during a standard 28-day human menstrual cycle. The top panel graphs gonadotropin levels, showing a sharp surge in Luteinizing Hormone (LH) and a moderate rise in Follicle-Stimulating Hormone (FSH) at day 14, correlating with the follicular phase, ovulation, and luteal phase stages. The corresponding follicular development shows the maturation of a primary follicle into a Graafian follicle, ovulation, and the formation of the corpus luteum and corpus albicans. The middle panel tracks plasma sex hormone levels, highlighting the mid-cycle peak of Estradiol (E2) and the post-ovulatory rise of Progesterone (P4). The bottom panel depicts endometrial morphology, transitioning from the menstrual phase to the proliferative and secretory phases. A green-shaded layer highlights the glycocalyx development, which thickens and becomes most prominent during the secretory phase under the influence of P4, before thinning during menstruation. The diagram demonstrates the hormonal regulation of the ovary and uterine lining for medical educational purposes.
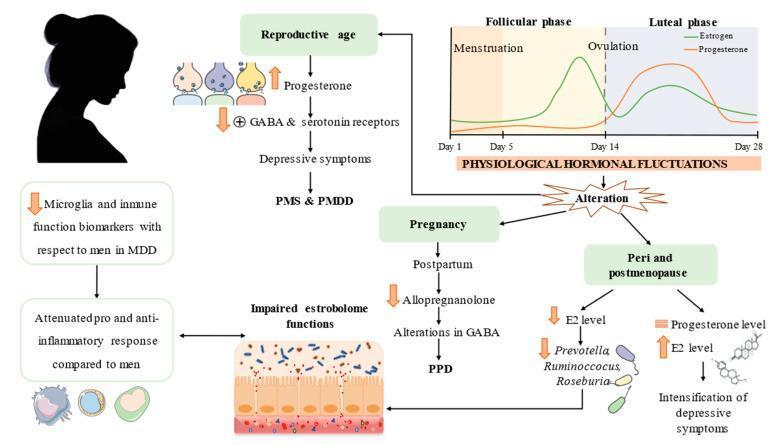
This pathophysiology diagram illustrates hallmarks of major depressive disorder (MDD) across various stages of the female reproductive lifespan, including reproductive age, pregnancy, and peri- and postmenopause. A line graph labeled 'Physiological Hormonal Fluctuations' depicts the 28-day menstrual cycle, showing estrogen peaks prior to ovulation (Day 14) and progesterone dominance during the luteal phase. A signaling pathway shows how progesterone fluctuations lead to GABA and serotonin receptor modulation, contributing to premenstrual syndrome (PMS) and premenstrual dysphoric disorder (PMDD). In the pregnancy/postpartum pathway, reduced allopregnanolone levels and GABA alterations are linked to postpartum depression (PPD). The peri- and postmenopausal section illustrates declining estradiol (E2) and progesterone, linked to the intensification of depressive symptoms. The diagram also highlights secondary factors, including impaired estrobolome function (gut-microbiome-estrogen axis) involving bacteria like Prevotella and Ruminococcus, and an immune component characterized by attenuated microglia and inflammatory responses compared to men. This visualization integrates endocrinology, neurobiology, and immunology to explain sex-specific vulnerabilities in mood disorders.
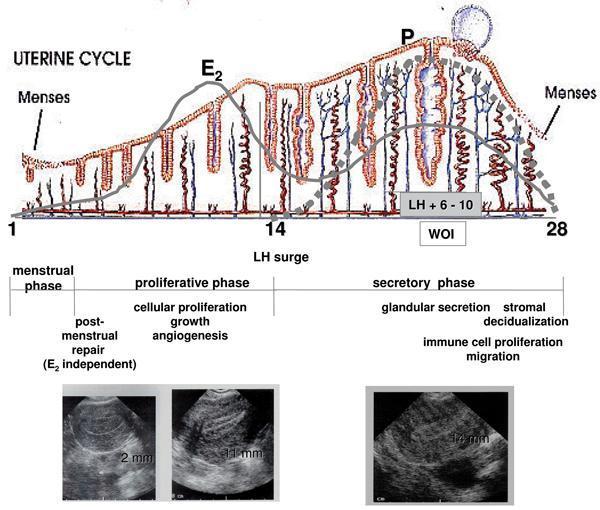
This composite educational graphic illustrates the morphological and hormonal changes of the human endometrium across a standard 28-day uterine cycle. The top section features a pathophysiology diagram showing fluctuations in estradiol (E2) and progesterone (P). E2 peaks during the proliferative phase, correlating with endometrial growth, while P dominates the secretory phase, driving glandular coiling and the 'window of implantation' (WOI). Below the hormone curves, a cross-sectional illustration depicts the histological evolution of endometrial glands and spiral arteries. It transitions from a thin, shedding layer in the menstrual phase to elongated glands during the proliferative phase, and finally to highly coiled, secretory glands with increased angiogenesis in the secretory phase. The bottom section displays three diagnostic ultrasound images of the uterus, providing clinical correlation of endometrial thickness: 2 mm (early proliferative), 11 mm (late proliferative), and 14 mm (mid-secretory). Key physiological processes such as post-menstrual repair, cellular proliferation, angiogenesis, and stromal decidualization are annotated to link hormonal signaling with macroscopic and microscopic changes.
The Menstrual Cycle: Days 21-25 = Mid-Luteal Phase
Where are days 21-25 in the cycle?
- Days 1-14: Follicular phase (ends with ovulation ~day 14)
- Days 15-28: Luteal phase (dominated by the corpus luteum)
- Days 21-25 = approximately 7-11 days after ovulation = the peak of the luteal (secretory) phase
What happens hormonally in the luteal phase?
| Hormone | Level | Reason |
|---|---|---|
| Progesterone | HIGH (peak ~day 21) | Corpus luteum secretes it heavily; prepares endometrium for implantation |
| Estrogen | HIGH (moderate secondary peak) | Corpus luteum also secretes estrogen, though less than progesterone |
| LH | LOW | High progesterone + estrogen exert negative feedback on the hypothalamus-pituitary axis, suppressing LH |
| FSH | LOW | Same negative feedback suppresses FSH to prevent new follicle recruitment |
Why is Answer D (the incorrect choice) wrong?
- Estrogen is NOT at its lowest - the corpus luteum produces a secondary estrogen rise alongside progesterone.
- Estrogen only falls (along with progesterone) in the late luteal phase (days 26-28) when the corpus luteum involutes in the absence of implantation.
Why are FSH and LH low?
Summary mnemonic for the luteal phase:
"Post-ovulation = Progesterone Peaks, Estrogen Elevated, FSH/LH Falls"
- Corpus luteum = the factory for both P4 and E2
- High P4 + E2 = negative feedback = low FSH + LH
- Correct answer: C