
Diagram of pathophysiology of cerebral edema
diagram pathophysiology of cerebral edema vasogenic cytotoxic interstitial osmotic mechanisms
cerebral edema pathophysiology
cerebral edema pathophysiology vasogenic cytotoxic interstitial osmotic review
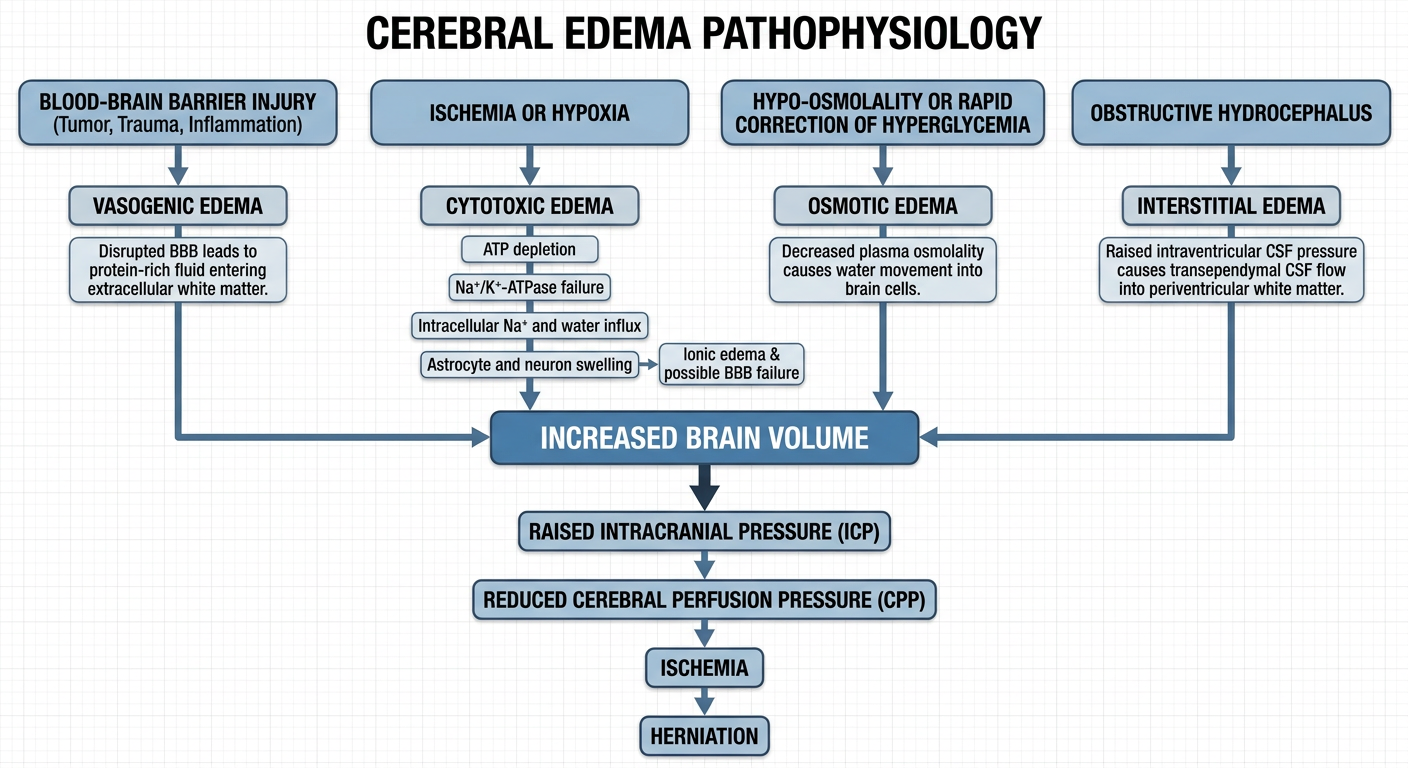
Educational medical flowchart diagram of cerebral edema pathophysiology. Start with four causes: blood-brain barrier injury (tumor, trauma, inflammation), ischemia or hypoxia, hypo-osmolality or rapid correction of hyperglycemia, and obstructive hydrocephalus. Show vasogenic edema: disrupted blood-brain barrier leads to protein-rich fluid entering extracellular white matter. Show cytotoxic edema: ATP depletion causes Na+/K+-ATPase failure, intracellular Na+ and water influx, astrocyte and neuron swelling; then ionic edema and possible blood-brain barrier failure. Show osmotic edema: decreased plasma osmolality causes water movement into brain cells. Show interstitial edema: raised intraventricular CSF pressure causes transependymal CSF flow into periventricular white matter. Merge all pathways into increased brain volume, raised intracranial pressure, reduced cerebral perfusion pressure, ischemia, and herniation. Include simple labels and arrows; make it medically accurate and easy to study.
Key pathways
- Vasogenic edema: blood-brain barrier disruption permits protein-rich plasma fluid to enter the extracellular space, mainly white matter. Typical settings include tumors, trauma, inflammation, and severe hypertension.
- Cytotoxic edema: ischemia or hypoxia causes ATP depletion and Na+/K+-ATPase failure. Sodium and water enter neurons and astrocytes, producing intracellular swelling. It commonly precedes ionic and vasogenic edema in ischemic injury.
- Osmotic edema: decreased plasma osmolality drives water into brain cells, such as with severe hyponatremia or water intoxication.
- Interstitial edema: obstructive hydrocephalus raises intraventricular CSF pressure, driving CSF across the ependyma into periventricular white matter.
Why hypokalemia increases risk of osmotic demyelination syndrome
hypokalemia AND osmotic demyelination
hypokalemia increases risk osmotic demyelination syndrome mechanism sodium potassium correction
-
It weakens glial-cell osmotic defense.
When extracellular tonicity rises during sodium correction, astrocytes and oligodendrocytes must rapidly restore intracellular osmoles to prevent cellular dehydration and myelin injury. Potassium is an effective intracellular osmole. With potassium depletion, glial cells have less capacity to take up K+ and adapt to the sudden hypertonic extracellular environment. Hypokalemia may also impair insulin-mediated glucose uptake and ATP generation, further limiting this protective response. This mechanism is described in an ODS review. -
Potassium replacement itself raises serum sodium/tonicity.
Administered KCl enters cells, and its effect on effective body cation content is similar to adding sodium. Water shifts out of cells, so the measured serum sodium can rise even if little or no sodium has been infused. Thus, potassium given during treatment of hyponatremia must be counted as part of the overall correction effect. The kidney textbook notes that KCl administration can produce a rapid rise in plasma sodium in patients with chronic hyponatremia and hypokalemia. -
Hypokalemia commonly coexists with other high-risk states.
Alcohol use disorder, malnutrition, diuretic use, liver disease, and severe hyponatremia often coexist with hypokalemia. These conditions also reduce osmotic reserve and increase susceptibility to ODS.