
Give detail about ct sacn
CT scan computed tomography how it works clinical uses 2024
CT scan computed tomography cross-sectional imaging diagram
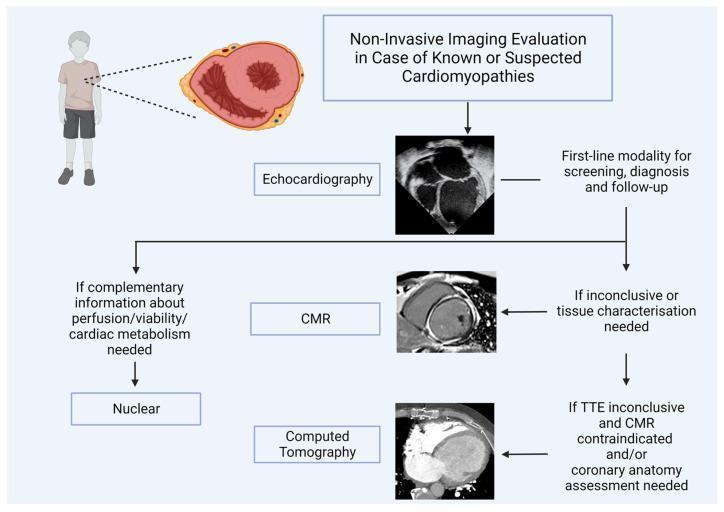
A medical diagnostic flowchart titled 'Non-Invasive Imaging Evaluation in Case of Known or Suspected Cardiomyopathies,' specifically focused on the pediatric population. The algorithm outlines a sequential clinical pathway starting with Echocardiography as the first-line modality for screening, diagnosis, and follow-up. The pathway branches into three secondary modalities based on clinical needs: (1) Cardiac Magnetic Resonance (CMR) is indicated if echocardiography is inconclusive or if tissue characterization is required. (2) Computed Tomography (CT) is selected if Transthoracic Echocardiography (TTE) is inconclusive and CMR is contraindicated, or for specific coronary anatomy assessment. (3) Nuclear imaging is utilized when complementary information regarding myocardial perfusion, viability, or cardiac metabolism is needed. Each modality is paired with a representative clinical image: a 4-chamber echocardiogram view, a short-axis CMR slice, and a cardiac CT scan. A supporting anatomical illustration of a child and a cross-sectional heart diagram (showing hypertrophy/dilation) emphasizes the pediatric cardiology context. The diagram serves as an educational guide for optimizing imaging selection in cardiomyopathies like HCM, DCM, and LVNC.
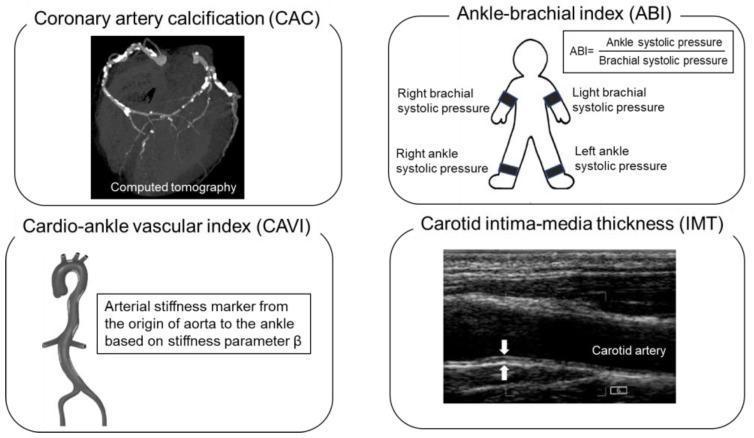
Educational infographic panel demonstrating four non-invasive modalities for atherosclerosis assessment and cardiovascular risk stratification. 1. Coronary Artery Calcification (CAC): A cross-sectional Computed Tomography (CT) scan of the heart showing hyperdense (bright) calcium deposits along the coronary arteries. 2. Ankle-Brachial Index (ABI): A schematic diagram of a human figure indicating systolic blood pressure measurement points at the brachial and ankle arteries, including the calculation formula (Ankle SP / Brachial SP) used to screen for peripheral artery disease. 3. Cardio-Ankle Vascular Index (CAVI): An anatomical diagram of the aorta and central arterial tree, labeled as an arterial stiffness marker derived from the stiffness parameter beta. 4. Carotid Intima-Media Thickness (IMT): A grayscale longitudinal ultrasound image of the carotid artery, with calipers/arrows highlighting the measurement of the vessel wall layers. This compilation serves as a clinical guide for evaluating subclinical atherosclerosis and predicting heart failure risk through diverse imaging and physiological markers.
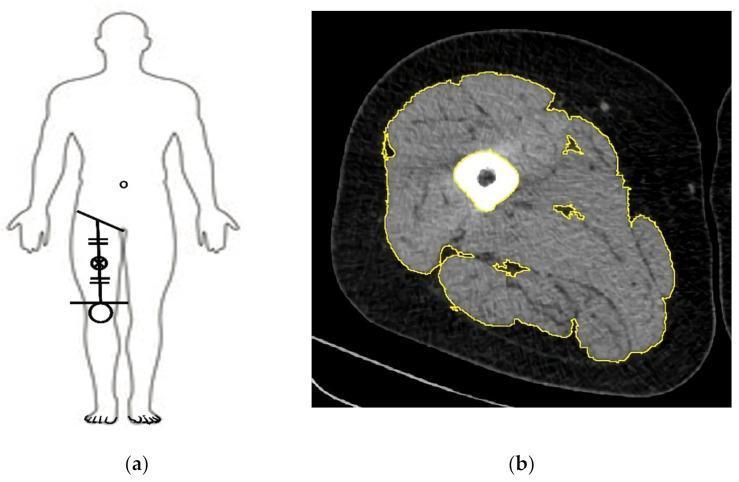
This educational image demonstrates the methodology for measuring Cross-Sectional Muscle Area (CSMA) using Computed Tomography (CT). Panel (a) is a schematic diagram showing a human silhouette with landmarks for mid-thigh CT imaging, located at the midpoint between the inguinal crease and the proximal pole of the patella. Panel (b) is a diagnostic axial CT scan of the mid-thigh. The image highlights tissue differentiation based on Hounsfield units (HU). The central femur is depicted as a high-density (bright) circular structure. The skeletal muscles are manually segmented with yellow outlines to isolate the CSMA, effectively excluding subcutaneous fat, intermuscular fat (low-density/dark areas), and cortical bone. This visualization is used in clinical research to assess sarcopenia, frailty, and nutritional status by quantifying muscle mass and identifying intramuscular adipose tissue infiltration. The segmentation illustrates the anatomical boundaries between the quadriceps, adductors, and hamstring muscle groups.
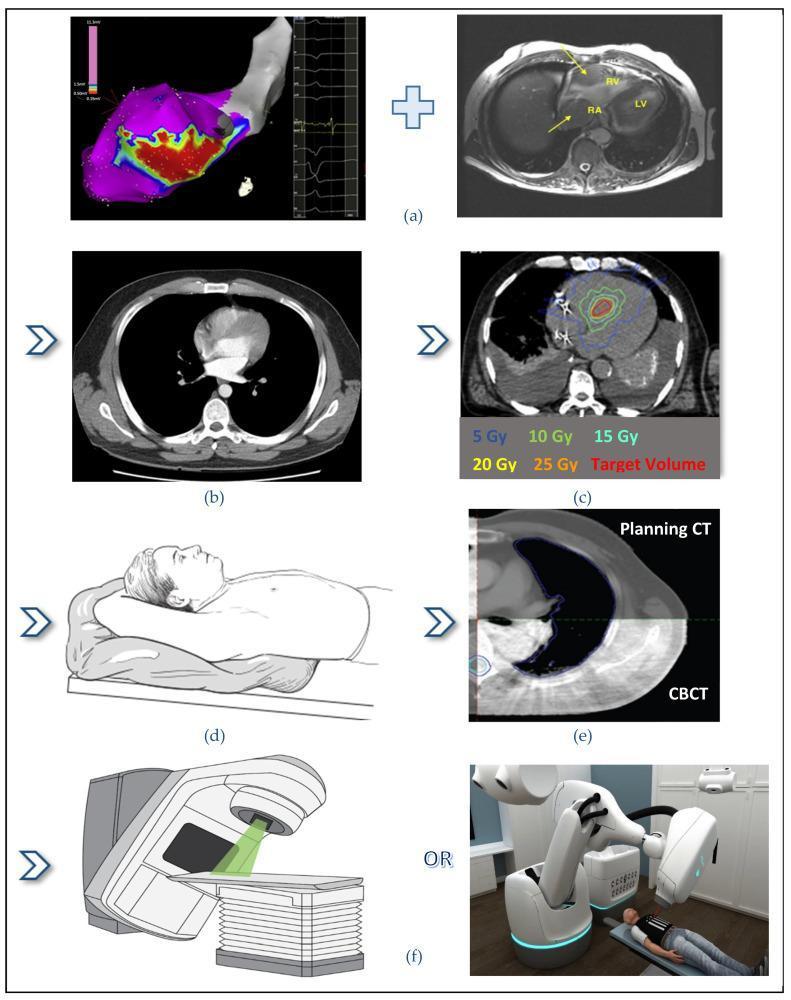
This infographic illustrates the complete workflow for Stereotactic Arrhythmia Radioablation (STAR), a non-invasive treatment for cardiac arrhythmias like ventricular tachycardia. The process is depicted in six stages: (a) target definition through the fusion of electro-anatomical mapping with cardiac imaging; (b) acquisition of a planning computed tomography (CT) scan for anatomical reference; (c) radiotherapy dosimetry planning, showing a cross-sectional thoracic CT with isodose lines ranging from 5 Gy to 25 Gy surrounding the red-highlighted cardiac target volume; (d) patient positioning and immobilization using a vacuum-assisted mold to ensure reproducible setup; (e) image-guided alignment using a comparison between the planning CT and cone-beam CT (CBCT) to verify target accuracy; and (f) radiotherapy delivery options, displaying a conventional linear accelerator (Linac) and a robotic CyberKnife system. The diagram emphasizes the multidisciplinary integration of electrophysiology and radiation oncology for precise, high-dose focal radiation delivery to arrhythmic cardiac substrates.
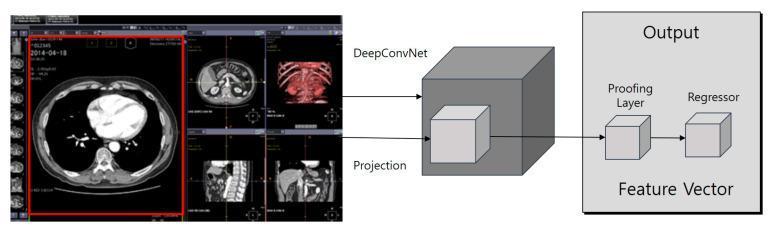
This infographic combines clinical diagnostic imaging with a machine learning architectural diagram, illustrating a Faster R-CNN-based cloud filter system for medical data processing. On the left, a multi-pane interface displays various cross-sectional radiological images. The primary highlighted pane (red border) shows an axial computed tomography (CT) scan of the human thorax at the level of the heart, clearly demonstrating the cardiac chambers, lungs, and spine. Adjacent panes show sagittal and axial views of abdominal structures, along with a 3D volume-rendered image of the thoracic cage and abdominal vasculature. To the right, a computational pipeline outlines the feature extraction process. Input images are fed through 'DeepConvNet' and 'Projection' stages into a central 3D data cube. This feeds into a 'Feature Vector' block containing a 'Proofing Layer' and a 'Regressor', ultimately leading to the 'Output'. This diagram explains the integration of deep learning architectures in automating the verification and reading of EMR and PACS data to reduce clinical diagnostic errors.
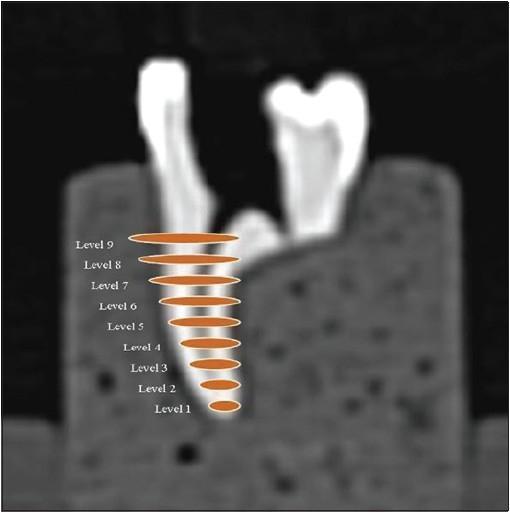
This diagnostic image is a Computed Tomography (CT) scan reconstruction of a human tooth specimen embedded in a mounting block, used for endodontic research. The visual demonstrates an anatomical diagram overlay illustrating the methodology for root canal scanning and analysis. Nine distinct axial section levels are identified, labeled sequentially from 'Level 1' at the apical third to 'Level 9' at the coronal orifice. Each level is highlighted by an orange elliptical marker that represents the cross-sectional plane of the root canal at that specific depth. The diagram shows the natural tapering morphology of the root canal, with the diameter of the orange markers progressively increasing from the narrow apex (Level 1) toward the wider coronal aspect (Level 9). This imaging protocol is clinically relevant for evaluating dental instrumentation techniques, measuring canal transportation, and assessing remaining dentinal thickness during endodontic therapy. The specimen is shown in a sagittal/coronal view, providing a clear vertical reference for the internal anatomy of the root system.
CT Scan (Computed Tomography)
What Is a CT Scan?
How It Works
- The Gantry: The patient lies on a motorized table that slides into a ring-shaped machine called the gantry. The X-ray tube rotates 360° around the patient inside this ring.
- Image Acquisition: As the tube rotates, detectors on the opposite side capture X-ray attenuation data from multiple angles. The table advances slightly after each rotation, producing successive cross-sectional images ("slices").
- Slice Thickness: Each slice is typically 1-10 mm thick, determined by the operator and the radiologist's requirements.
- Computer Reconstruction: The attenuation data is fed to a computer, which uses mathematical algorithms (back-projection) to reconstruct a 2D image per rotation. Multiple slices are stacked for 3D views.
- Hounsfield Units (HU): Tissue density is expressed in Hounsfield Units. Air = -1000 HU, water = 0 HU, soft tissue = 20-80 HU, bone = +400 to +1000 HU.
Types of CT Scans
| Type | Description |
|---|---|
| Non-contrast CT | No dye - best for bones, brain bleeds, calcifications |
| CT with IV contrast | Iodinated contrast injected to highlight blood vessels and enhance soft tissues |
| CT with oral contrast | Barium or iodine swallowed to outline the GI tract |
| CT Angiography (CTA) | Specialized contrast CT to image blood vessels |
| PET-CT | CT combined with positron emission tomography for metabolic + structural imaging |
| CT Fluoroscopy | Real-time CT for image-guided procedures |
| Multislice/Helical CT | Spiral acquisition for faster scanning; standard in modern CT |
| High-Resolution CT (HRCT) | Very thin slices (1-1.5 mm) for detailed lung or temporal bone imaging |
Common Clinical Indications
Neurological
- Acute stroke (hemorrhagic vs ischemic differentiation)
- Head trauma, intracranial bleeds (subdural, epidural, subarachnoid hemorrhage)
- Brain tumors
- Hydrocephalus
Chest
- Pulmonary embolism (CT pulmonary angiography - CTPA)
- Lung cancer staging
- Pneumonia, pleural effusion
- Aortic dissection, thoracic aneurysm
- CT is the gold standard for assessing spinal trauma (per Bailey & Love, 28th Ed.)
Abdomen & Pelvis
- Appendicitis, bowel obstruction
- Liver, pancreatic, renal masses
- Abdominal aortic aneurysm
- Renal stones (non-contrast CT is the best modality)
- Intraabdominal bleeding in polytrauma
Oncology
- Tumor detection, staging, and follow-up
- Monitoring treatment response
- Cancer screening (e.g., low-dose CT for lung cancer in smokers)
Musculoskeletal
- Complex fractures (pelvis, spine, wrist)
- Joint pathology
- Bone tumors
Vascular
- CT Angiography for coronary artery disease, peripheral vascular disease
- Coronary Artery Calcium (CAC) scoring for cardiovascular risk
Contrast Agents in CT
- Iodinated IV contrast: Enhances vascular structures and helps differentiate benign vs malignant lesions. Risk of contrast-induced nephropathy (especially in renal impairment) and allergic reactions.
- Premedication: Antihistamines and steroids used for patients with prior contrast reactions.
- Oral contrast: Barium sulfate or water-soluble iodine for GI tract opacification.
- Contraindications: Severe renal impairment (eGFR <30), prior severe contrast reaction, metformin use (hold 48 hours after contrast).
CT Windows
| Window | Level (HU) | Width (HU) | Best For |
|---|---|---|---|
| Brain | 35 | 80 | Brain parenchyma |
| Bone | 400 | 1500-2000 | Cortical/trabecular bone |
| Lung | -600 | 1500 | Pulmonary parenchyma |
| Abdomen/Soft Tissue | 60 | 400 | Organs |
| Mediastinum | 40 | 400 | Mediastinal structures |
Advantages
- Fast (whole body in seconds with modern scanners)
- Widely available
- Excellent bony detail
- Useful in emergencies and unstable patients
- Can guide interventional procedures
- 3D reconstruction capability
Limitations & Risks
- Radiation exposure: CT delivers significantly more radiation than plain X-rays (e.g., chest CT = ~7 mSv vs. chest X-ray = ~0.02 mSv). Risk must be weighed, especially in children and repeated scans.
- Contrast risks: Nephrotoxicity, allergic reactions (anaphylaxis rare but possible)
- Limited soft-tissue contrast compared to MRI (e.g., brain, spinal cord, ligaments, cartilage)
- Metallic artifact: Metal implants can degrade image quality
- Cost: More expensive than plain radiographs
- Not safe in pregnancy: Radiation risk to fetus (use MRI or ultrasound when possible)
CT vs Other Imaging Modalities
| Feature | CT | MRI | Ultrasound | X-Ray |
|---|---|---|---|---|
| Bone detail | Excellent | Good | Poor | Good |
| Soft tissue | Good | Excellent | Moderate | Poor |
| Speed | Fast | Slow | Fast | Very fast |
| Radiation | Yes (moderate) | No | No | Yes (low) |
| Cost | Moderate | High | Low | Low |
| Emergency use | Excellent | Limited | Good | Good |
CT in Special Settings
- Trauma (polytrauma): CT of chest, abdomen, and pelvis is performed routinely. Head CT automatically includes cervical spine screening per Bailey & Love's Surgery.
- Oncology: PET-CT is preferred for metabolic activity + anatomical staging.
- Pediatrics: Low-dose protocols (ALARA principle - As Low As Reasonably Achievable) are used to minimize radiation.
- Cardiac CT: Used for coronary artery calcium scoring and CT angiography for coronary artery disease.
CT Scan Procedure - Step by Step
- Patient preparation: remove metallic objects, IV cannula placed if contrast needed
- Patient lies supine on the table (sometimes prone or lateral depending on body part)
- Patient instructed to hold breath at key moments to reduce motion artifact
- Table advances through the gantry while X-ray tube rotates
- Scan completed in seconds to minutes
- Images sent to a radiologist for reporting
- If contrast used, patient monitored for 30 minutes post-scan