
Explain all of this very clearly like crazy clearly
cd "/tmp/workspace/attachments/17c08a06-83b8-43a4-9f27-a96d1690fc57/" && python3 -c " import pdfplumber with pdfplumber.open('PBL 1.pdf') as pdf: print(f'Total pages: {len(pdf.pages)}') for i, page in enumerate(pdf.pages): text = page.extract_text() print(f'--- PAGE {i+1} ---') print(text) print() "
Klebsiella pneumoniae pneumonia right upper lobe consolidation bulging fissure CXR
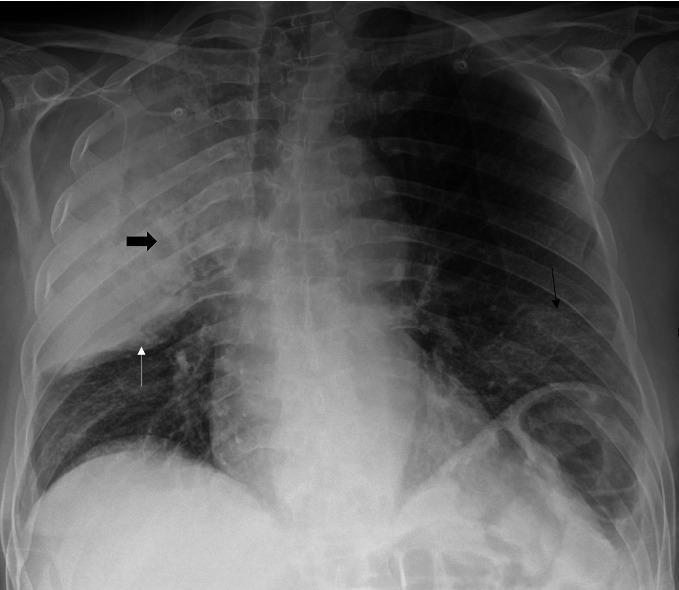
This chest X-ray in anteroposterior (AP) projection demonstrates multi-focal pulmonary pathology. The primary finding is a dense consolidation of the right upper lobe (RUL), characterized by a notable 'bulging fissure' sign where the horizontal fissure (marked by a thin white arrow) is displaced inferiorly, suggesting an expansive inflammatory process such as Klebsiella or Legionella pneumonia. Within the RUL consolidation, a thick black arrow points to an area of radiolucency representing pulmonary cavitation. Additionally, the image shows bilateral lower zone ground-glass opacities (indicated by a thin black arrow in the left lung base), manifesting as hazy increased density that does not fully obscure pulmonary vasculature. This combination of dense, cavitating lobar consolidation and diffuse ground-glass opacities is clinically significant for severe community-acquired or atypical pneumonia, potentially occurring in the context of co-infections such as SARS-CoV-2 and Legionella pneumophila. Educational value lies in identifying the bulging fissure sign, recognizing cavitary lesions on plain film, and distinguishing lobar consolidation from diffuse ground-glass patterns.
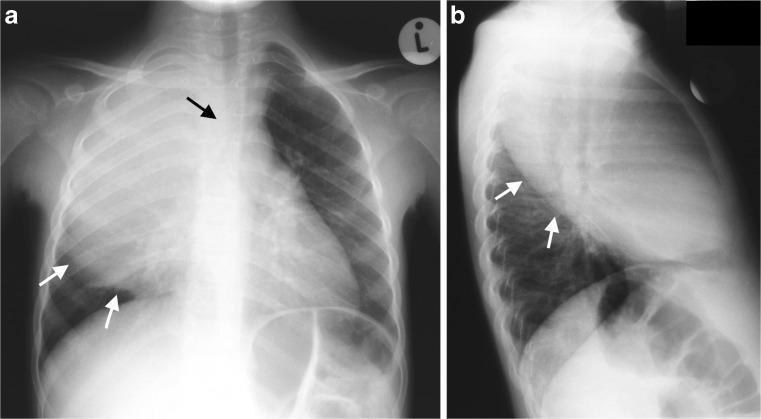
This diagnostic imaging set consists of two chest radiographs of a 3-year-old pediatric patient: (a) an anteroposterior (AP) view and (b) a lateral view. The images demonstrate a dense, homogeneous opacity localized to the right upper lobe, consistent with severe consolidation. Key diagnostic features include a prominently bulging inferior margin (indicated by white arrows) of the minor fissure, suggesting an expansile process where the affected lobe has increased in volume. The AP view (a) further reveals a significant mass effect, with a black arrow highlighting the displacement and deviation of mediastinal structures, including the trachea, toward the left side. These findings are classic radiological signs of expansile pneumonia, frequently associated with Klebsiella pneumoniae infection. While the radiographs clearly show the dense consolidation and resulting volume expansion, they are limited in their ability to differentiate between simple congestion and more complex parenchymal changes such as necrosis or suppuration.
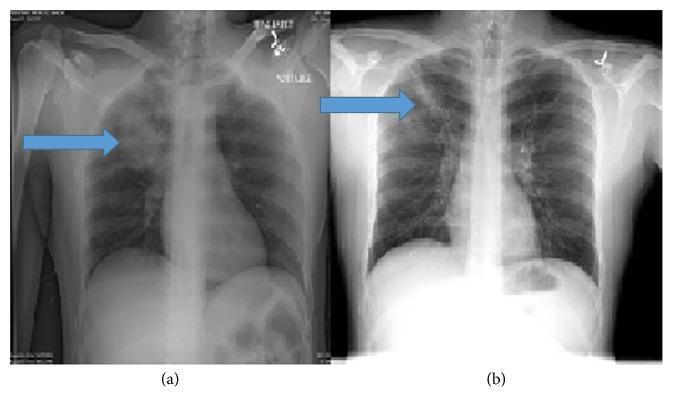
This diagnostic image is a side-by-side comparison of two posterior-anterior (PA) chest X-rays (CXR) illustrating the progression and resolution of lobar pneumonia. Image (a), labeled as the admission radiograph, demonstrates a dense, homogeneous area of increased radiopacity in the right upper lobe, consistent with acute consolidation. This finding obscures local vascular markings and is sharply demarcated inferiorly by the minor fissure. Blue arrows indicate the primary pathology. Image (b) shows the same patient at a 2-month follow-up. There is a significant reduction in the consolidation density, which has been replaced by linear opacities and reticular markings suggestive of residual pulmonary scarring and fibrosis. The lung parenchyma in (b) shows improved lucency compared to (a), indicating clinical improvement. This comparison is educational for identifying radiographic features of airspace disease, the characteristic distribution of right upper lobe consolidation, and the subsequent stages of radiographic resolution in bacterial or atypical (e.g., Mycoplasma pneumoniae) pneumonia.
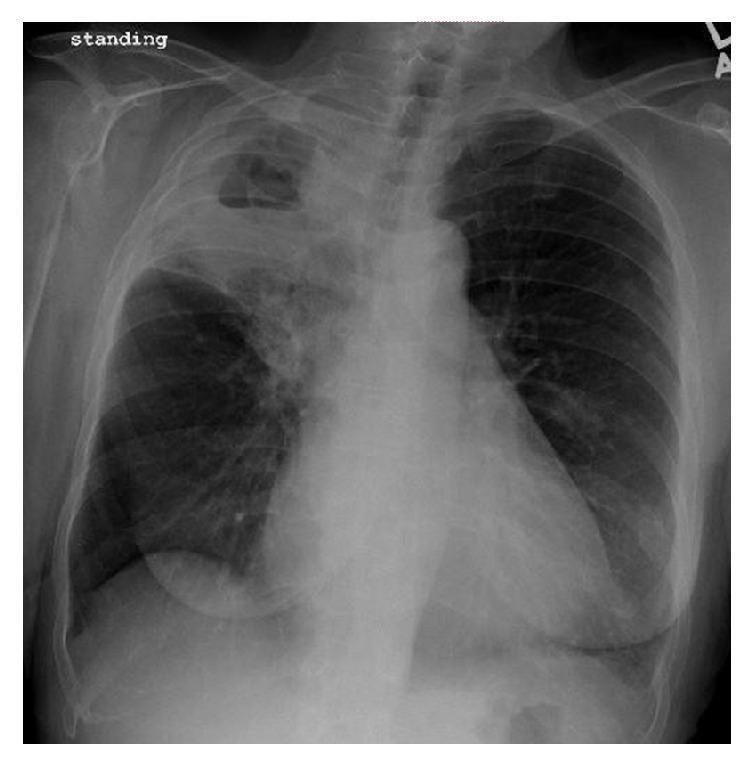
A posterior-anterior (PA) chest X-ray in a standing position demonstrating a significant pathological process localized to the right upper lobe. The primary finding is a dense, consolidated opacity involving the right upper lobe, clearly demarcated by the minor fissure. Within this consolidated region, there is a large, well-defined cavitary lesion containing a distinct horizontal air-fluid level, characteristic of necrotizing pneumonia or a lung abscess. The surrounding lung parenchyma in the right middle and lower lobes appears relatively aerated, though there is a subtle increase in interstitial markings. The left lung field remains clear with normal vascularity and no evidence of consolidation, effusion, or cavitation. The cardiac silhouette, mediastinal contours, and costophrenic angles appear within normal limits. This radiographic presentation is highly suggestive of cavitating pneumonia, potentially caused by virulent pathogens such as Pseudomonas aeruginosa, Klebsiella pneumoniae, or Staphylococcus aureus. The image serves as a clinical example of lung parenchyma destruction and abscess formation in the context of severe pulmonary infection.
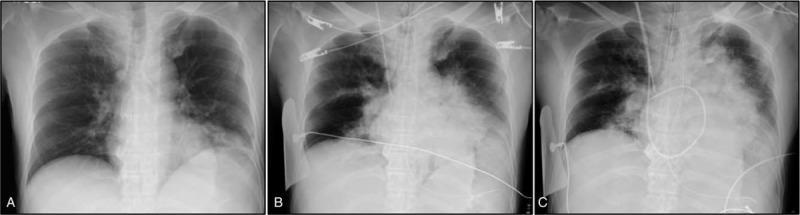
This series of three anterior-posterior (AP) chest X-rays (A, B, and C) illustrates a rapid progression of pulmonary consolidation over a 11-hour period. Image A shows an initial focal consolidation in the left lower lobe. Image B, taken 9 hours post-admission, demonstrates a marked increase in the density and volume of the left-sided infiltrate, characterized by the classic 'bulging fissure sign' where the consolidation expands to displace the interlobar fissure. Additionally, new patchy infiltrates are visible in the right lung. Image C, taken at 11 hours, shows near-complete opacification of the left hemithorax and worsening multifocal consolidation in the right lung. External medical hardware, including ECG leads and an endotracheal tube, are visible in the later images, reflecting clinical deterioration. This radiographic progression is highly suggestive of a fulminant necrotizing pneumonia, such as that caused by hypervirulent Klebsiella pneumoniae. The educational focus is on identifying rapid alveolar filling patterns and the radiographic signs of invasive pulmonary infections.
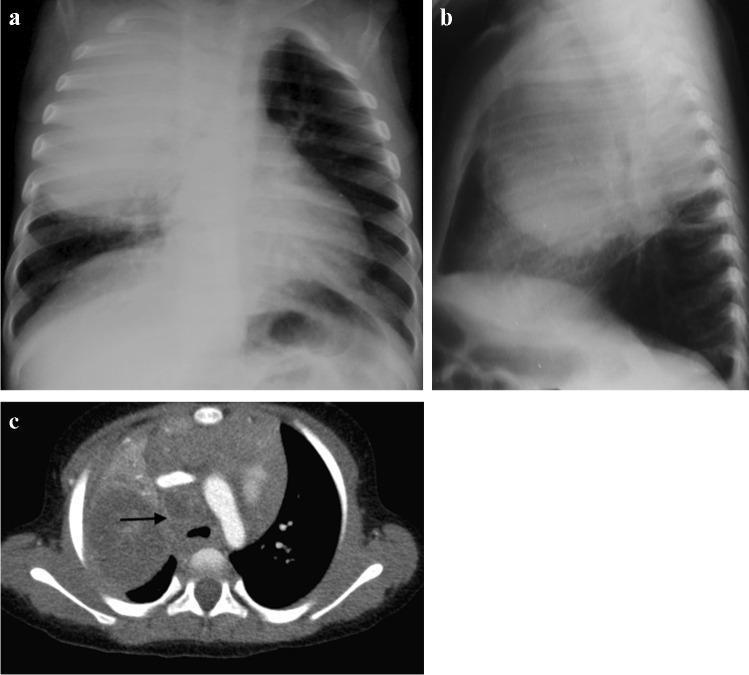
This composite figure displays multi-modality chest imaging of a 2-year-old pediatric patient with primary pulmonary tuberculosis. (a) Posteroanterior chest radiograph (CXR) demonstrates significant opacification in the right upper lobe consistent with lobar pneumonia. Notable secondary findings include leftward tracheal deviation and narrowing of the bronchus intermedius, suggesting compressive paratracheal lymphadenopathy. (b) Lateral CXR confirms the right upper lobe involvement, showing an inferiorly bulging horizontal fissure and soft tissue density in the subcarinal region representing hilar/mediastinal lymphadenopathy. (c) Axial post-contrast CT (mediastinal window) reveals high-volume, low-density mediastinal lymphadenopathy with characteristic peripheral rim enhancement (arrow), indicating caseous necrosis within the nodes. The right upper lobe appears expanded with predominantly low attenuation, further suggestive of caseous pneumonia. A small, associated right-sided pleural effusion is also visualized. The imaging collectively illustrates the classic triad of pediatric primary tuberculosis: parenchymal consolidation, significant lymphadenopathy, and evidence of necrotic tissue (caseation).
COPD chest x-ray hyperinflation flat diaphragm enlarged pulmonary arteries
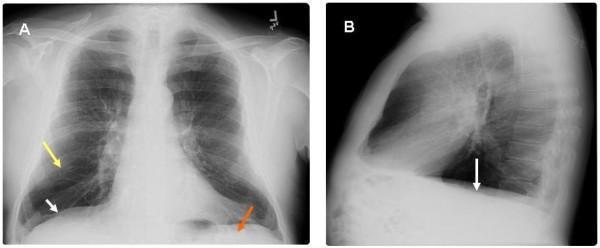
This diagnostic image displays a two-panel chest roentgenogram (X-ray) from a 65-year-old male, highlighting radiographic features of severe pulmonary emphysema and chronic obstructive pulmonary disease (COPD). Panel A presents a postero-anterior (PA) view, while Panel B provides a lateral view. Key findings include significant hyperinflation of the lung fields with marked flattening of the hemidiaphragms (indicated by white arrows), which loss their normal convex shape. In Panel A, a yellow arrow identifies areas of increased translucency and attenuation of vascular markings consistent with emphysematous parenchymal changes. A red arrow highlights the decreased zone of apposition, representing the diminished area where the diaphragm sits parallel to the inner rib cage. Panel B further illustrates the flattened diaphragmatic contour and an increased retrosternal clear space, reflecting an increased anterior-posterior thoracic diameter (barrel chest). These visual markers are clinically significant as they correlate with the mechanical basis of Hoover's sign, where the horizontal orientation of the diaphragm causes inward rib cage retraction during inspiration.
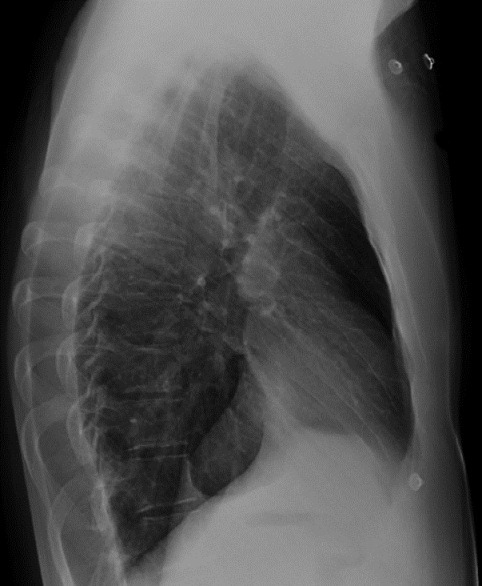
**Imaging Modality:** Lateral Chest Radiograph (X-ray). **Anatomical Region:** Thoracic cavity, including the mediastinum, lungs, and diaphragm. **Observed Pathology and Visual Features:** The image demonstrates signs of pulmonary hyperinflation. Key radiologic features include: * **Anterior Clear Space:** There is a notable increase in the retrosternal clear space (the lucent area between the posterior aspect of the sternum and the anterior wall of the ascending aorta), suggesting an increase in lung volume. * **Thoracic Configuration:** The anteroposterior (AP) diameter of the chest is increased, contributing to a "barrel chest" appearance. * **Diaphragmatic Appearance:** The hemidiaphragms appear flattened rather than normally domed. * **Lung Parenchyma:** Increased radiolucency is observed throughout the lung fields, consistent with air trapping. **Clinical Context:** These findings are classic radiographic markers for Chronic Obstructive Pulmonary Disease (COPD), specifically emphysema. **Key Diagnostic Features:** The combination of an enlarged retrosternal clear space (typically $>2.5$ cm), flattened diaphragms, and an increased AP diameter on a lateral projection are the primary diagnostic cues for identifying chronic lung hyperinflation.
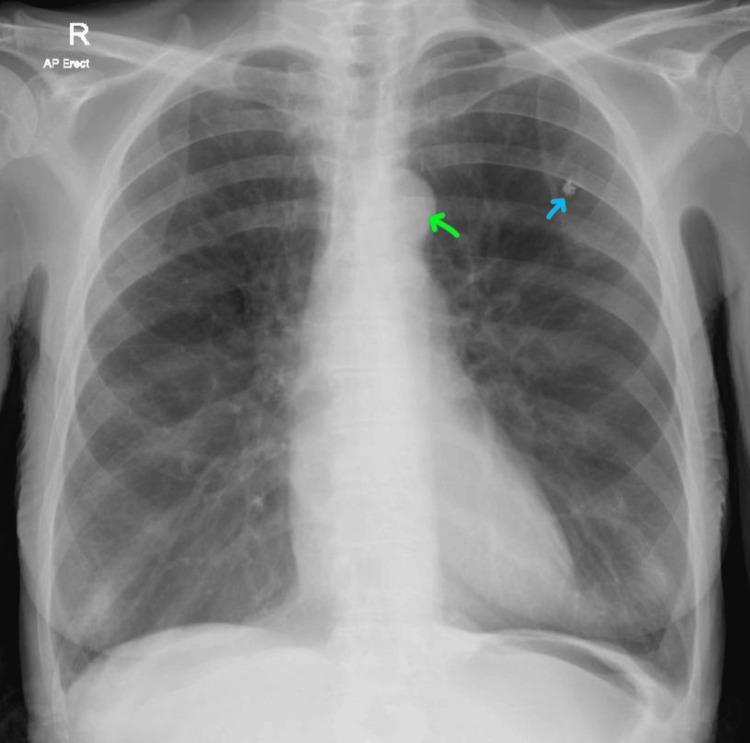
This diagnostic image is an anteroposterior (AP) erect chest X-ray demonstrating several key clinical findings. The lungs show signs of hyperinflation, characterized by increased radiolucency and a flattened appearance of the bilateral diaphragmatic domes, consistent with chronic obstructive pulmonary disease (COPD). Two specific findings are highlighted with color-coded arrows: a blue arrow points to a small, well-defined calcified granuloma located in the left upper lung zone, and a green arrow indicates an enlarged aortic knob, often associated with chronic hypertension. The cardiac silhouette appears within normal size limits, though the overall lung volume is increased. This image serves as an educational example for identifying radiographic signs of obstructive lung disease alongside common incidental thoracic findings like granulomas and vascular changes.
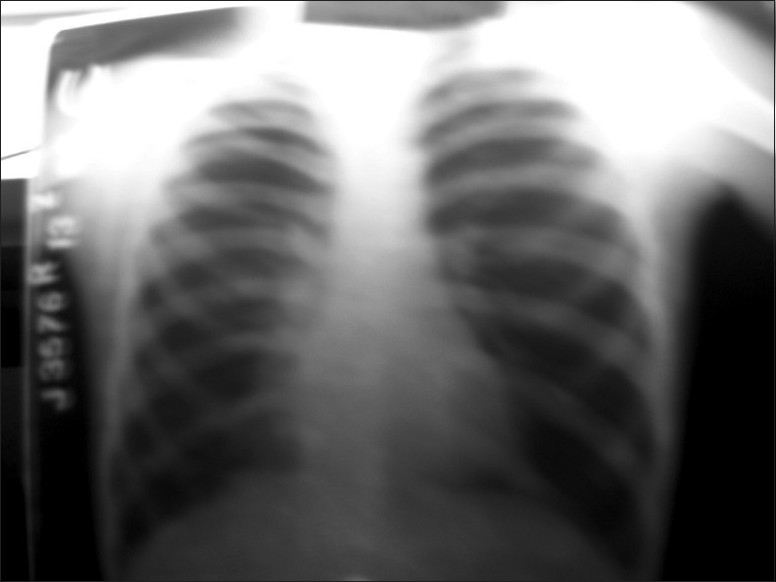
**Imaging Modality:** Posterior-Anterior (PA) Chest X-ray. **Anatomical Region:** Thoracic cavity, including the lungs, mediastinum, and diaphragm. **Observed Pathology:** Signs consistent with pulmonary emphysema and chronic obstructive pulmonary disease (COPD). **Characteristic Visual Features:** - **Hyperinflation:** Bilateral lung fields demonstrate increased radiolucency (hyperlucency) and increased lung volume. - **Diaphragmatic Changes:** Notable flattening of the hemidiaphragms, indicating significant air trapping. - **Rib Configuration:** Increased intercostal spacing and more horizontal orientation of the ribs. - **Mediastinal Appearance:** The heart appears relatively narrow or "tubular" (vertical heart) due to the downward pressure from hyperinflated lungs. - **Vascularity:** Attenuation or pruning of peripheral pulmonary vascular markings, particularly in the upper zones. **Key Diagnostic Features:** The combination of a flattened diaphragm, increased retrosternal space (implied by hyperlucency), and hyperinflated lung parenchyma are hallmark radiographic indicators of emphysematous changes. **Technical Note:** The image shows significant motion blur and overexposure in the superior regions, which may limit the evaluation of apical lung parenchyma.
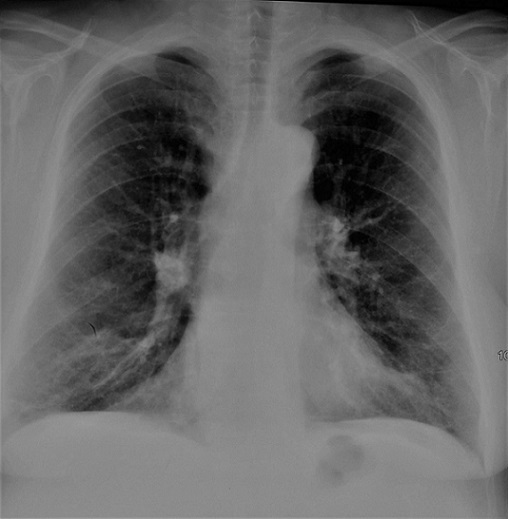
**Imaging Modality:** Posteroanterior (PA) chest X-ray. **Anatomical Region:** Thoracic cage, including lungs, mediastinum, and diaphragm. **Observed Pathology and Visual Features:** The radiograph demonstrates significant signs of pulmonary hyperinflation (thoracic distension). Key findings include: * **Diaphragmatic Flattening:** Bilateral depression and flattening of the hemidiaphragms, indicating increased lung volume. * **Increased Lucency:** Diffuse increase in lung radiolucency, consistent with air trapping. * **Bronchial Changes:** Visible peribronchial cuffing and thickening of the bronchial walls, particularly evident in the perihilar regions. * **Rib Configuration:** Horizontalization of the ribs and widening of the intercostal spaces. * **Mediastinal Profile:** A narrow, "vertical" heart configuration (drop heart) often associated with chronic obstructive pulmonary disease (COPD). **Clinical Context:** The combination of hyperinflation and bronchial wall thickening is highly characteristic of chronic obstructive airway disease, such as COPD or chronic bronchitis. **Key Diagnostic Features:** The presence of flattened diaphragms and peribronchial thickening serve as the primary visual cues for distinguishing obstructive lung pathology from restrictive patterns or acute consolidations. No acute pleural effusions or focal masses are identified.
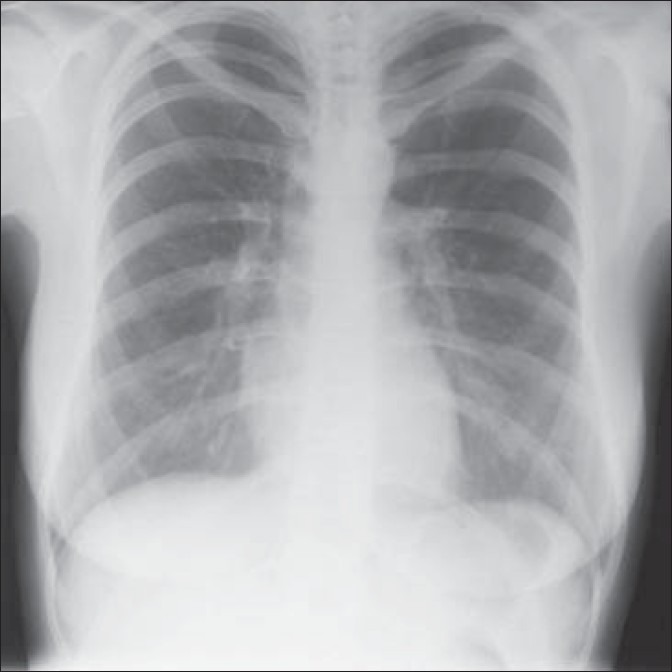
**Imaging Modality:** Posteroanterior (PA) or Anteroposterior (AP) Chest X-ray. **Anatomical Region:** Thoracic cavity, including the lungs, mediastinum, heart, and diaphragm. **Observed Pathology:** The radiograph demonstrates a significant degree of hyperlucency in both lung fields, consistent with pulmonary hyperinflation. There is a notable flattening of the bilateral hemidiaphragms, which is a classic indicator of chronic obstructive pulmonary disease (COPD) or emphysema. **Characteristic Visual Features:** - **Lung Fields:** Increased radiolucency and expansion of the thoracic volume. - **Diaphragm:** Flattening of the diaphragmatic contour and widening of the costophrenic angles. - **Heart:** The cardiac silhouette appears relatively narrow or "tubular," often seen in the context of hyperinflated lungs. - **Ribs:** Increased horizontal orientation of the ribs and widening of the intercostal spaces. **Diagnostic Differentiating Features:** The combination of bilateral lung hyperlucency, flattened diaphragms, and a narrow mediastinal silhouette supports a diagnosis of obstructive airway disease rather than acute consolidation or pleural effusion. No focal masses, pneumothorax, or acute airspace opacities are visualized.
PBL 1 - Full Crystal-Clear Explanation
TRIGGER 5 - QUESTION 1
The Case
A 48-year-old man with chronic alcohol use presents with fever, productive cough with reddish-brown sputum. CXR shows right upper lobe consolidation with bulging fissure sign.
- He drinks heavily and chronically
- He has a lung infection (pneumonia) - we know because of fever + productive cough
- The sputum is reddish-brown - this is a classic clue ("currant jelly sputum")
- The chest X-ray shows the infection is in the right upper lobe, and there's a "bulging fissure sign"
Statement 1: "Klebsiella pneumoniae is a likely causative organism" - TRUE
| Clue | Why it points to Klebsiella |
|---|---|
| Chronic alcohol use | Alcohol devastates your immune system and airway defenses |
| Right upper lobe involvement | Klebsiella classically causes upper lobe pneumonia (unlike most bugs that cause lower lobe) |
| Bulging fissure sign | Klebsiella causes such heavy inflammatory exudate that the lobe swells and bulges - this sign is almost pathognomonic |
| Reddish-brown "currant jelly" sputum | This is classically described for Klebsiella - it's a mix of blood and mucus from tissue destruction |
Statement 2: "High-flow oxygen at 15L/min should be immediately given to maintain SpO₂ above 98%" - FALSE
- A 48-year-old chronic alcoholic with recurrent chest infections likely has underlying lung disease or COPD-like changes
- More importantly, even without COPD, there is no evidence this patient is hypoxic - we don't know his SpO₂ yet
- Giving 15L/min oxygen via non-rebreather mask to maintain SpO₂ above 98% is excessive and potentially harmful
- Assess SpO₂ first
- If oxygen is needed, titrate it to a target of 94-98% in most patients (not 98-100%)
- Only give high-flow oxygen if there is evidence of hypoxia or shock
- Blindly giving max-flow O₂ without indication is not appropriate management
Question 2 (Trigger 5): How does alcohol predispose to pneumonia? Outline management.
How Alcohol Causes Pneumonia - The 4 Mechanisms
- Alcohol is a CNS depressant - it suppresses brainstem reflexes
- The gag reflex and cough reflex normally protect the airway
- When these are dulled, the patient is more likely to aspirate - meaning bacteria from the mouth/throat get sucked down into the lungs
- This is especially bad at night or when intoxicated
- Your airways are lined with tiny hair-like structures called cilia that constantly beat to sweep bacteria and debris up and out of the lungs (like an escalator going upward)
- Alcohol damages and paralyzes these cilia
- Without cilia working properly, bacteria that enter the lungs aren't cleared - they stay and multiply
- Neutrophils are the primary white blood cells that arrive first to kill bacteria in the lungs
- Alcohol directly impairs neutrophil function - they can't migrate properly, can't phagocytose (eat) bacteria as effectively, and produce fewer killing chemicals
- Chronic alcohol use also causes malnutrition and liver damage, which further weakens immunity (the liver makes many immune proteins; if it's damaged, immune function suffers)
- Because bacteria aren't being cleared (impaired cilia) and aren't being killed (impaired neutrophils), they multiply freely
- This leads to lung inflammation → consolidation → pneumonia
Management of This Patient
- Airway - is it patent?
- Breathing - respiratory rate, SpO₂, effort
- Circulation - pulse, blood pressure, signs of sepsis
- Continuous monitoring of vital signs
| CURB-65 Criteria | Points |
|---|---|
| Confusion (new) | 1 |
| Urea >7 mmol/L | 1 |
| Respiratory rate ≥30/min | 1 |
| Blood pressure <90/60 mmHg | 1 |
| Age 65 or older | 1 |
- Score 0-1: Low risk → treat at home
- Score 2: Intermediate → consider hospital
- Score 3-5: High risk → hospital admission, consider ICU
- CXR (already done - confirms right upper lobe consolidation)
- FBC (full blood count) - looking for raised white cell count confirming infection; CRP (inflammatory marker)
- Blood cultures - BEFORE giving antibiotics - to identify the bug and its sensitivities
- Sputum culture - again, before antibiotics if possible
- ABG (arterial blood gas) - only if severe, to assess oxygenation and ventilation
- Oxygen - only if hypoxic (SpO₂ <94%), titrated to 94-98% target
- IV fluids - if the patient is septic (high fever, low BP, high heart rate) or dehydrated
- IV antibiotics - empirical treatment covering community-acquired pneumonia including atypicals; in this case suspecting Klebsiella, cover appropriately (e.g. co-amoxiclav or ceftriaxone)
- Monitor response - repeat observations, repeat CXR if worsening
TRIGGER 6 - QUESTION 1
The Case
A 72-year-old smoker with known COPD presents with worsening breathlessness, increased cough and green sputum. He is drowsy with asterixis.ABG: pH 7.30 | PaCO₂ 9.0 kPa | HCO₃⁻ 37 mmol/LCXR: Hyperinflated lungs
- He has COPD (chronic airways disease from smoking)
- He's getting worse - more breathless, coughing up green sputum (bacterial infection)
- He's drowsy and has asterixis (asterixis = a flapping tremor of the hands when the wrists are extended - a sign of CO₂ retention / type II respiratory failure)
- The blood gas tells us everything (see below)
| Value | This Patient | Normal | Meaning |
|---|---|---|---|
| pH 7.30 | Low (acidic) | 7.35-7.45 | The blood is too acidic |
| PaCO₂ 9.0 kPa | Very high | 4.7-6.0 kPa | Too much CO₂ being retained |
| HCO₃⁻ 37 mmol/L | High | 22-26 mmol/L | Kidneys have compensated |
- pH is low = acidosis
- PaCO₂ is high = the problem is with ventilation (respiratory cause) → this is respiratory acidosis
- HCO₃⁻ is very high at 37 = the kidneys have been compensating by retaining bicarbonate to buffer the acid. This tells us this has been going on chronically (kidneys take days to compensate, not hours)
- Conclusion: Chronic Type II respiratory failure with acute-on-chronic decompensation
Statement 1: "This patient has Type II respiratory failure" - TRUE
| Type | What's abnormal | PaO₂ | PaCO₂ | Cause examples |
|---|---|---|---|---|
| Type I | Low oxygen only | Low (↓) | Normal or low | Pneumonia, pulmonary oedema, PE |
| Type II | Low oxygen AND high CO₂ | Low (↓) | High (↑) | COPD, obesity hypoventilation, neuromuscular weakness |
- PaCO₂ is 9.0 kPa (very high - should be <6.0 kPa)
- The lungs are failing to ventilate adequately - air isn't being moved in and out enough to blow off CO₂
- In COPD, the airways are obstructed and the lung parenchyma is destroyed - the respiratory muscles work hard but can't compensate, so CO₂ builds up
Statement 2: "A 15L non-rebreather mask should be given immediately to correct O₂ sat to 99%" - FALSE
- In healthy people, the main signal to breathe is a high CO₂ level (detected by central chemoreceptors in the brainstem)
- In patients with chronic CO₂ retention (like this COPD patient), the brain has adapted to high CO₂ levels - it no longer responds to them as strongly
- Instead, these patients partly rely on low O₂ as the signal to breathe (peripheral chemoreceptors in the carotid body detect low PaO₂)
- You abolish the hypoxic drive - the patient's respiratory rate drops
- They breathe less - retaining even MORE CO₂
- pH drops further → CO₂ narcosis worsens → drowsiness → respiratory arrest
- Give controlled oxygen via a Venturi mask (which delivers a precise, fixed percentage of O₂)
- Target SpO₂ of 88-92% in COPD patients (NOT 94-98% like normal patients, and certainly NOT 99%)
- A common starting choice: 28% Venturi mask (delivers ~28% O₂ regardless of flow rate)
- Recheck ABG after 30-60 minutes to ensure CO₂ isn't climbing further
Trigger 6 - Question 2: Explain the CXR changes and describe acute management
CXR Changes Explained
- In COPD (especially emphysema), the lung tissue loses its elastic recoil - normally, lungs are like stretched elastic bands wanting to spring back
- When elastic recoil is lost, the airways collapse on expiration and air gets trapped inside
- This trapped air increases the residual volume (the amount of air left in the lungs after breathing out)
- On CXR: the lung fields look darker (more radiolucent) than normal, and the overall lung volume appears increased
- Normally the diaphragm has a nice dome shape, sitting high up
- When the lungs are chronically over-inflated, they push down on the diaphragm, flattening it
- On CXR: instead of a curved dome, the diaphragm looks flat or even concave
- This also makes the diaphragm mechanically inefficient - it can't contract powerfully when it's already flattened, contributing to breathlessness
- Chronic low oxygen (hypoxia) causes the small blood vessels in the lungs to constrict (hypoxic pulmonary vasoconstriction)
- This is a reflex trying to redirect blood away from poorly ventilated areas
- But when this happens throughout the lungs chronically, it raises the pressure in the entire pulmonary circulation = pulmonary hypertension
- The right side of the heart has to pump against this high pressure, so the right ventricle hypertrophies - this is called cor pulmonale
- On CXR: the main pulmonary arteries in the hilar regions appear enlarged/prominent
Acute Management - Step by Step
- Use a Venturi mask (colour-coded for specific O₂ concentrations)
- Target SpO₂ 88-92% - not higher
- Start with a 28% or 35% Venturi mask
- Check ABG after 30-60 mins to ensure PaCO₂ is not rising
- Nebulised salbutamol (a beta-2 agonist): relaxes bronchial smooth muscle → opens up obstructed airways → improves airflow
- Nebulised ipratropium (an anticholinergic): blocks muscarinic receptors in the airways → further bronchodilation and reduces secretions
- Give both together (they work via different mechanisms = additive effect)
- Prednisolone orally (or IV hydrocortisone if very unwell)
- Reduces the airway inflammation that is causing mucus, oedema, and bronchoconstriction
- Guidelines recommend a 5-day course in acute COPD exacerbations
- Green/purulent sputum = bacterial infection is driving this exacerbation
- Treat with antibiotics (commonly amoxicillin, doxycycline, or co-amoxiclav depending on local guidelines)
- Reduces the infective trigger of the exacerbation
- Repeat after 30-60 minutes of treatment
- Looking for improvement in pH and PaCO₂
- If pH is persistently low (still acidotic) and PaCO₂ is still rising despite treatment → start BiPAP (non-invasive ventilation)
- Bilevel Positive Airway Pressure
- A tight-fitting mask that delivers two levels of pressure: higher pressure on inspiration (to help breathe in) and lower pressure on expiration
- This mechanically assists ventilation → helps blow off CO₂ → improves pH
- This is non-invasive ventilation (NIV) - no tube down the throat
- If the patient deteriorates despite BiPAP (worsening pH, increasing drowsiness, exhaustion)
- Consider ICU referral and intubation (invasive mechanical ventilation)
- This is a last resort - intubating a severe COPD patient is high risk and difficult to wean off
Summary Table - The Two Cases Side by Side
| Feature | Trigger 5 (Pneumonia) | Trigger 6 (COPD Exacerbation) |
|---|---|---|
| Patient | 48yr, chronic alcohol | 72yr, smoker, known COPD |
| Key organism | Klebsiella pneumoniae | Bacterial (purulent sputum) |
| CXR | Right upper lobe consolidation + bulging fissure | Hyperinflation + flat diaphragm |
| Sputum | Reddish-brown ("currant jelly") | Green/purulent |
| Key sign | Bulging fissure on CXR | Asterixis, drowsiness (CO₂ narcosis) |
| Failure type | Not stated (Type I likely if hypoxic) | Type II (high CO₂) |
| O₂ target | 94-98% | 88-92% (strict!) |
| O₂ delivery | Titrated nasal cannula/mask | Venturi mask (controlled %) |
| Key treatment | IV antibiotics, fluids | Bronchodilators + steroids + antibiotics + BiPAP if needed |
| Why NOT 15L O₂? | No indication; no hypoxia confirmed | Removes hypoxic drive → CO₂ retention worsens |
The Single Most Important Teaching Point From This Whole PBL
- In most patients, target SpO₂ is 94-98%
- In COPD / Type II respiratory failure, target SpO₂ is 88-92%
- Never give 15L O₂ blindly - always assess first, titrate to a specific target, and deliver it via the correct device
Diagnosis
What would you like me to explain about diagnosis?
Diagnosis for the cases
CURB-65 score pneumonia severity assessment
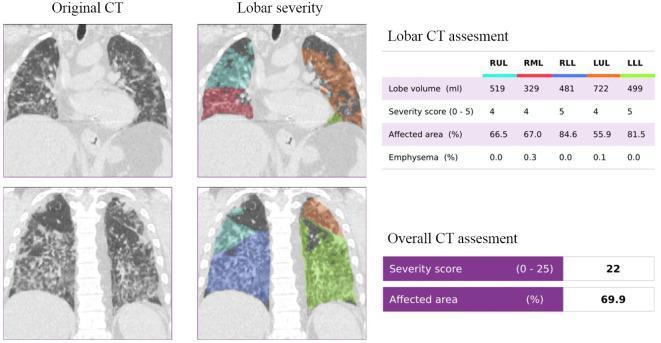
This diagnostic composite image presents a chest CT assessment of a 76-year-old male with COVID-19 pneumonia. It features two coronal CT slices shown in original and color-segmented 'Lobar severity' formats. The original CT scans demonstrate extensive bilateral lung involvement characterized by diffuse ground-glass opacities and multi-focal consolidations. The corresponding lobar severity segments use a deep learning (DL) approach to color-code each lobe (RUL, RML, RLL, LUL, LLL) for quantitative analysis. Accompanying tables provide a 'Lobar CT assessment' detailing specific volumes, severity scores (ranging 0-5), and the percentage of affected area per lobe, with high severity scores of 4 and 5 across all lobes. An 'Overall CT assessment' summarizes the systemic impact with a total severity score of 22 out of 25 and an aggregate affected area of 69.9%. This infographic illustrates the utility of automated DL segmentation in characterizing and quantifying the spatial distribution and severity of viral interstitial pneumonia in a clinical radiology setting.
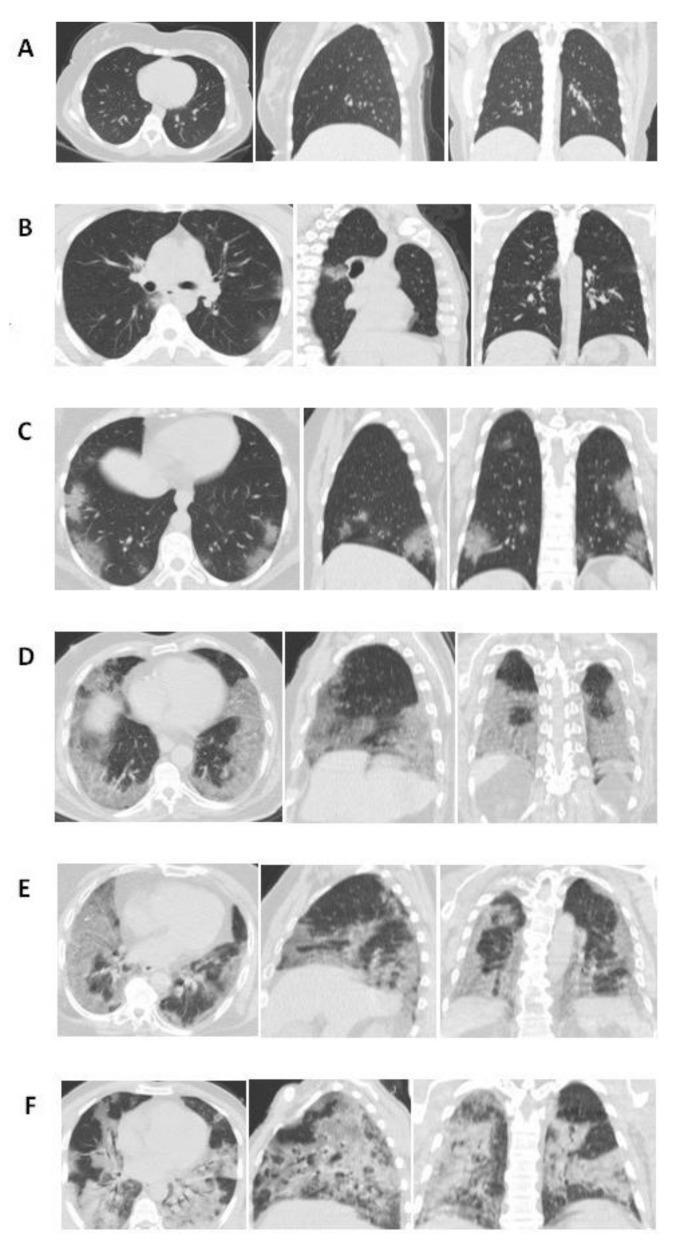
This chest CT compilation illustrates a semi-quantitative severity scoring system for lung involvement, typically applied in the context of viral pneumonia such as COVID-19. The image presents eighteen panels organized into six rows (A-F), showing axial, sagittal, and coronal planes for each severity score level (0 to 5). (A) Score 0: Normal lung parenchyma with no visible abnormalities. (B) Score 1: Less than 5% involvement, showing isolated, faint ground-glass opacities (GGOs). (C) Score 2: 5–25% involvement, with multi-focal GGOs appearing more distinct in peripheral zones. (D) Score 3: 26–49% involvement, demonstrating extensive GGOs and early consolidative patches distributed across middle and lower zones. (E) Score 4: 50–75% involvement, showing dense, confluent consolidations and GGOs involving the majority of the lung volume. (F) Score 5: Over 75% involvement, characterized by diffuse, high-density consolidation and parenchymal architectural distortion across all lobes. This progression visualizes the transition from focal ground-glass density to widespread consolidation, serving as a radiological reference for disease staging and severity assessment.
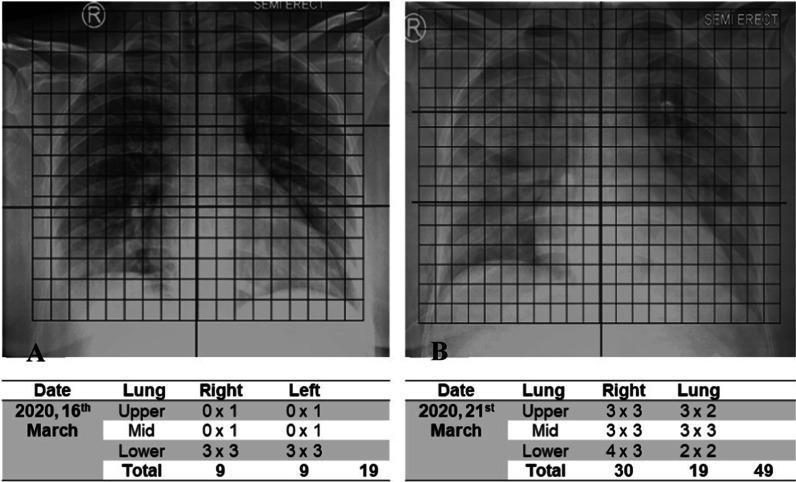
Comparison of serial chest radiographs demonstrating the progression of COVID-19 pneumonia over a five-day interval (March 16 to March 21, 2020). The images utilize a grid-based Radiologic Severity Index (RSI) assessment, dividing each lung into upper, middle, and lower zones. Image A (initial) shows bilateral basilar-predominant opacities, primarily in the lower zones, with an RSI score of 19. Image B (follow-up) reveals a significant increase in lung pathology, characterized by the development of diffuse ground-glass opacities and consolidation extending into the middle and upper zones bilaterally. This progression is quantified by a total RSI score increase to 49, with the right lung showing more severe involvement (30) than the left (19). The visual findings illustrate the rapid evolution of viral pneumonia, characterized by increased volumetric density and wider anatomical distribution of pulmonary lesions. This comparison serves as an educational tool for evaluating disease severity and progression in acute respiratory infections using standardized scoring systems.
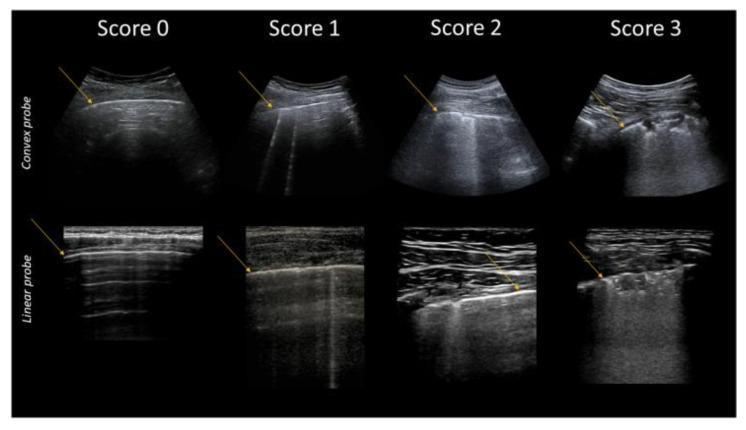
This diagnostic comparison chart illustrates the lung ultrasound (LUS) grading system for COVID-19 pathology using convex (top row) and linear (bottom row) probes. The images classify findings into four severity scores: Score 0 represents a normal lung with a smooth, continuous pleural line (indicated by arrows) and horizontal A-lines. Score 1 shows initial interstitial involvement, characterized by the appearance of isolated vertical B-lines originating from the pleural line. Score 2 demonstrates worsening interstitial syndrome, showing confluent B-lines or 'white lung' patterns, where multiple vertical artifacts coalesce. Score 3 indicates severe pathology, visible as pleural line fragmentation and subpleural consolidations—cuneiform hypoechoic areas often containing hyperechoic spots (air bronchograms). The linear probe images provide higher resolution of the pleural interface, while the convex probe images show a wider field of view for deeper artifact assessment. This visual guide is intended for clinical triage and monitoring of pulmonary involvement in viral pneumonia.
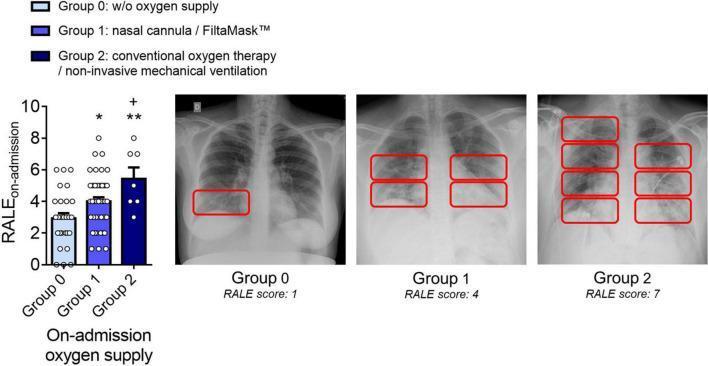
This medical visual combines a bar graph and diagnostic radiographic images to illustrate the correlation between COVID-19 severity and the Radiographic Assessment of Lung Edema (RALE) score. The bar graph on the left shows mean RALE scores at admission for three patient cohorts: Group 0 (mild, no oxygen), Group 1 (moderate, nasal cannula/FiltaMask™), and Group 2 (severe, conventional therapy/non-invasive ventilation). The RALE score increases progressively across these groups, supported by statistical significance markers. To the right, three representative posterior-anterior chest X-rays correspond to each group. Group 0 (RALE 1) shows minimal peripheral opacity in the right lower lobe. Group 1 (RALE 4) demonstrates bilateral mid-to-lower zone opacities. Group 2 (RALE 7) exhibits widespread, dense, bilateral pulmonary opacities involving all lung zones. Red bounding boxes on the X-rays highlight the consolidated or infiltrated areas used for RALE scoring. This content demonstrates the use of standardized radiographic scoring to quantify disease progression and the resulting clinical requirement for respiratory support in viral pneumonia cases.
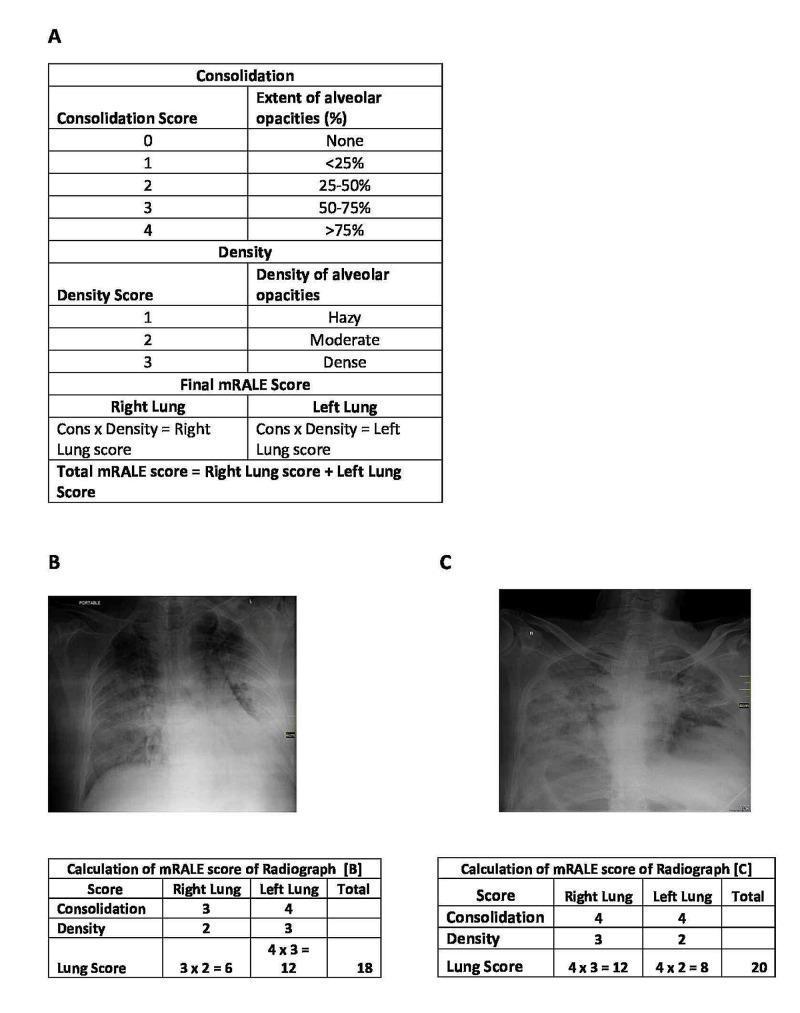
Educational infographic and diagnostic display of the modified Radiographic Assessment of Lung Edema (mRALE) scoring system used to quantify the severity of pulmonary involvement, often in cases of ARDS or severe viral pneumonia like SARS-CoV-2. Panel A contains reference tables defining two primary metrics: Consolidation Score, based on the percentage extent of alveolar opacities (0: none to 4: >75%), and Density Score (1: hazy, 2: moderate, 3: dense). It outlines the calculation formula where each lung's score is the product of consolidation and density, and the total mRALE score is the sum of both lungs. Panels B and C present clinical examples using anteroposterior (AP) chest radiographs. Panel B demonstrates bilateral opacities with a total mRALE score of 18 (Right Lung score: 3x2=6; Left Lung score: 4x3=12). Panel C shows more severe, confluent alveolar opacities with a total mRALE score of 20 (Right Lung score: 4x3=12; Left Lung score: 4x2=8). The visual serves as a standardized guide for radiological assessment and clinical research categorization.
Diagnosis for Both Cases
CASE 1 (Trigger 5) - Klebsiella Pneumonia
Final Diagnosis: Community-Acquired Pneumonia (CAP) caused by Klebsiella pneumoniae
How You Reach This Diagnosis - Clue by Clue
| Clinical Clue | What It Tells You |
|---|---|
| 48-year-old chronic alcoholic | Klebsiella loves immunocompromised hosts; alcohol wrecks immune defenses |
| Fever | Infection/inflammation - systemic response to bacteria |
| Productive cough | Lower respiratory tract infection; pus/exudate in the airways |
| Reddish-brown ("currant jelly") sputum | Classic Klebsiella sign - it causes tissue necrosis + haemorrhage mixing blood with mucus |
| Right upper lobe consolidation on CXR | Klebsiella characteristically infects the UPPER lobes (unlike most bugs that cause lower lobe pneumonia) |
| Bulging fissure sign on CXR | Almost pathognomonic for Klebsiella - the lobe swells so much from inflammatory exudate that it pushes the fissure outward |
What Each Diagnostic Test Confirms
- Symptoms of lower respiratory tract infection = fever, cough, purulent sputum, pleuritic chest pain
- Risk factor = chronic alcohol use
- Consolidation = a white (opaque) area replacing normal black airy lung - this means alveoli are filled with pus/fluid instead of air
- Right upper lobe location = narrows organism to Klebsiella or TB (not typical lobar pneumonia which hits lower lobes)
- Bulging fissure = the lobe is expanding due to the weight of the inflammatory exudate - classic Klebsiella
- Raised white cell count (WCC) - specifically neutrophilia (high neutrophils = bacterial infection)
- Raised CRP - confirms systemic inflammation/infection
- Gram stain: Klebsiella is a Gram-negative rod
- Culture will grow Klebsiella pneumoniae and give antibiotic sensitivities
- Must be taken BEFORE antibiotics
- If positive = bacteraemia (bacteria in the blood) = more severe disease
- Checks if the patient is developing Type I respiratory failure (hypoxia without CO₂ retention) - which can happen in severe pneumonia when enough alveoli fill with pus that gas exchange fails
Severity Scoring - CURB-65
| Criterion | Does This Patient Have It? |
|---|---|
| Confusion (new) | Not mentioned - assume No = 0 |
| Urea >7 mmol/L | Not tested yet - need bloods |
| Respiratory rate ≥30 | Not mentioned |
| Blood pressure <90/60 | Not mentioned |
| Age ≥65 | No (48 years old) = 0 |
- Score 0-1 → treat at home
- Score 2 → consider hospital
- Score 3+ → hospital, consider ICU
CASE 2 (Trigger 6) - COPD Exacerbation with Type II Respiratory Failure
Final Diagnosis: Acute Exacerbation of COPD (AECOPD) with Type II Respiratory Failure (Hypercapnic Respiratory Failure)
How You Reach This Diagnosis - Clue by Clue
| Clinical Clue | What It Tells You |
|---|---|
| 72-year-old smoker with known COPD | The background diagnosis is already established |
| Worsening breathlessness | Classic AECOPD presentation |
| Increased cough + green sputum | Purulent sputum = bacterial infection is the trigger for this exacerbation |
| Drowsiness | CO₂ narcosis - too much CO₂ is sedating the brain |
| Asterixis (flapping tremor) | Classic sign of hypercapnic encephalopathy - CO₂ disrupts neuromuscular function |
| CXR: hyperinflated lungs | Pre-existing COPD changes (not new consolidation) |
The ABG - Reading It Step by Step
- pH: 7.30 (normal 7.35-7.45)
- PaCO₂: 9.0 kPa (normal 4.7-6.0 kPa)
- HCO₃⁻: 37 mmol/L (normal 22-26 mmol/L)
- PaCO₂ is HIGH (9.0) - when CO₂ is high, pH drops (CO₂ + H₂O → H₂CO₃ → H⁺ + HCO₃⁻, more acid)
- So the high CO₂ is CAUSING the acidosis → RESPIRATORY acidosis
- HCO₃⁻ is HIGH at 37 (normal ~24)
- The kidneys have responded by retaining bicarbonate to buffer the acid
- Kidney compensation takes 2-5 days to fully develop
- Therefore this is NOT a new acute problem - this patient has been retaining CO₂ for a long time, the kidneys have adapted. This is a CHRONIC respiratory acidosis now in ACUTE decompensation
| Type | PaO₂ | PaCO₂ | Cause |
|---|---|---|---|
| Type I | LOW ↓ | Normal or LOW | Failure of oxygenation only (e.g. pneumonia, pulmonary oedema) |
| Type II | LOW ↓ | HIGH ↑ | Failure of ventilation - can't breathe in/out enough (e.g. COPD, obesity, NMD) |
Why Does COPD Cause Type II Failure?
- Airway obstruction + loss of alveoli (from years of smoking) → the lungs can't move enough air in and out per minute
- Respiratory muscles fatigue trying to overcome the obstruction → ventilation drops further
- CO₂ builds up (because not enough air movement to blow it off) → pH drops → acidosis → drowsiness → asterixis
What Each Diagnostic Test Confirms
| Test | Finding | Meaning |
|---|---|---|
| ABG | pH 7.30, PaCO₂ 9.0, HCO₃⁻ 37 | Confirmed Type II RF with chronic compensation |
| CXR | Hyperinflated lungs | Pre-existing COPD; no new consolidation |
| Clinical exam | Asterixis + drowsiness | CO₂ narcosis - confirms hypercapnia clinically |
| Sputum | Green/purulent | Bacterial exacerbation trigger |
| FBC | Expected neutrophilia | Confirms bacterial infection |
| Blood cultures | Needed before antibiotics | Identify causative organism |
Side-by-Side Diagnosis Summary
| Feature | Case 1 | Case 2 |
|---|---|---|
| Diagnosis | Klebsiella pneumonia (CAP) | AECOPD + Type II Respiratory Failure |
| Key clue | Reddish-brown sputum + bulging fissure | Asterixis + high CO₂ on ABG |
| CXR finding | RUL consolidation + bulging fissure | Hyperinflation + flat diaphragm |
| Diagnostic tool | CXR + sputum culture + FBC | ABG (most important) |
| Severity tool | CURB-65 | ABG + clinical severity |
| Failure type | Type I (if hypoxic) | Type II (hypercapnic) |
| Key organism | Klebsiella pneumoniae | Bacterial (green sputum - Haemophilus, Moraxella, Streptococcus) |
The Diagnostic Hierarchy (How Confident Are You?)
- Chronic alcohol + upper lobe + bulging fissure + currant jelly sputum = Klebsiella until proven otherwise
- Sputum/blood culture then confirms and guides antibiotics
- Clinical signs (drowsiness, asterixis) suggest CO₂ narcosis
- ABG proves it with numbers - pH 7.30, PaCO₂ 9.0 = Type II failure, no debate
- Without the ABG, you might underestimate severity or give the wrong oxygen