
Gompertzian curve?
- Small tumors grow fast (high growth fraction)
- Large tumors grow slowly (low growth fraction, high cell death)
- This has clinical implications: smaller tumor burden = faster regrowth after treatment, so dose-dense chemotherapy is more effective early
Gompertzian tumor growth curve
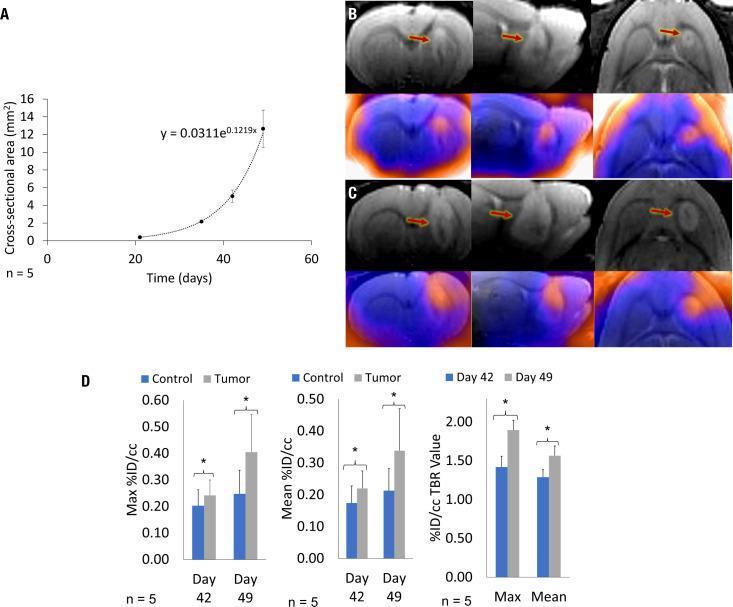
This figure presents multi-modal longitudinal imaging and quantitative data of glioblastoma (GBM10) growth in a rat model. Panel A displays a growth curve showing an exponential increase in tumor cross-sectional area (mm²) from day 21 to day 49. Panels B and C provide triplanar (coronal, sagittal, horizontal) 3D T2-weighted MRI and 18F-FET PET/MRI fusion images at days 42 and 49. T2-weighted images show a progressive hyperintense mass in the striatum (red arrows), while fusion images demonstrate corresponding intense 18F-FET radiotracer uptake, signifying increased amino acid transport. Panel D contains bar graphs quantifying PET activity. Significant increases (P < 0.05) are shown between day 42 and 49 for Max %ID/cc and Mean %ID/cc in the tumor volume of interest (VOI) compared to the contralateral control. Additionally, %ID/cc Tumor-to-Background Ratio (TBR) values (Max and Mean) confirm a significant rise in tumor metabolic intensity relative to normal brain tissue over the one-week interval, illustrating the aggressive progression of the malignancy.
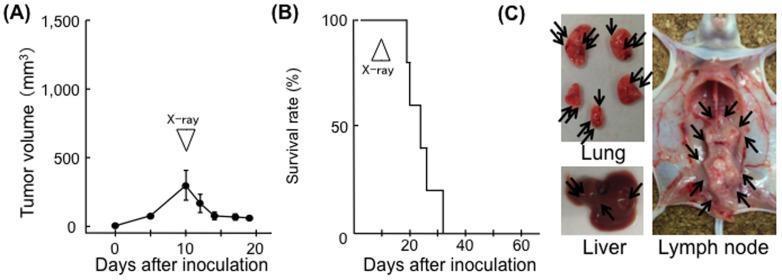
This composite image details the effect of X-ray irradiation on EL4 tumor progression and systemic metastasis in a BALB/c-nu/nu mouse model. Panel A presents a tumor growth curve showing tumor volume increasing until day 10, followed by a sharp reduction after local X-ray irradiation. Panel B shows a corresponding Kaplan-Meier survival curve, indicating a 0% survival rate by day 32 post-inoculation despite the local tumor control. Panel C consists of clinical photographs of dissected internal organs at day 20, illustrating systemic metastasis. The 'Lung' photograph reveals multiple pale nodular lesions (arrows) indicating pulmonary metastasis. The 'Liver' image shows dark, irregular masses representing hepatic involvement. The 'Lymph node' photograph displays the abdominal cavity of a dissected mouse with prominent, enlarged, and clustered lymph nodes (arrows) along the retroperitoneal and mesenteric regions. This data illustrates that while local radiotherapy may control primary tumor volume in immunocompromised models, it may not prevent lethal systemic metastatic spread to critical organs and lymphatic systems.
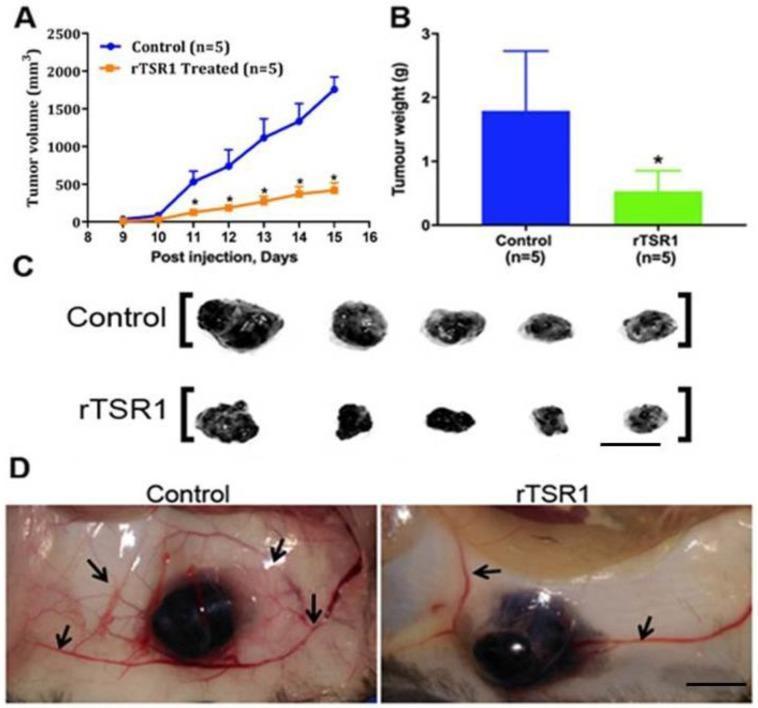
This composite image illustrates the results of an oncology study investigating the efficacy of rTSR1 treatment on B16F10 melanoma tumor growth in a mouse model. Panel A displays a tumor growth curve over 15 days, showing a significant reduction in tumor volume (mm³) in the rTSR1-treated group compared to the control group. Panel B presents a bar graph of mean tumor weight at day 15, quantifying the substantial decrease in mass with treatment. Panel C provides a macro photograph of five dissected dark, pigmented tumor nodules from each group, visually confirming the size reduction in the rTSR1 row; scale bar 1 cm. Panel D shows clinical photographs of the peri-tumor environment in situ. The control group image features dense, robust, and complex vascular branching (indicated by arrows) surrounding the tumor. In contrast, the rTSR1-treated tumor shows a markedly reduced vascular network with fewer and thinner vessels, illustrating the anti-angiogenic properties of the TSR1 domain of ADAMTS5. This image is relevant for studying cancer therapeutics, specifically angiogenesis inhibitors and their impact on tumor proliferation.
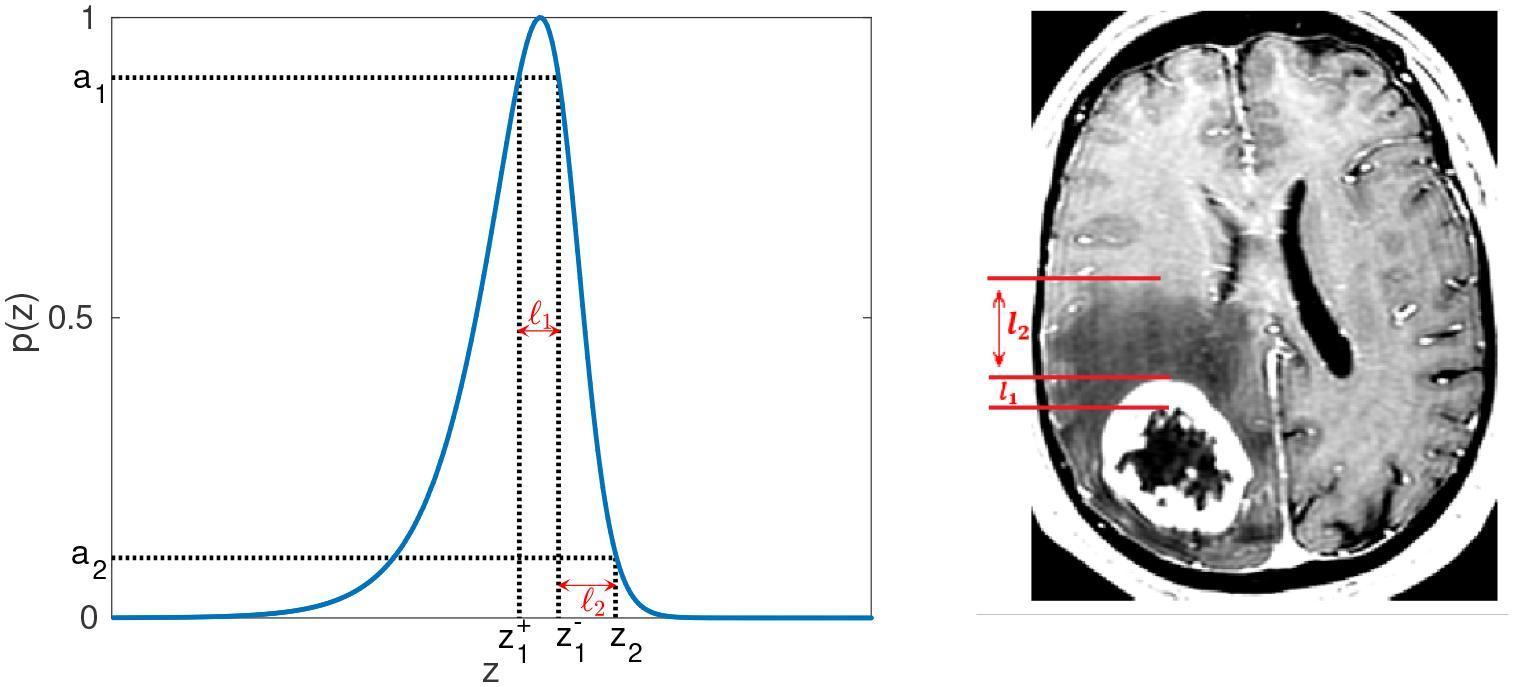
This dual-pane figure illustrates the mathematical modeling of tumor growth parameters matched with clinical neuroimaging. On the right, an axial T1-weighted contrast-enhanced MRI of the brain demonstrates a large, complex neoplasm. The tumor features a central, dark, non-enhancing necrotic core surrounded by a bright, contrast-enhancing rim. Anterior to the mass is a diffuse, hypointense region representing tumor-associated vasogenic edema. Red lines and arrows designate the width of the enhancing rim (l1) and the extent of the edematous region (l2). On the left, a corresponding Pathophysiology Diagram shows a normalized wave profile, p(z), representing the mathematical model of tumor cell density. The blue curve depicts a sigmoidal traveling wave where parameters a1 and a2 represent threshold densities. The intervals l1 (rim width) and l2 (edema width) are mapped onto the z-coordinate axis between specific points z1-, z1+, and z2. This comparison highlights how clinical imaging data for proliferating and edematous zones are used for model parameter estimation in oncology research.
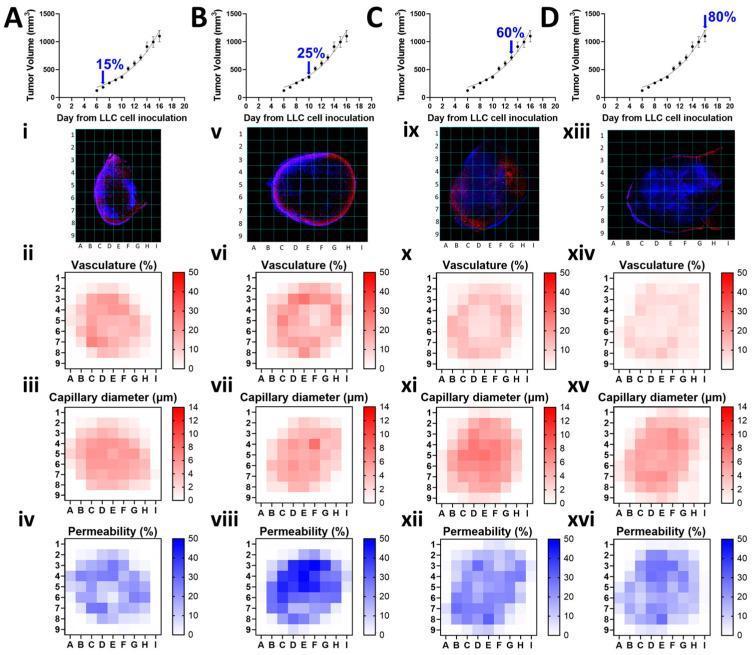
This composite panel illustrates the spatiotemporal evolution of tumor microenvironment parameters in a Lewis Lung Carcinoma (LLC) mouse model at four progression stages: 15% (A), 25% (B), 60% (C), and 80% (D) of total tumor growth. Each column features a tumor growth curve, a fluorescent map, and three parameter-specific heatmaps. Fluorescent images (i, v, ix, xiii) show co-staining of cell nuclei with Hoechst 33342 (blue) and microvasculature with CD31 (red). The 25% stage demonstrates a characteristic peripheral rim of CD31 expression, while later stages show more heterogeneous, punctate staining patterns. Heatmaps derived from grid-based quantification represent: - Vasculature (%) (ii, vi, x, xiv): Shows high central density at 15-25% that decreases significantly at 80%, indicating possible central necrosis. - Capillary diameter (µm) (iii, vii, xi, xv): Demonstrates relatively stable morphology with slight reductions in diameter as the tumor progresses. - Permeability (%) (iv, viii, xii, xvi): Visualized via Hoechst distribution, showing an overall increase in permeability intensity and spatial spread as the tumor matures. These data illustrate key hallmarks of tumor progression including angiogenesis, altered vessel morphology, and increased vascular leakage.
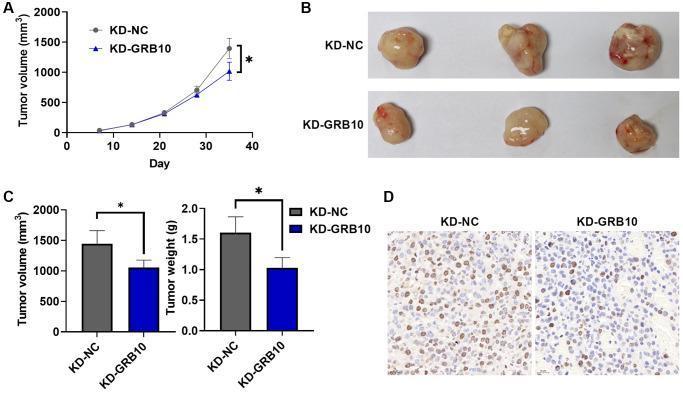
This composite image summarizes an in vivo study on the role of GRB10 in gastric cancer tumor growth using a mouse xenograft model. Panel A presents a tumor growth curve over a 35-day period, showing that the GRB10-knockdown (KD-GRB10) group exhibits significantly lower tumor volumes (mm³) compared to the control (KD-NC) group starting around day 28. Panel B displays clinical photographs of excised subcutaneous tumors, visually confirming that the KD-GRB10 tumors are smaller and more uniform than the larger, more irregular KD-NC tumors. Panel C provides bar graphs quantifying final tumor volume and weight (g), indicating a statistically significant reduction in both parameters for the knockdown group (*p < 0.05). Panel D shows Ki67 immunohistochemical staining of tumor sections; the KD-GRB10 group demonstrates a markedly lower density of brown-stained nuclei compared to the KD-NC group, indicating reduced cellular proliferation. The findings collectively demonstrate that GRB10 knockdown inhibits gastric cancer progression and proliferative activity in vivo.
The Gompertzian Curve
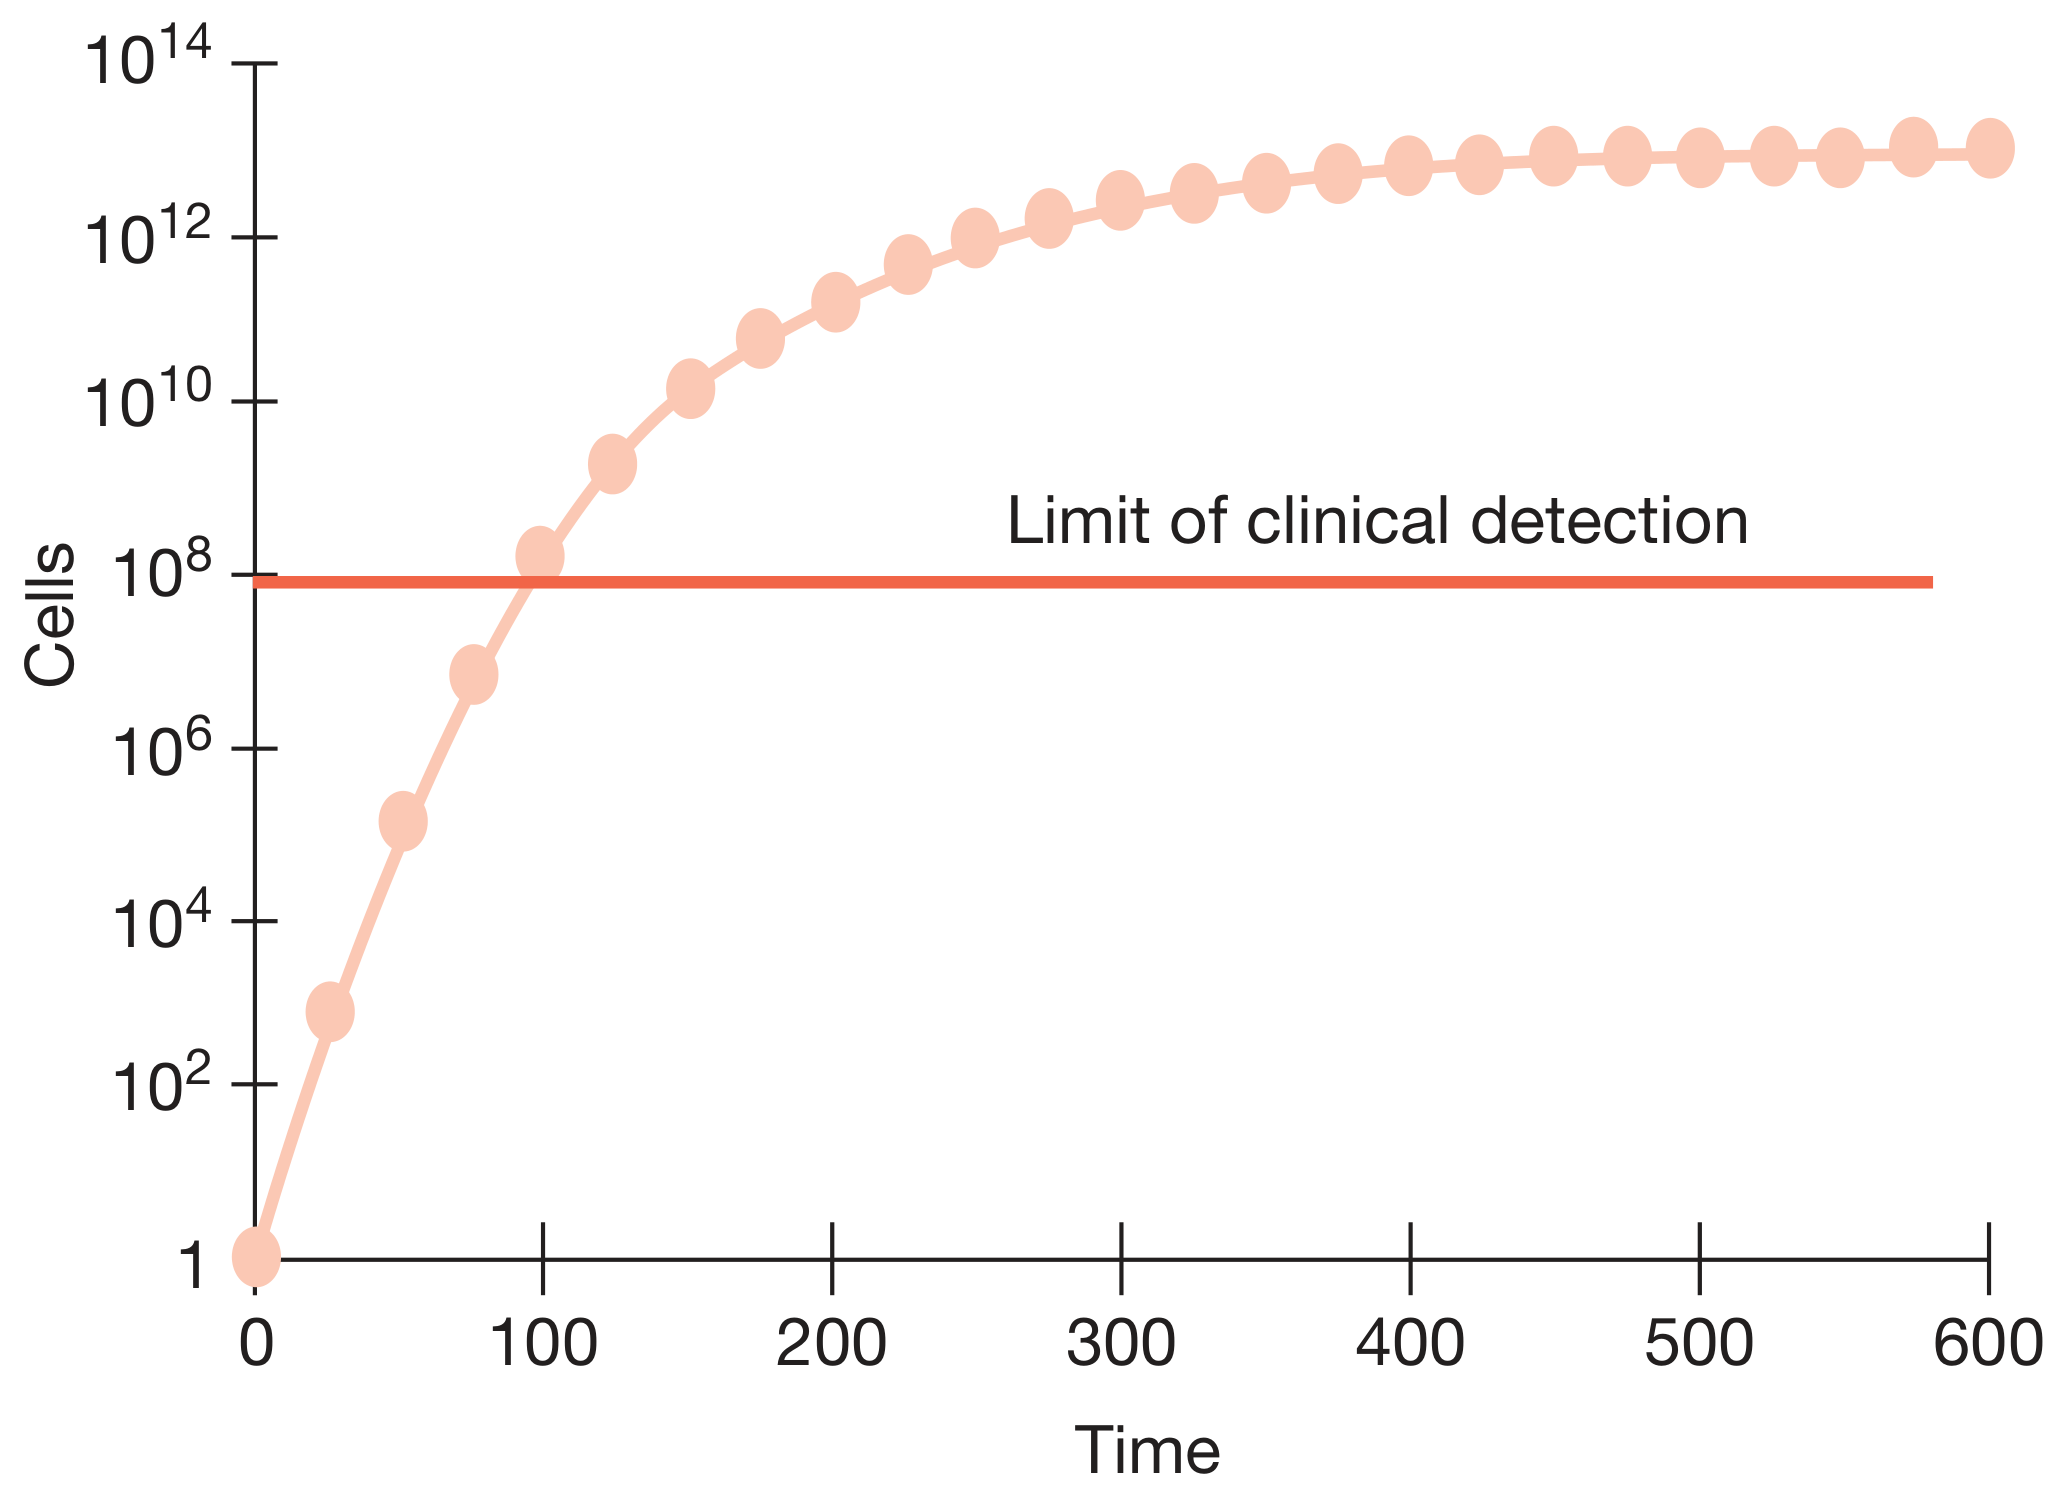
What the Curve Shows
| Phase | What's Happening |
|---|---|
| Early (pre-detection) | Rapid near-exponential growth; high growth fraction |
| Inflection point | Maximum growth rate occurs at ~37% of maximum tumor size (at 1/e) |
| Late (plateau) | Growth decelerates; low growth fraction due to nutrient/oxygen limitations |
Key Distinction: Gompertzian vs. Exponential Growth
"The growth fraction peaks when the tumor is approximately one-third its maximum size. According to the Gompertzian model, when a patient with advanced cancer is treated, the tumor mass is larger, its growth fraction is low, and the fraction of cells killed is, therefore, small."
- Katzung's Basic and Clinical Pharmacology, 16th Ed.
- Small tumor = high growth fraction = fast doubling = many cells in cycle = vulnerable to chemotherapy
- Large tumor (clinical presentation) = low growth fraction (only 1-4% actively dividing for many solid tumors at diagnosis) = slow doubling = resistant to chemotherapy
Why Does Growth Slow Down?
- Nutritional limitations - inner cells become hypoxic and nutrient-deprived
- Oxygenation difficulties - inadequate angiogenesis relative to bulk
- Cell competition - tumor cells compete with each other AND with host tissues
- High cell loss fraction - in squamous carcinomas, up to 99% of produced cells are lost (by exfoliation, necrosis, apoptosis)
Clinical Implications
-
Why most solid tumors are diagnosed late: By the time a tumor reaches ~10^9 cells (1 cm, the limit of detection), it has undergone ~30 doublings - but already has only ~50 more doublings before becoming fatal (~10^12 cells, 1 kg). Most of the tumor's "life" has already occurred before it is found.
-
Dose-dense chemotherapy rationale: After treatment reduces tumor bulk, the surviving cells re-enter fast Gompertzian growth (small burden = high growth fraction). This is why dose-dense regimens (e.g., AC-T q2 weeks in breast cancer) space treatments closely - to kill cells before they can re-accelerate.
-
Norton-Simon hypothesis: Builds directly on Gompertzian kinetics - the rate of tumor regression mirrors the rate of growth at that tumor size. Smaller residual tumors regrow faster, so more frequent dosing is needed.
-
Adjuvant chemotherapy effectiveness: More effective when tumor burden is minimal (micrometastatic disease), because cells are in the rapid growth phase of the Gompertz curve.
-
Contrast with leukemias: Murine L1210 leukemia (and some human hematologic malignancies like acute leukemia) DO follow exponential kinetics - hence the log-kill model applies more directly there, and cure is more achievable.
Summary Formula
- Harrison's Principles of Internal Medicine, 22nd Ed., Fig. 78-1 and accompanying text
- Katzung's Basic and Clinical Pharmacology, 16th Ed., Ch. 54
- Bailey and Love's Short Practice of Surgery, 28th Ed., Ch. 12
- Schwartz's Principles of Surgery, 11th Ed.