I now have rich textbook content and images. Let me compile the comprehensive answer.
Infectious Diseases Epidemiology: Dynamics of Disease Transmission
Source: Park's Textbook of Preventive and Social Medicine
1. Introduction
Infectious disease epidemiology is the foundational pillar of the entire discipline of epidemiology - the subject itself grew out of the study of epidemic infectious diseases. Despite advances in vaccines and antibiotics (which did not lead to the predicted disappearance of infectious diseases), a renaissance in communicable disease study has been driven by: (a) changing patterns of communicable diseases, (b) discovery of "new" infections (e.g., HIV, COVID-19, Nipah), and (c) evidence that some chronic diseases have infective origins. - Park's Textbook of Preventive and Social Medicine, p. 105
2. Key Definitions
| Term | Definition |
|---|
| Infection | Entry and development/multiplication of an infectious agent in a host organism, with some host response (immune or clinical disease). Not all infections cause illness. |
| Contamination | Presence of an infectious agent on a body surface or inanimate object (does not imply carrier state). |
| Infestation | Lodgement and reproduction of arthropods on body surface or clothing (e.g., lice, itch mite). |
| Host | Any living organism (person, animal, arthropod) providing subsistence to an infectious agent under natural conditions. |
| Eradication | Termination of ALL transmission globally by extermination of the agent - an "all or none" phenomenon. Only smallpox has been eradicated to date. |
| Elimination | Eradication from a defined geographic region (e.g., measles elimination from a country). |
Levels of Infection
- Colonization (e.g., S. aureus in normal nasopharynx)
- Subclinical/inapparent infection (e.g., polio)
- Latent infection (e.g., herpes simplex virus)
- Manifest/clinical infection
3. Epidemic Terminology
| Term | Meaning | Examples |
|---|
| Endemic | Constant presence at expected levels in a defined area | Malaria in sub-Saharan Africa |
| Epidemic | Occurrence in excess of normal expectation; sharply elevated incidence | Cholera outbreaks |
| Pandemic | Epidemic crossing international boundaries, affecting large numbers globally | Influenza pandemics, COVID-19 |
| Sporadic | Cases occurring irregularly, haphazardly, with no recognizable common source | Tetanus, herpes zoster |
| Zoonosis | Infection transmissible from vertebrate animals to humans under natural conditions | Rabies, plague, brucellosis |
| Epizootic | An epidemic of disease in an animal population | Anthrax, rabies outbreaks in animals |
Zoonosis subtypes:
- Anthropozoonoses: From animals to man (rabies, plague, anthrax)
- Zooanthroponoses: From man to animals (human TB in cattle)
- Amphixenoses: Maintained in both, transmissible in either direction (T. cruzi, S. japonicum)
4. Dynamics of Disease Transmission - The Chain of Infection
The fundamental model of infectious disease transmission involves three interlocking links:
Fig. 16 - Chain of Infection (Park's Textbook of Preventive and Social Medicine)
Link 1: Reservoir / Source of Infection
- Source of infection: The person, animal, object, or substance from which an infectious agent passes to a host.
- Reservoir: Any person, animal, arthropod, plant, soil, or substance in which an infectious agent lives, multiplies, and can be transmitted to a susceptible host - essentially, the agent's natural habitat where it metabolizes and replicates.
The terms "reservoir" and "source" are not always synonymous. In hookworm, the reservoir is humans, but the source is soil contaminated with infective larvae. In typhoid, the reservoir is a case or carrier, while the source may be faeces, urine, contaminated food, or water.
- Homologous reservoir: Another member of the same species (e.g., humans for Vibrio cholerae)
- Heterologous reservoir: A different species (e.g., animals/birds for zoonoses)
Link 2: Modes of Transmission
Transmission can be direct or indirect:
A. Direct Transmission
| Route | Mechanism | Examples |
|---|
| Direct contact | Skin-to-skin, mucosa-to-mucosa (touching, kissing, sexual intercourse) | STIs, AIDS, leprosy, leptospirosis |
| Droplet infection | Spray of droplets (coughing, sneezing, speaking); particles ≤5 µm penetrate to alveoli; range ~30-60 cm | Respiratory infections, COVID-19, diphtheria, TB, meningococcal meningitis |
| Contact with soil | Exposure of tissue to disease agent in soil/compost | Hookworm, tetanus, mycosis |
| Inoculation into skin/mucosa | Direct inoculation | Rabies (dog bite), Hepatitis B (contaminated needles) |
| Transplacental (vertical) | Mother-to-fetus across placenta | TORCH agents (Toxoplasma, rubella, CMV, herpes), syphilis, Hepatitis B, HIV |
B. Indirect Transmission
| Route | Mechanism | Examples |
|---|
| Vehicle-borne | Contaminated food, water, milk, biological products | Cholera, typhoid, dysentery |
| Vector-borne (mechanical) | Simple carriage by arthropod (no multiplication) | Flies carrying enteric pathogens |
| Vector-borne (biological) | Multiplication/development in vector required | Malaria (Plasmodium in Anopheles), dengue (Aedes) |
| Air-borne - Droplet nuclei | Dried residue of droplets, <5 µm, remain suspended, travel long distances | TB, measles, chickenpox, legionella |
| Air-borne - Dust | Dried infectious particles settled on surfaces, resuspended | Histoplasmosis, Q fever |
| Fomite-borne | Inanimate objects contaminated with infectious agent | Smallpox (clothing), trachoma (towels) |
| Unclean hands/fingers | Hand-to-mouth transmission | Staphylococcal/streptococcal infections, typhoid, hepatitis A |
Link 3: The Susceptible Host
Successful Parasitism - Four Requirements
For an infectious agent to establish infection, four stages must succeed:
-
Portal of Entry - The agent must find entry: respiratory tract, alimentary tract, genitourinary tract, skin. Some organisms have multiple portals (Hepatitis B, Q fever, brucellosis).
-
Site of Election - The agent must reach appropriate tissue with optimum conditions for multiplication and survival.
-
Portal of Exit - The agent must exit the body to reach a new host. Without a portal of exit, a "dead-end infection" occurs (e.g., rabies, bubonic plague, tetanus, trichinosis).
-
Survival in external environment - Must survive long enough to reach a new host. Importantly, the best-adapted pathogens produce only low-grade immunity, keeping the host perpetually vulnerable (the classic example is the common cold virus).
5. Incubation Period
The incubation period is "the time interval between invasion by an infectious agent and appearance of the first sign or symptom of disease." During this time, the pathogen undergoes multiplication. Disease becomes overt once a sufficient density of the agent is built up.
Factors determining incubation period:
- Generation time of the pathogen
- Infective dose
- Portal of entry
- Individual susceptibility
Generally, diseases are NOT communicable during the incubation period, with important exceptions:
- Measles, chickenpox, whooping cough, and hepatitis A are communicable during the later part of the incubation period.
| Incubation Period Length | Examples |
|---|
| Hours to 2-3 days (very short) | Staphylococcal food poisoning, cholera |
| Intermediate (days-weeks) | Typhoid, malaria, hepatitis A |
| Long (months-years) | HIV, leprosy, rabies (can vary widely) |
The median incubation period = time for 50% of cases to appear following a defined exposure event.
6. Secondary Attack Rate (SAR)
A key measure of transmission intensity within a defined exposure group:
SAR = (Number of cases among contacts / Total number of susceptible contacts exposed) × 100
A modified formula for TB measures contact risk over time (person-weeks of exposure). SAR is useful for:
- Measuring spread within households or closed settings
- Determining whether a disease of unknown etiology is communicable
- Evaluating effectiveness of control measures (isolation, vaccination)
7. Host Defences
Host defences against infection operate on multiple overlapping levels:
Non-Specific (Innate) Defences
- Physical barriers (skin, mucous membranes, ciliary action)
- Chemical barriers (gastric acid, lysozyme, secretory IgA)
- Phagocytic cells (neutrophils, macrophages)
- Complement system, inflammatory response
Specific (Adaptive) Defences
(1) Humoral Immunity (B-cell mediated)
- Produces specific antibodies (IgG, IgM, IgA, IgE, IgD)
- Effective for extracellular pathogens
- Example of limitation: >100 serotypes of rhinoviruses - no single vaccine covers all
- Maternal IgG crosses the placenta, providing passive immunity to infants for ~3-6 months
(2) Cellular Immunity (T-cell mediated)
- Critical against intracellular pathogens that escape antibody action: M. leprae, M. tuberculosis, S. typhi, Candida, many viruses
- These pathogens can multiply in macrophages, but activated macrophages (stimulated by T-cell lymphokines) perform far more efficient phagocytosis
- T-cells recognize antigen, activate macrophages, release cytotoxic factors, mediate delayed hypersensitivity reactions
- Responsible for immunity in TB, brucellosis, and transplant rejection
- Severe T-cell deficiency is more acutely lethal than humoral deficiency (death within 6 months vs. survival up to 6 years)
(3) Combined Immunity
B and T cells cooperate with macrophages and killer (K) cells:
- Helper T-cells (CD4+): Required for optimal antibody production
- Suppressor T-cells: Inhibit immunoglobulin synthesis
- Natural killer (NK) cells: Non-specifically destroy virus-infected cells
- Modern vaccines must elicit both humoral and cell-mediated responses to be effective
8. Mathematical Modelling of Disease Transmission
The SIR/SEIR Framework
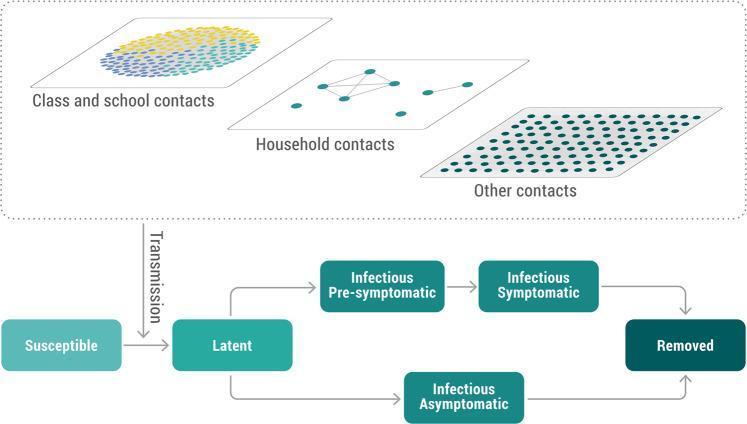
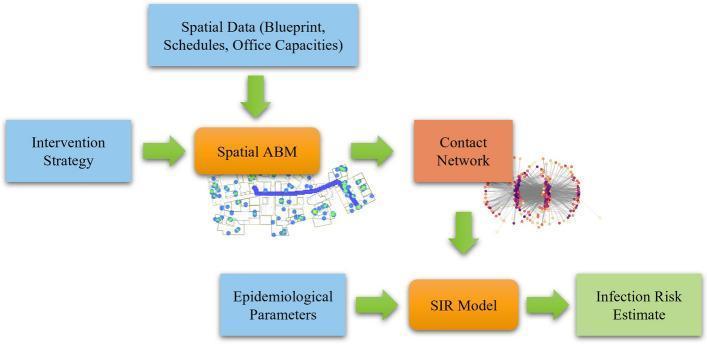
Compartmental models divide a population into categories based on disease status:
| Model | Compartments | Best for |
|---|
| SIR | Susceptible → Infectious → Recovered | Acute infections with lasting immunity (e.g., measles, influenza) |
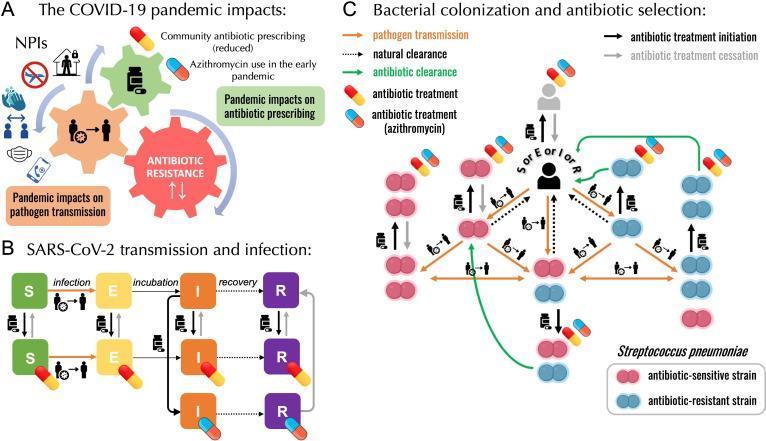
| SEIR | Susceptible → Exposed → Infectious → Recovered | Diseases with a latent period (most respiratory viruses) |
| SEIRS | SEIR + waning immunity | Diseases with temporary immunity (e.g., coronaviruses, RSV) |
| SIS | Susceptible → Infectious → Susceptible | Diseases with no lasting immunity (STIs, some bacterial infections) |
Key Parameters
| Parameter | Symbol | Definition |
|---|
| Basic Reproduction Number | R₀ | Average number of secondary infections produced by one case in a fully susceptible population |
| Effective Reproduction Number | Rₜ | R₀ adjusted for current population immunity at time t; Rₜ = R₀ × S(t)/N |
| Serial interval | SI | Time between symptom onset in successive cases in a chain |
| Generation time | Tg | Time between infection of primary case and infection of secondary case |
| Transmission rate | β | Rate at which susceptibles become infected per contact with an infectious person |
| Recovery rate | γ | Rate of recovery (= 1/duration of infectiousness) |
| Herd Immunity Threshold | HIT | Proportion of population that must be immune to prevent epidemic growth |
R₀ for selected pathogens:
| Disease | R₀ |
|---|
| Measles | 12-18 |
| Chickenpox | 8-12 |
| Mumps | 4-7 |
| COVID-19 (original) | 2-3 |
| Influenza (seasonal) | 1.2-1.4 |
| Ebola | 1.5-2.5 |
| SARS | 2-5 |
Epidemic Threshold and Herd Immunity
- If R₀ > 1: epidemic grows
- If R₀ < 1: epidemic dies out
- Herd Immunity Threshold (HIT) = 1 - (1/R₀)
So for measles (R₀ = 15): HIT = 1 - 1/15 = 93% of the population must be immune to prevent sustained transmission. This is why measles vaccination coverage must exceed 93-95% to achieve elimination.
As more people gain immunity (through infection or vaccination), Rₜ declines. When Rₜ falls below 1, the epidemic curve peaks and begins to fall.
The Epidemic Curve
The incidence of infection over time follows a characteristic pattern:
- Rising phase: Rₜ > 1, susceptibles are abundant
- Peak: Rₜ = 1, susceptible pool depletes to 1/R₀
- Declining phase: Rₜ < 1 as herd immunity builds
- Early interventions (reducing β) have a far greater impact than late ones
9. Factors Influencing Disease Transmission
Agent Factors
- Infectivity: Ability to establish infection in a host
- Pathogenicity: Proportion of infected hosts who develop clinical disease
- Virulence: Severity of disease produced
- Antigenicity: Ability to stimulate immune response
- Transmissibility: Ease of spread from host to host
Host Factors
- Age, sex, genetic makeup
- Nutritional status, immune competence
- Behavior (sexual practices, hygiene, vaccination uptake)
- Comorbidities
Environmental Factors
- Climate and season (e.g., influenza peaks in winter)
- Sanitation and water quality
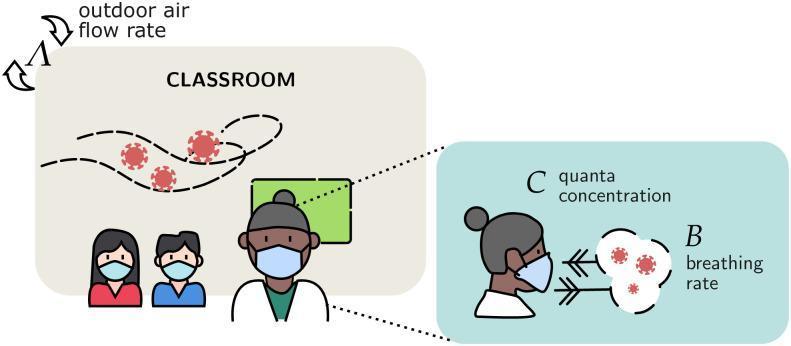
- Overcrowding and ventilation
- Vector habitats (breeding sites for mosquitoes)
- Healthcare infrastructure
10. Control Measures Targeting Each Link
| Link | Control Strategy |
|---|
| Reservoir/Source | Treatment of cases and carriers, animal reservoir control, surveillance |
| Mode of Transmission | Sanitation, water treatment, vector control, PPE, barrier precautions, isolation |
| Susceptible Host | Vaccination (active immunity), prophylaxis, health education, nutritional support |
The most durable and cost-effective interventions target multiple links simultaneously (e.g., mass vaccination + improved sanitation for cholera control).
Recent Evidence
A 2024
Lancet Infectious Diseases systematic review on Ebola compiled epidemiological parameters (including R₀ estimates) across Ebola outbreaks, highlighting how transmission dynamics vary significantly by setting and response capacity (PMID: 39127058). A separate 2024 systematic review on
non-pharmaceutical interventions and COVID-19 transmission (Italy, US, UK, China) reinforced that targeted reductions in β (transmission rate) - via masking, distancing, and lockdowns - can effectively suppress Rₜ below 1 and control epidemic spread (PMID: 39484353).
Summary: Disease transmission is governed by the interplay of reservoir, mode of transmission, and susceptible host. Breaking any link in this chain interrupts spread. Mathematical models (SIR/SEIR) quantify these dynamics through R₀, Rₜ, and the herd immunity threshold, providing actionable targets for public health interventions. Host immunity - both innate and adaptive - is the final barrier, and understanding its limits informs vaccine design and outbreak response strategy.