
Can you tell me all the Laqs Saqs And Vsaqs from abdomen anatomy as per knruhs university
KNRUHS university anatomy abdomen LAQ SAQ VSAQ exam questions
Kaloji Narayana Rao University Health Sciences anatomy abdomen long short answer questions
https://www.scribd.com/document/634593013/Abdomen-and-Pelvis…
Abdomen Anatomy - LAQs, SAQs & VSAQs (KNRUHS Pattern)
Note: KNRUHS (Kaloji Narayana Rao University of Health Sciences, Warangal) follows the MCI/NMC MBBS curriculum. The questions below are compiled from KNRUHS previous papers, standard question banks of Telangana medical colleges, and Anatomy Paper-II examination patterns. They align with the topics covered under Abdomen & Pelvis.
LONG ANSWER QUESTIONS (LAQs) - 10 Marks each
Anterior Abdominal Wall
- Describe the inguinal canal - its walls, contents, and clinical importance. Add a note on inguinal hernia.
- Describe the rectus sheath - its formation above and below the arcuate line, contents, and clinical significance.
- Describe the layers of the anterior abdominal wall with their nerve supply and blood supply.
Peritoneum
- Describe the peritoneum - its subdivisions, peritoneal folds, and recesses. Add a note on the lesser sac (omental bursa).
- Describe the formation, contents, and applied anatomy of the greater omentum.
Stomach
- Describe the stomach - its position, relations, blood supply, nerve supply, and lymphatic drainage. Add a note on partial gastrectomy.
Liver & Biliary Apparatus
- Describe the liver - its surfaces, lobes, relations, blood supply, and portal circulation. Add a note on portocaval anastomosis.
- Describe the extrahepatic biliary apparatus. Add a note on the formation of bile duct and cholelithiasis.
- Describe the portal vein - its formation, tributaries, portocaval anastomosis, and clinical significance.
Duodenum & Pancreas
- Describe the duodenum - its parts, relations, blood supply, and clinical significance.
- Describe the pancreas - its parts, relations, blood supply, and applied anatomy. Add a note on pancreatitis.
Spleen
- Describe the spleen - its position, relations, blood supply, and clinical significance.
Kidneys & Suprarenal Glands
- Describe the kidney - its position, relations, blood supply, structure, and clinical significance. Add a note on nephrectomy.
- Describe the suprarenal (adrenal) gland - its position, relations, blood supply, and clinical significance.
Large & Small Intestine
- Describe the large intestine - its subdivisions, blood supply, and applied anatomy. Add a note on McBurney's point.
- Describe the vermiform appendix - its position, blood supply, and clinical significance.
Posterior Abdominal Wall
- Describe the posterior abdominal wall - its muscles, nerves, and vessels. Add a note on lumbar plexus.
- Describe the abdominal aorta - its course, branches, and clinical significance.
- Describe the inferior vena cava - its formation, tributaries, and clinical significance.
Ureter
- Describe the ureter - its course, relations, constrictions, blood supply, and clinical significance.
SHORT ANSWER QUESTIONS (SAQs) - 5 Marks each
Anterior Abdominal Wall
- Hesselbach's triangle
- Deep inguinal ring
- Superficial inguinal ring
- Spermatic cord - contents
- Cremasteric reflex and its nerve
- Femoral canal and femoral hernia
- Linea alba
- Linea semilunaris
- Conjoint tendon (Inguinal falx)
- Arcuate line (Linea semicircularis)
Peritoneum
- Epiploic foramen (Foramen of Winslow) - boundaries
- Lesser sac (omental bursa) - boundaries
- Peritoneal folds and ligaments
- Mesentery - root, contents
- Pouch of Douglas (Rectouterine pouch)
- Hepatorenal pouch (Morrison's pouch)
Stomach
- Bed of stomach
- Blood supply of stomach
- Nerve supply of stomach
- Relations of stomach
Liver
- Bare area of liver
- Porta hepatis - contents
- Caudate lobe of liver
- Ligamentum teres and ligamentum venosum
- Blood supply of liver
- Liver biopsy - applied
Gall Bladder
- Calot's triangle (Cystohepatic triangle)
- Blood supply of gall bladder
- Referred pain in cholecystitis
Spleen
- Relations of spleen
- Blood supply of spleen
Duodenum
- Relations of first part of duodenum
- Duodenojejunal flexure - supports
- Blood supply of duodenum
Pancreas
- Pancreatic duct - formation, opening
- Relations of neck of pancreas
- Blood supply of pancreas
Kidney
- Hilum of kidney - contents
- Relations of right kidney
- Relations of left kidney
- Renal fascia (Gerota's fascia)
- Renal artery - branches
Ureter
- Constrictions of ureter
- Ureter in female pelvis - applied anatomy
Suprarenal Gland
- Blood supply of suprarenal gland
- Differences between right and left suprarenal gland
Posterior Abdominal Wall
- Lumbar plexus - formation and branches
- Psoas major muscle
- Diaphragm - openings and their contents
- Abdominal aorta - branches
Appendix
- Blood supply of appendix
- McBurney's point
- Positions of appendix
- Referred pain in appendicitis
Large Intestine
- Caecum - position and relations
- Sigmoid colon - blood supply
VERY SHORT ANSWER QUESTIONS (VSAQs) - 2 Marks each
Anterior Abdominal Wall
- What is Hesselbach's triangle? Name its boundaries.
- Name the contents of the inguinal canal in females.
- Name the layers of the spermatic cord.
- What is the processus vaginalis?
- Name the muscles forming the conjoint tendon.
- What is a direct inguinal hernia?
- What is McBurney's point?
- Name the layers of the anterior abdominal wall.
- What is the arcuate line?
- What is the linea alba?
Peritoneum
- What are the boundaries of the epiploic foramen?
- Name the contents of the lesser sac.
- What is the pouch of Douglas?
- What is Morrison's pouch?
- Define retroperitoneal organs - give two examples.
- Name the ligaments of the liver.
- What is the greater omentum?
Stomach
- Name the blood supply of the lesser curvature of the stomach.
- What is the bed of the stomach?
- Name the relations of the pylorus.
- What is Kocher's maneuver?
Liver & Biliary Apparatus
- Name the contents of the porta hepatis.
- What is the bare area of the liver?
- What is Calot's triangle?
- What is ligamentum teres?
- Name the lobes of the liver.
- What are the tributaries of the portal vein?
- Name the sites of portocaval anastomosis.
- Name the parts of the biliary apparatus.
Spleen
- Where does the spleen lie? Name its notch.
- Name the blood supply of the spleen.
- What is hypersplenism?
Duodenum
- Name the parts of the duodenum.
- Name the structures opening into the second part of the duodenum.
- What is the ampulla of Vater?
Pancreas
- Name the parts of the pancreas.
- What is the uncinate process of the pancreas?
- What is the Wirsung duct?
- What is the Santorini duct?
Kidney
- Name the contents of the renal hilum.
- What is the renal angle?
- Name the relations of the right kidney.
- What is nephroptosis?
- What is the renal fascia?
Ureter
- Name the constrictions of the ureter.
- What is the normal diameter of the ureter?
- What is ureterolithiasis?
Suprarenal Glands
- What is the shape of the right suprarenal gland?
- What is the shape of the left suprarenal gland?
- Name the blood supply of the suprarenal gland.
Posterior Abdominal Wall
- Name the openings of the diaphragm and their vertebral levels.
- What is the aortic hiatus? What passes through it?
- Name the branches of the abdominal aorta.
- Name the muscles of the posterior abdominal wall.
- What is the lumbar triangle?
Appendix
- Name the positions of the appendix.
- What is Rovsing's sign?
- What is Dunphy's sign?
- What nerve supplies the appendix?
- What is the artery of the appendix?
Large Intestine
- Name the taenia coli.
- What are haustra?
- What is the difference between large and small intestine (2 points)?
- What is the ileo-cecal valve?
- Name the parts of the large intestine.
Key Topics by Frequency (KNRUHS Trend)
| Topic | Frequency |
|---|---|
| Inguinal canal | Very High |
| Portal vein / portocaval anastomosis | Very High |
| Liver (blood supply, porta hepatis) | Very High |
| Kidney (relations, blood supply) | Very High |
| Peritoneum / lesser sac | High |
| Duodenum | High |
| Appendix (positions, blood supply) | High |
| Diaphragm (openings) | High |
| Rectus sheath | High |
| Ureter (constrictions) | High |
| Pancreas | Moderate |
| Spleen | Moderate |
| Suprarenal gland | Moderate |
Exam Pattern (KNRUHS Anatomy Paper II): Typically 2 LAQs (10 marks each) + 10 SAQs (5 marks each) + 10 VSAQs (2 marks each) = 80 marks + 20 MCQs = 100 marks. Abdomen & Pelvis shares the paper with Thorax/Lower Limb/Histology depending on the university scheduling.
Acprding to latest question paper pattern arether eany options in questions while aatempting or every question is compulsory
KNRUHS MBBS anatomy paper pattern 2024 2025 LAQ SAQ options compulsory NMC
https://www.telanganastudy.com/knruhs-mbbs.html
KNRUHS Anatomy - Are Questions Optional or Compulsory?
Short Answer: There ARE internal options in LAQs. SAQs and VSAQs are generally compulsory.
Detailed Breakdown (Latest Pattern - 2024/2025):
LAQs (Long Answer Questions) - OPTIONS PROVIDED
- KNRUHS gives either/or choices in LAQs
- Typically written as: "Answer any 2 out of 3" or "A or B" format
- Example from actual papers:
- Q1. (a) Describe the inguinal canal OR (b) Describe the rectus sheath
- So you get flexibility - you do not have to attempt every LAQ set; you choose one from each pair
SAQs (Short Answer Questions) - COMPULSORY (mostly)
- In most KNRUHS anatomy papers, SAQs are all compulsory - no options
- Occasionally the pattern is "attempt any 8 out of 10" - this varies per paper
- Always check the instruction line at the top of your actual paper
VSAQs (Very Short Answer Questions) - COMPULSORY
- All VSAQs are compulsory - no options given
- These are quick 2-mark questions and all must be answered
MCQs - All compulsory, no negative marking in KNRUHS
General Instruction Line in KNRUHS Papers:
"Answer all sections. In Section A (LAQ), answer any ONE from each question. All questions in Section B (SAQ) and Section C (VSAQ) are compulsory."
Key Takeaway Table:
| Section | Options? | Strategy |
|---|---|---|
| LAQ (10 marks) | ✅ Yes - A or B choice | Pick the one you know better |
| SAQ (5 marks) | ❌ Usually compulsory | Prepare all topics |
| VSAQ (2 marks) | ❌ Compulsory | Prepare all topics |
| MCQ (1 mark) | ❌ Compulsory | No negative marking |
Important: The exact instruction can slightly vary paper to paper. Always read the instructions on top of the question paper carefully on exam day before starting. The LAQ option (A or B) is the most consistent feature across KNRUHS anatomy papers since 2022 onward.
Can you tell me highly asked histology diagrams from whole anatomy
KNRUHS MBBS anatomy histology important diagrams frequently asked exam 2024 2025
histology slide hyaline cartilage microscopy labeled diagram
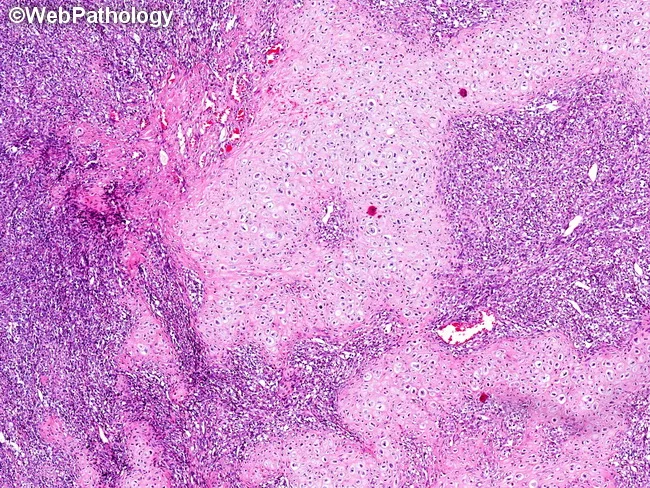
Imaging modality: Light microscopy of hematoxylin-eosin stained histology slide. The specimen is a biphasic cartilaginous-soft tissue tumor from the musculoskeletal system. Histology reveals islands of well-differentiated hyaline cartilage juxtaposed with densely cellular, small round blue cells within a highly cellular mesenchymal stroma. The cartilage islands show lacunar architecture, chondrocyte-like cells with abundant basophilic matrix, and occasional calcifications; the surrounding stroma consists of spindle to stellate undifferentiated cells with hyperchromatic nuclei and mitotic activity in some fields. This combination of chondroid differentiation and undifferentiated mesenchymal component is characteristic of mesenchymal chondrosarcoma (MC). Immunophenotype is variable; cartilage elements typically express S100, whereas the undifferentiated component may express markers of myogenic or fibroblastic lineage, requiring molecular confirmation in challenging cases. The differential diagnosis includes spindle cell/sclerosing rhabdomyosarcoma, small cell osteosarcoma, and dedifferentiated chondrosarcoma; however, MC often shows gradual blending of components and hyaline cartilage islands, unlike abrupt dedifferentiation. The HEY1-NCOA2 fusion supports MC. Clinically, MC presents in younger patients and arises in bone or soft tissue; radiographs may reveal cartilaginous calcifications. Correlating histology with imaging and, when necessary, molecular studies enhances diagnostic accuracy and informs surgical planning, chemotherapy considerations, and prognosis. This fusion-guided approach improves diagnostic confidence and guides therapy and prognosis
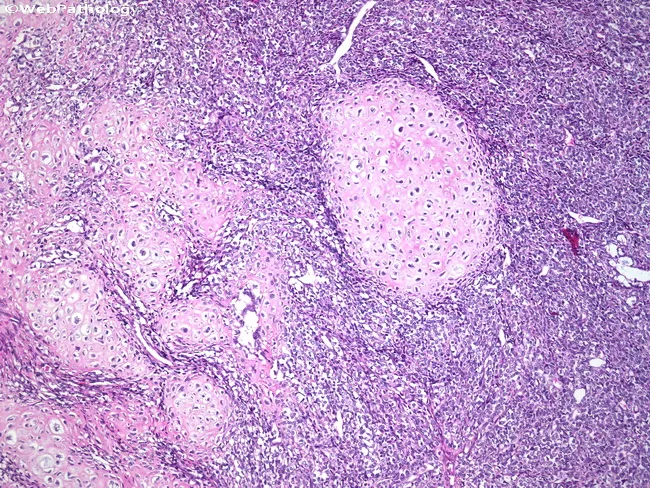
Histopathology slide of cartilaginous tissue showing hyaline-like matrix arranged in lobules with chondrocytes embedded in lacunae. Chondrocytes are occasionally binucleated and dispersed within a basophilic cartilage background, with preserved pericellular matrix surrounding lacunae. The matrix displays chondroid differentiation with subtle myxoid features and scattered calcifications or osseous nodules. In this field, the chondroid regions are relatively well differentiated, yet the morphological pattern may resemble a well-differentiated chondrosarcoma, raising diagnostic challenge. The cellularity is variable, ranging from hypocellular zones to mildly increased cellularity at peripheries, without overt high-grade pleomorphism or mitotic activity in the presented areas. The lesion appears to be infiltrative in a histologic sense only through interface with surrounding stroma; however, definitive malignant behavior requires correlation with radiology and clinical history. Notable features include cartilaginous matrices with lacunar chondrocytes, occasional binucleation, calcified foci, and potential ossification. This image underscores the need for contextual evaluation to differentiate enchondroma from low-grade chondrosarcoma, given the overlapping histology. Clinical significance lies in assessing malignant potential, guiding biopsy strategy, surgical planning, (limb-sparing versus more extensive resection), and prognosis. Terminology: cartilaginous tumor, chondroid neoplasm, hyaline cartilage tumor; synonyms: low-grade chondrosarcoma, enchondroma; radiologic-pathologic concordance essential. This description assumes H&E staining and standard light microscopy for reference.
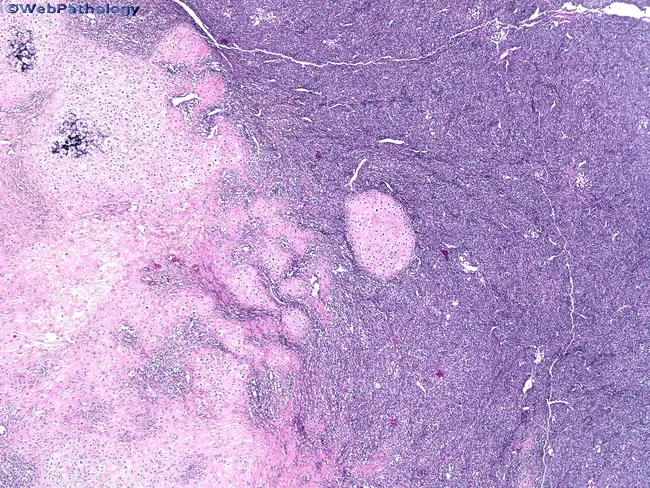
Imaging modality: Light microscopy of Hematoxylin and Eosin stained tissue section, bright-field illumination. This histopathology image demonstrates a biphasic neoplasm characteristic of mesenchymal chondrosarcoma. The slide shows well-differentiated hyaline cartilage nodules embedded within an intensely cellular undifferentiated mesenchymal stroma. The cartilaginous component exhibits lacunar chondrocytes within a glossy chondroid matrix, occasional binucleation, and chondrocyte maturation features. The adjacent stroma consists of small, round to spindle-shaped cells with scant cytoplasm, hyperchromatic nuclei, and high mitotic activity in focal areas. The boundary between cartilage and stroma is sharply defined, creating a clear demarcation of two distinct tissue compartments. Occasional calcifications or endochondral ossification foci may be present within cartilaginous islands. The overall architecture is lobulated with abrupt juxtaposition of chondroid and primitive mesenchymal elements, and may show areas of necrosis or hemorrhage in larger lesions. Clinically, this biphasic pattern is diagnostic when correlated with immunohistochemistry and radiological data. Differential diagnoses include conventional chondrosarcoma, Ewing sarcoma, and other small round cell tumors with cartilaginous differentiation. The image underscores the diagnostic significance of recognizing dimorphic histology for accurate classification, prognosis, and treatment planning in musculoskeletal oncology. Immunohistochemical profiles may include CD99 positivity in the stroma with variable S-100 expression in cartilage, and variable negativity for cytokeratin.
stratified squamous epithelium histology microscopy labeled
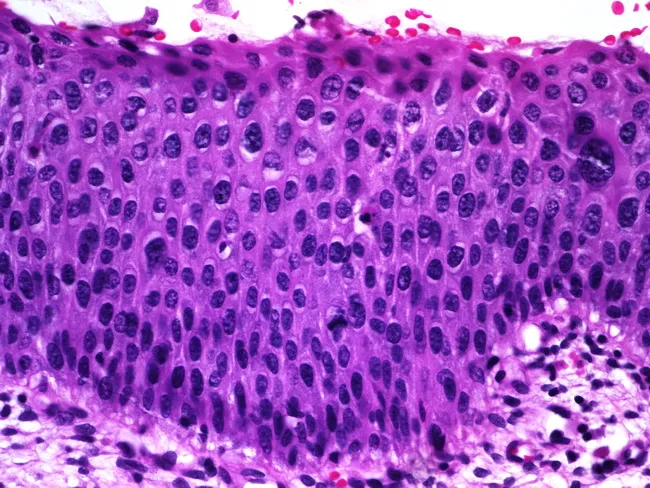
Histology image of mucosal epithelium showing features of squamous epithelial dysplasia on light microscopy. Prepared as a paraffin-embedded hematoxylin and eosin (H&E) stained section and viewed under brightfield microscopy at high magnification (~400x). The epithelium is stratified, with orderly basal cell layer but marked nuclear atypia throughout the lower and mid portions. Nuclear enlargement and hyperchromasia are evident, along with variation in nuclear size (anisokaryosis) and coarse, clumped chromatin. There is partial maturation at the superficial aspect, with surface layer showing more differentiated cells, suggesting some preserved maturation toward the lumen. Occasional mitotic figures are observed in the lower half of the epithelium, indicative of increased proliferative activity. Overall architecture reveals thickened epithelium (acanthosis) with preserved polarity in some cells but dysplastic changes in others. No invasion is evident in this field, though the mitotic activity and cytologic atypia raise concern for preinvasive squamous intraepithelial lesion. The imaging is relevant for diagnosis of epithelial dysplasia or squamous intraepithelial lesion and has clinical significance for risk stratification, biopsy correlation, and surveillance. Potential clinical applications include screening for precancerous lesions in mucosal surfaces, monitoring response to therapy, and educational demonstration of dysplastic cytology for medical students and residents.
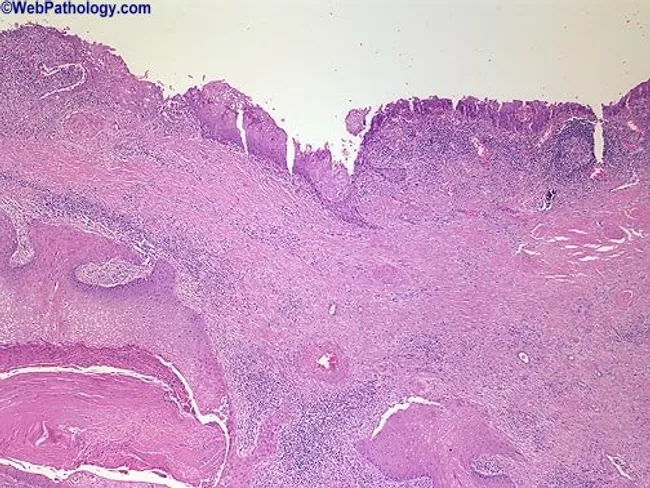
Renal pelvis histology obtained from a urinary tract lesion was imaged using light microscopy on an H&E-stained section. The specimen comprises renal pelvis mucosa lined by urothelium transformed by squamous metaplasia. The surface epithelium is thickened and organized into broad tongues of stratified squamous cells projecting into the underlying lamina propria. The metaplastic epithelium shows typical squamous differentiation with eosinophilic cytoplasm and intercellular bridges; underlying stroma displays mild chronic inflammatory infiltrate. In some areas the squamous epithelium invades the subepithelial tissue, consistent with early invasion rather than a purely reactive change. Normal urothelial architecture is disrupted; transitional epithelium is not intact over the superficial surface. The image highlights a pathologic sequence in which chronic irritation from calculi and infection fosters squamous metaplasia and raises the clinical suspicion for subsequent squamous cell carcinoma of the renal pelvis. Clinically, this pattern is associated with long-standing nephrolithiasis and potential for malignant transformation, particularly in kidneys with anomalous anatomy such as horseshoe kidney. The visualization emphasizes the need for thorough sampling to exclude invasive carcinoma and to guide management, which may include radical nephroureterectomy or targeted therapy depending on invasion depth and staging. This image thus serves educational and diagnostic utility in urologic oncology, nephrology, and surgical pathology.
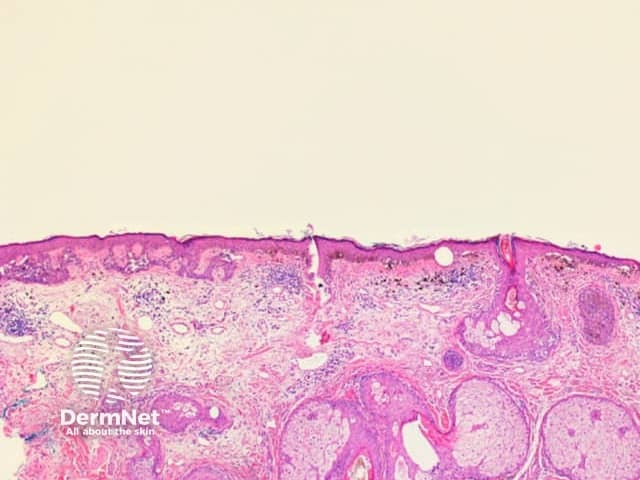
This is a light-microscopy histology image of human skin obtained from a skin biopsy. The section presents a cross-sectional view through the epidermis and dermis, highlighting classic skin architecture suitable for educational comparison. The epidermis shows stratified squamous epithelium with orderly keratinocyte maturation and a clearly visible keratin layer at the surface (stratum corneum). The epidermal-dermal junction appears intact. In the underlying dermis, dense collagenous connective tissue is intermingled with looser fibrous stroma, and adnexal elements such as hair follicles, sebaceous glands, and eccrine glands may be present depending on the field illuminated by the section. Hematoxylin provides purple nuclear detail, while eosin stains the cytoplasm and extracellular matrix pink, creating the familiar purple-pink contrast that delineates structures. No obvious atypia, dysplasia, or malignant invasion is discernible in this field, though assessment is limited to a single plane and context is clinical. The image serves as a reference for normal or near-normal skin histology and can assist in recognizing deviations arising from inflammatory dermatoses, hyperplasia, keratinization disorders, or benign adnexal lesions when correlated with patient history and additional levels. It is relevant for dermatology training, histopathology practice, and educational case discussions.
compact bone osteon Haversian canal histology cross section
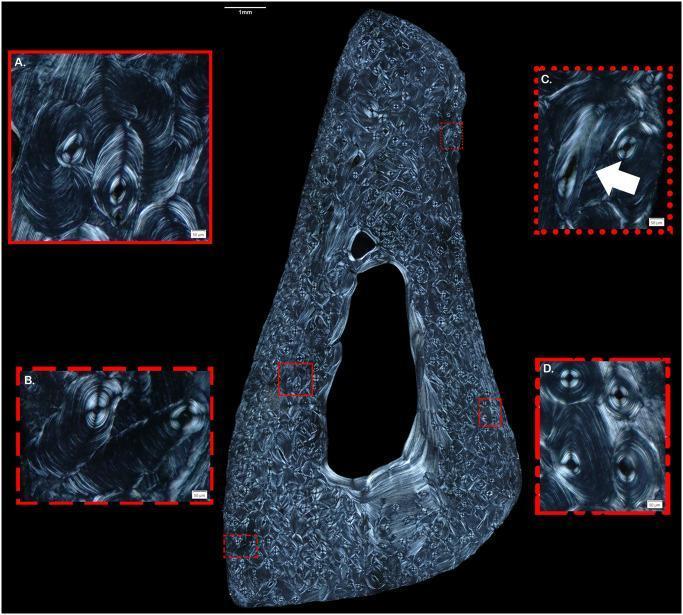
This diagnostic image displays a polarized light microscopic thin section of a human male fibula, focusing on cortical bone microarchitecture and osteon morphotypes. The central large-scale image shows a transverse cross-section of the fibula with a distinct medullary cavity. Four high-magnification insets (A-D) illustrate specific histological features. Inset A and B demonstrate drifting osteons (DOs), characterized by a trailing hemicyclical tail of lamellae behind the Haversian canal, following irregular or linear pathways. Inset C uses an arrow to identify an oblique osteonal canal, highlighting a common visual confounder that can mimic drifting morphology due to the angle of the cut. Inset D displays typical secondary osteons with characteristic concentric lamellae and centrally located Haversian canals. This material is used in forensic anthropology and bone histology to study skeletal remodeling, aging, and taxonomic differentiation, specifically demonstrating how specialized osteon structures like DOs can assist in identifying human bone fragments based on remodeling rates and cortical area analysis.
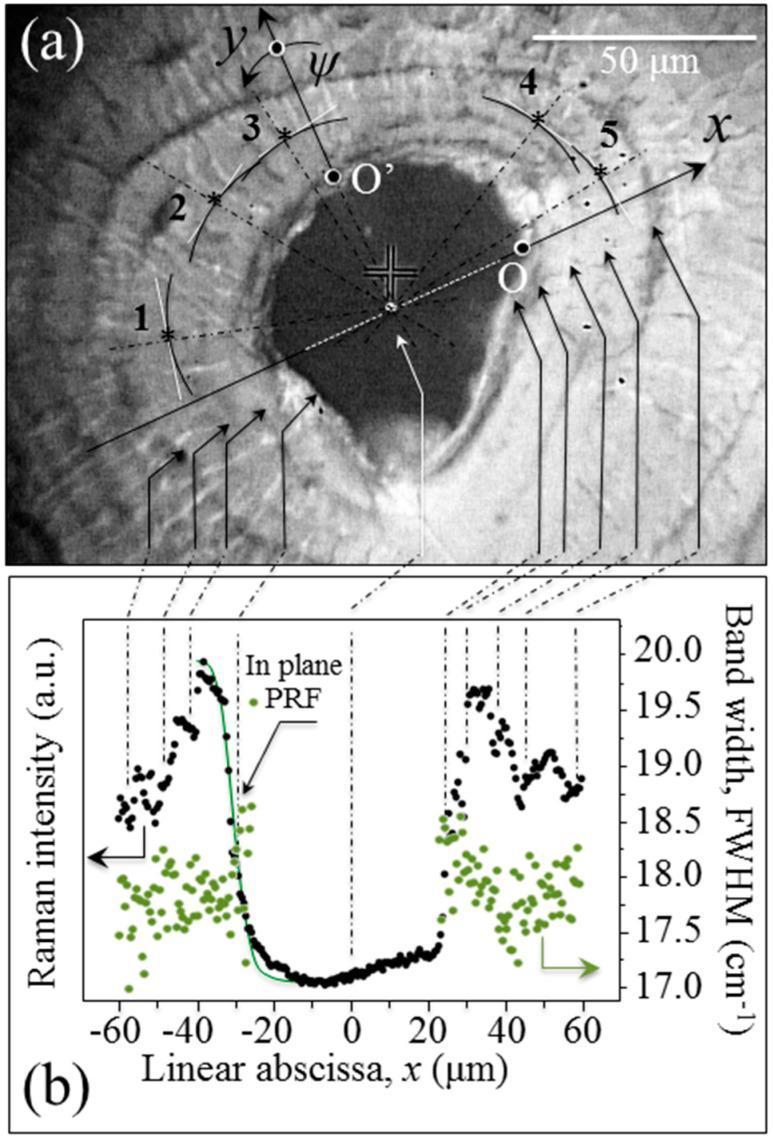
This dual-panel figure illustrates a microstructural and spectroscopic analysis of human cortical bone tissue, specifically focusing on an osteon. Panel (a) is an optical micrograph showing a cross-section of a human proximal femur. The image features a central, dark Haversian canal surrounded by concentric osteonal lamellae. Five specific measurement locations (labeled 1–5) are marked with asterisks and connected by dashed radial lines to the canal center. A laboratory coordinate system (x, y axes and angle ψ) is overlaid to define the orientation of hydroxyapatite crystals. A 50 μm scale bar is provided. Panel (b) is a Raman spectroscopy plot corresponding to a line scan across the osteon. It maps Raman intensity (black dots, arbitrary units) and band width/FWHM (green dots, cm⁻¹) against the linear position (x, μm). The plot shows a characteristic drop in Raman intensity and an increase in FWHM as the probe approaches the Haversian canal (x=0). A green Gaussian curve represents the 'In plane PRF' (probe response function), used to determine the spatial resolution of the laser probe (~2.8 μm).
kidney cortex glomerulus histology microscopy labeled
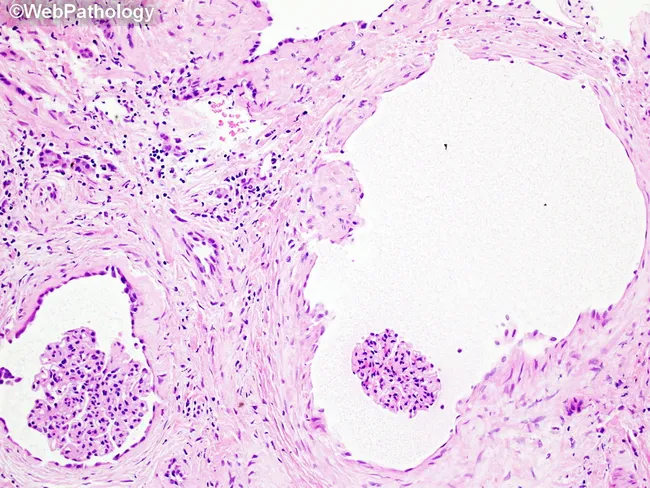
Renal histopathology slide imaged under light microscopy after Hematoxylin and Eosin staining. The primary subject is human kidney cortex tissue displaying a glomerulus and adjacent renal tubules. The specimen type is a renal biopsy. The orientation appears as a transverse section with a glomerular tuft in the left-lower quadrant and tubular profiles dispersed through the interstitium; a large luminal space on the right is a ductule or artifact. The glomerulus contains densely packed nuclei and mesangial regions; capillary loops are variably visible. Interstitial stroma shows mild cellularity without confluent inflammatory infiltrate. Overall architecture is preserved with no overt necrosis, crescents, or significant sclerosis evident at this magnification. The stain highlights nuclei in deep purple and extracellular matrix in pink, with clear delineation between glomerular structures, tubules, and interstitium. Clinically, such a field could serve as baseline for diagnosing glomerular diseases, evaluating tubular integrity, and assessing nephron units in nephritis workups. Potential diagnostic considerations include primary glomerular disease, reactive changes, or incidental normal renal histology depending on clinical context. This image is educational for pathology residents and medical students to recognize basic renal microanatomy and H&E contrast characteristics. This representation supports familiarity with renal histology, including glomeruli, tubules, and vessels architecture
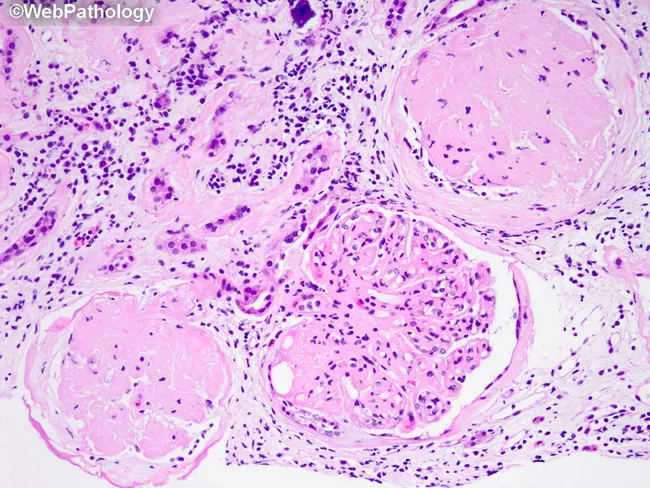
Renal biopsy histology, light microscopy, hematoxylin and eosin stained. Cortex of the kidney showing glomeruli with advanced sclerosis. Two glomeruli are almost completely globally sclerotic, with obliteration of capillary tufts and collapse of the tuft; the third glomerulus demonstrates segmental sclerosis affecting part of the tuft. The tubular compartment shows thickening of the tubular basement membranes, a hallmark of chronic diabetic nephropathy with progressive glomerular basement membrane alterations. The interstitium contains sparse chronic inflammatory infiltrate, composed of mononuclear cells, consistent with chronic tubulointerstitial nephritis accompanying diabetic kidney disease. Overall, there is reduced viable glomerular mass with a pattern of diabetic microvascular injury. The morphological constellation aligns with long-standing hyperglycemia causing mesangial expansion and hyaline arteriolosclerosis; however, nodular mesangial sclerosis (Kimmelstiel-Wilson nodules) is not clearly described in this field. The diagnostic significance lies in confirming diabetic nephropathy with advanced sclerosis, correlating with decreased GFR and proteinuria. This histologic pattern suggests poor renal prognosis and is commonly observed in patients with prolonged diabetes. Clinically, this image is relevant for nephrology, pathology, and medical education, illustrating end-stage renal manifestations of diabetes and guiding therapeutic decisions such as renin-angiotensin system blockade and glycemic optimization. Potential differential diagnoses include hypertensive nephrosclerosis and focal segmental glomerulosclerosis in the appropriate clinical context.
testis histology seminiferous tubule spermatogenesis labeled
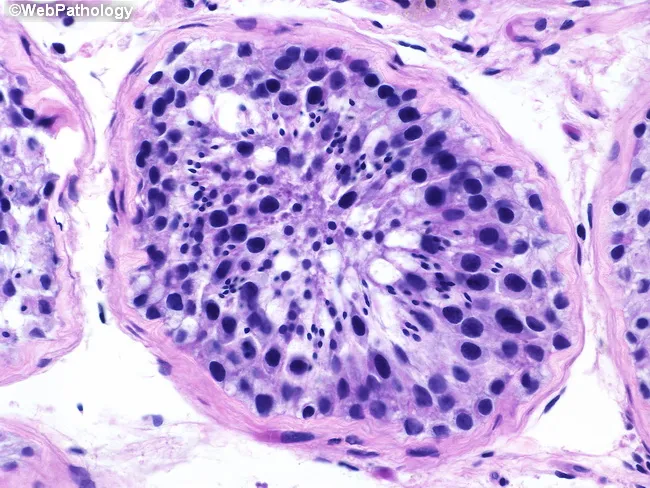
Histology, Testis, Seminiferous tubule, Hematoxylin and Eosin stain, Brightfield microscopy; Cross-sectional view of a seminiferous tubule demonstrates orderly spermatogenesis with a basal germ cell compartment containing spermatogonia, progressing through primary and secondary spermatocytes, round and elongated spermatids, to mature spermatozoa in the tubule lumen. The germinal epithelium exhibits a concentric arrangement along the basement membrane with Sertoli cells interspersed, providing nourishment and structural support. Notable features include intact basement membrane, high cellular density, and a full spectrum of germ cell stages, indicating active spermatogenic activity and normal testicular histology. Pathology domain features: tissue architecture; cellular morphology; luminal maturation; presence of multiple germ cell types at defined maturation stages. Diagnostic significance lies in confirming fertility potential and serving as a baseline for infertility workups or post-therapy monitoring. Differential considerations include maturation arrest and Sertoli cell-only patterns if germ cells are absent or arrested. Clinically relevant for urology, andrology, reproductive endocrinology, and pathology education; suitable for radiology-pathology correlation, histology textbooks, and medical education.
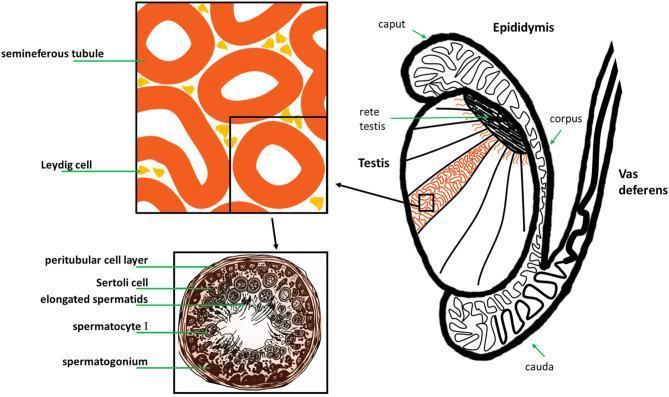
This medical illustration depicts the gross anatomy and histology of the human male reproductive system, specifically the testis and its associated ducts. The main diagram shows a sagittal-like section of the testis, highlighting internal lobules containing seminiferous tubules that converge at the rete testis. The epididymis is shown as a coiled ductal system attached to the posterior testis, divided into the caput (head), corpus (body), and cauda (tail), which then continues as the vas deferens. A magnified histological inset focuses on the interstitial space, showing Leydig cells clustered between cross-sections of seminiferous tubules. A second, high-magnification cross-section of a single seminiferous tubule illustrates the stages of spermatogenesis. Labeled structures include the peritubular cell layer (basal lamina), Sertoli cells for structural support, and germ cells in various stages of maturation: spermatogonia at the periphery, followed by spermatocytes I, and elongated spermatids positioned near the central lumen. This diagram serves as an educational tool for understanding the relationship between macroscopic anatomy and microscopic gametogenesis.
liver hepatocytes central vein portal triad histology H&E
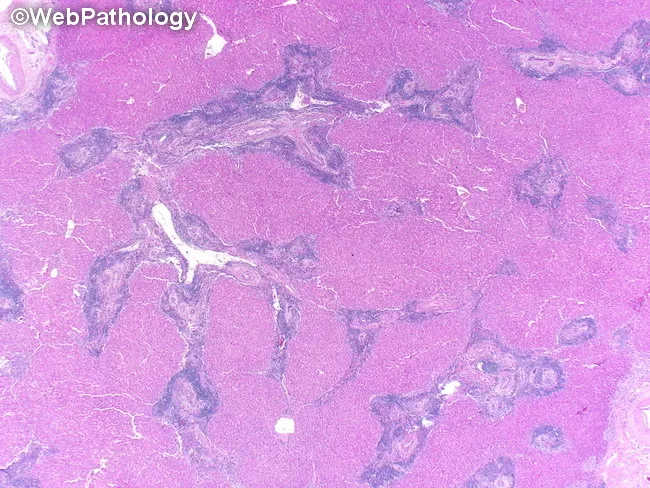
Brightfield light microscopy of a liver biopsy stained with hematoxylin and eosin (H&E). The specimen shows hepatic parenchyma with cords of polygonal hepatocytes separated by sinusoidal capillaries and occasional central veins. The overall lobular architecture appears preserved, with uniform cytoplasmic eosinophilia and round, centrally located nuclei. Portal tracts are not clearly delineated within this low magnification field, but no marked interface activity or interface hepatitis is visible. There is no appreciable steatosis, hepatocellular ballooning, necrosis, or inflammatory infiltrate evident at this magnification. Fibrous septa or cirrhotic nodules are not observed. The tissue appears well preserved with minimal artifact from sectioning. Overall, the histology is compatible with benign hepatic parenchyma in a non-diseased state at this plane of view. This image serves as a reference for normal hepatic architecture and cellular morphology, useful in educational comparisons with diseased liver specimens. Potential clinical applications include baseline histology evaluation, quality control in biopsy processing, and teaching scenarios illustrating hepatocyte cords, sinusoidal arrangement, central veins, and portal areas. Relevant keywords: liver biopsy, hepatic lobule, hepatocytes, sinusoids, central vein, portal tract, H&E, brightfield, normal liver.
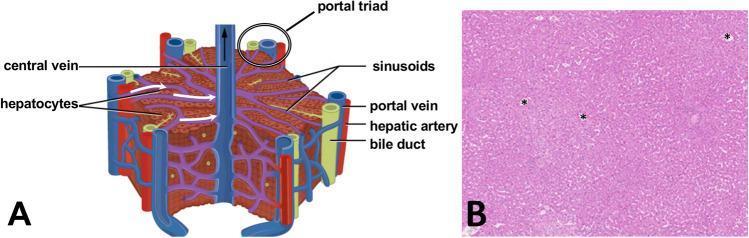
This educational image combines a schematic diagram (A) and a light microscopy photograph (B) illustrating human liver microanatomy. Part A is an anatomical diagram of a typical hepatic lobule, demonstrating its hexagonal structure. Key labeled components include the central vein at the lobule's core and the portal triad at the vertices, which consists of a hepatic artery, portal vein, and bile duct. It shows hepatocytes arranged in cords radiating toward the central vein, interspersed with sinusoids that facilitate fluid transport. Part B is a diagnostic histology image of human liver tissue stained with hematoxylin and eosin (H&E). The parenchyma is visible as a dense arrangement of pink-stained hepatic cords and clear, white-appearing sinusoids. Several central veins are marked with asterisks (*). The image provides a side-by-side comparison between the idealized anatomical model and actual clinical histology, suitable for medical students learning hepatology and tissue architecture.
skin layers epidermis dermis histology microscopy
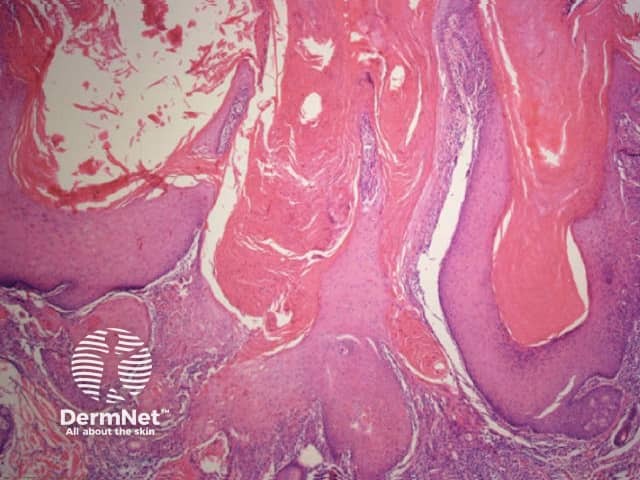
Histology image of human skin stained with Hematoxylin and Eosin (H&E) captured under light microscopy. The specimen presents a vertical cross‑section through cutaneous tissue, highlighting the epidermis overlying the dermis and extending into subcutaneous elements. The epidermal layers appear as a layered, basophilic stratum basale and strata spinosum and granulosum transitioning to a more eosinophilic stratum corneum; the dermoepidermal junction is visible as a wavy interface. The superficial dermis shows dense collagen fibers with a network of blood vessels and occasionally hair follicle–associated structures. Overall architecture resembles normal skin histology without evident dysplasia, neoplastic proliferation, or pronounced inflammatory infiltrate. The staining accentuates nuclei in blue (hematoxylin) and cytoplasmic and extracellular components in pink (eosin). This image is valuable as a reference for dermatopathology education, enabling learners to identify epidermal stratification, dermal connective tissue, adnexal structures, and the typical architecture of healthy skin. Clinically, it supports differential diagnosis consideration in cases of dermatitis, epidermal disorders, and cutaneous tumors by providing a baseline for comparison. It is suitable for medical students, residents, and researchers studying histology, dermatology, and pathology. This image also facilitates recognition of anatomical landmarks such as the epidermal-dermal junction and dermal papillae, supporting examination preparation and image-based teaching for residents and students.
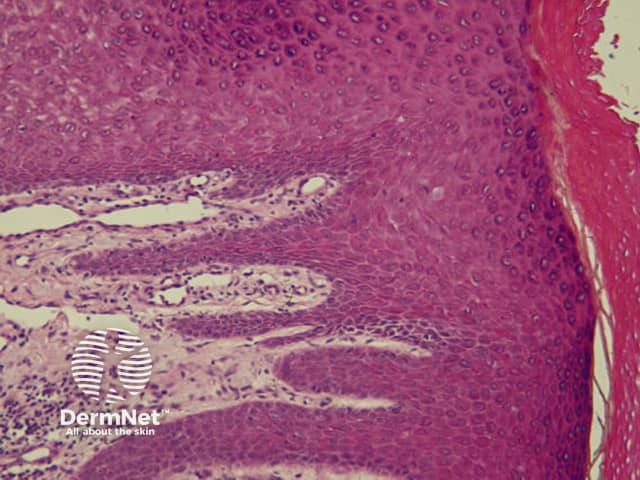
This high-resolution bright-field light microscopy image shows a hematoxylin and eosin (H&E) stained paraffin-embedded skin biopsy, mounted as a vertical histologic section. The image captures the epidermis overlying a cellular dermis with abundant connective tissue. The epidermal layers are well delineated, with a basally located layer of cuboidal to columnar keratinocytes, followed by polygonal cells of the spinous (prickle cell) layer and an eosinophilic granular layer transitioning to the anucleated keratinocytes of the stratum corneum toward the surface. Rete ridges extend into the underlying dermis, creating interlocking shelves that contribute to dermal-epidermal adhesion. The papillary dermis appears mildly vascularized with fine collagen fibrils and scattered elongated dermal papillae; the reticular dermis shows a denser fibrous matrix. No conspicuous inflammatory infiltrate, necrosis, or dysplastic cellular changes are evident within the imaged field. The specimen provides a foundational view of normal cutaneous histology ideal for educational comparison with dermatopathology specimens representing inflammatory, pigmented, infectious, or neoplastic processes. This image is useful for teaching anatomy of the epidermis and dermis, layering relationships between keratinocytes and connective tissue, and for illustrating standard histologic references in dermatology, pathology, and medical education.
spinal cord grey white matter histology cross section
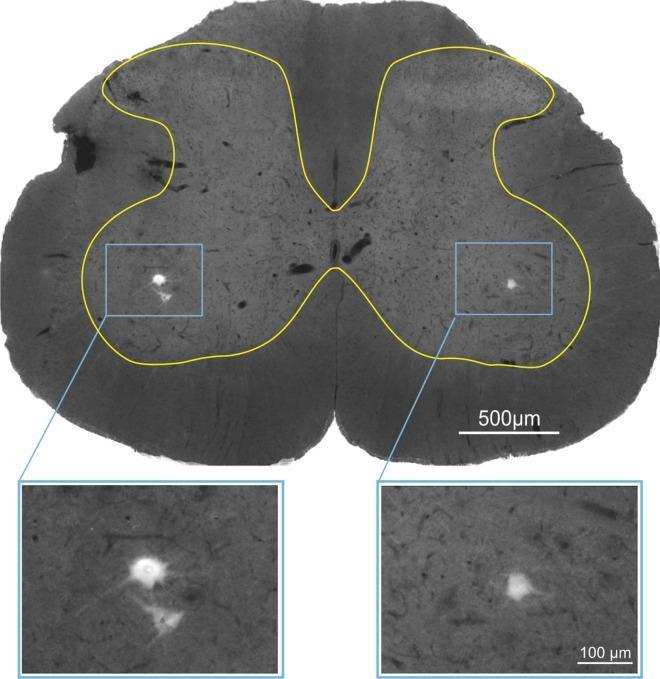
This diagnostic image shows a cross-sectional view of the L5 spinal cord segment, typical for neuroanatomical research. The section displays the characteristic butterfly-shaped central grey matter, demarcated by a yellow border, surrounded by peripheral white matter. The image demonstrates retrograde tracing of alpha-motoneurons (α-MNs) using True Blue fluorescence tracer, which was injected into the lateral gastrocnemius (LG) muscle. Two blue rectangular frames in the ventral horns highlight the bilateral distribution of labeled motoneurons. Below the main section, magnified inset views (100 µm scale) reveal the detailed morphology of these motoneurons, characterized by bright, fluorescent somata against a dark background, showing irregular polygonal shapes and emerging cellular processes. These α-motoneurons are essential components of the lower motor neuron system, and their visualization allows for the study of synaptic connectivity, such as glutamatergic VGLUT1 and cholinergic VAChT terminal density. The main section includes a 500 µm scale bar for anatomical orientation. This material is designed for advanced neuroanatomy and physiology education, focusing on spinal cord circuitry and motor unit innervation.
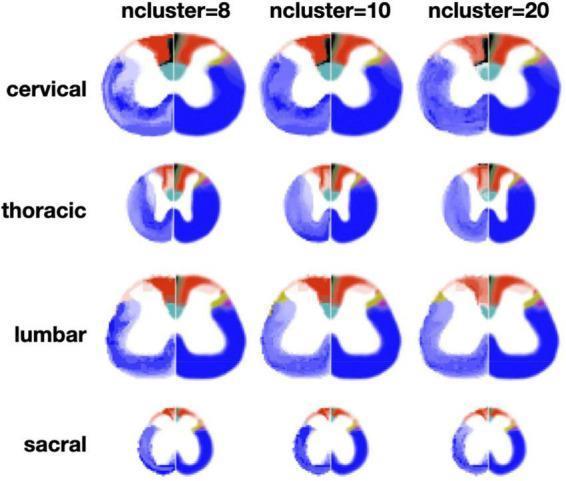
This Comparison Chart illustrates the results of region-wise automated clustering of spinal cord white matter across different levels and parcellation densities. The image is organized into a 4x3 matrix: the vertical axis represents anatomical regions (cervical, thoracic, lumbar, and sacral), while the horizontal axis indicates the number of clusters (n=8, 10, and 20). Each spinal cord cross-section is split into two halves: the left hemi-section shows data-driven clustering results color-coded to represent distinct white matter tracts based on morphometric signatures (e.g., axon density, diameter, and myelin thickness), while the right hemi-section shows the corresponding Watson atlas for reference. Notable features include the consistent delineation of the cuneate fasciculus (red) and dorsal corticospinal tract (cyan) across multiple levels. The cervical and lumbar sections show a larger cross-sectional area and more complex clustering patterns than the thoracic and sacral regions. Increasing the cluster count from 8 to 20 provides finer parcellation and reveals smaller tracts, though some regions (like the sacral level) appear noisier. This visual demonstrates the application of quantitative MRI/histology-based algorithms for neuroanatomical mapping and tractography.
Highly Asked Histology Diagrams - MBBS Anatomy (KNRUHS Pattern)
Histology comes under Anatomy Paper I at KNRUHS. Diagram identification (spot diagrams) and labeled drawings are asked in both theory and practicals.
⭐ TIER 1 - Most Frequently Asked (Must Know)
1. Skin (T.S. of Skin)
2. Testis (T.S. of Testis)
3. Liver (T.S. of Liver)
4. Compact Bone (T.S. of Compact Bone)
5. Kidney (T.S. of Kidney Cortex)
⭐ TIER 2 - Frequently Asked
6. Hyaline Cartilage
7. Epithelium Types
- Stratified squamous epithelium (keratinized & non-keratinized)
- Simple columnar epithelium (with goblet cells)
- Transitional epithelium (urothelium - umbrella cells)
- Pseudostratified columnar epithelium
8. Lymph Node
9. Spleen
10. Thyroid Gland
⭐ TIER 3 - Moderately Asked
| Diagram | Key Labels to Know |
|---|---|
| Trachea (T.S.) | Pseudostratified ciliated epithelium, goblet cells, C-shaped cartilage, glands |
| Ovary | Primary/secondary/Graafian follicles, corpus luteum, corpus albicans, stroma |
| Oesophagus (T.S.) | Stratified squamous epithelium, muscularis mucosae, adventitia |
| Small Intestine (jejunum) | Villi, microvilli (brush border), crypts of Lieberkühn, Paneth cells, goblet cells |
| Suprarenal (Adrenal) Gland | Capsule, cortex (zona glomerulosa, fasciculata, reticularis), medulla |
| Cerebellum (T.S.) | Molecular layer, Purkinje cell layer, granular layer, arbor vitae |
| Spinal Cord (T.S.) | Grey matter (H-shaped), dorsal horn, ventral horn, white matter funiculi |
| Thymus | Cortex (dark), medulla (pale), Hassall's corpuscles, lobules, trabeculae |
| Parotid Gland | Serous acini, striated ducts, capsule, interlobular septa |
| Submandibular Gland | Mixed acini (serous demilunes on mucous), striated ducts |
| Blood Smear (Peripheral) | RBC, neutrophil, eosinophil, basophil, lymphocyte, monocyte, platelets |
| Elastic Cartilage | Elastic fibers in matrix, perichondrium, chondrocytes in lacunae |
| Fibrocartilage | Dense parallel collagen bundles, chondrocytes in rows, no perichondrium |
Practical Exam Tips for Histology Spotting (KNRUHS)
| Organ | Fastest Identification Clue |
|---|---|
| Liver | Central vein surrounded by hepatocyte cords radiating outward |
| Testis | Circular tubules with multiple germ cell layers, Leydig cells in interstitium |
| Skin | 5 epidermal layers + dermis, hair follicles at angles |
| Compact bone | Concentric rings (lamellae) around central canal = osteon |
| Kidney | Glomeruli (round tufts inside Bowman's capsule) |
| Thyroid | Round follicles filled with pink colloid |
| Spleen | White pulp nodules in red background |
| Lymph node | Follicles with germinal centers, subcapsular sinus |
| Cerebellum | Three distinct layers with flask-shaped Purkinje cells in middle |
| Adrenal gland | Outer cortex (3 zones) + inner medulla |
Note on KNRUHS Practical Pattern: In practical exams, you are shown a microscopy slide and asked to (1) identify the organ/tissue, (2) give 4-6 labeled features, and (3) write 2-3 applied/clinical points. Always mention the stain used (usually H&E) and the magnification level in your answer.