
Lipid profile biochemistry
Reading File
Now let me search the medical library for lipid profile biochemistry content, running parallel searches across headings and paragraphs.
Finding Sources
Finding Sources
Finding Sources
Excellent sources found. Let me read the key sections in parallel - the Tietz lab medicine lipid profile section, Lippincott biochemistry chapter, and Harrison's HDL metabolism.
Finding Sources
Reading File
Reading File
Great content. Let me now read more of the Tietz textbook for lipoprotein classes and the Lippincott section for cholesterol synthesis, and also get the Henry's lab medicine section for lipid testing reference ranges.
Reading File
Reading File
Finding Sources
Now let me fetch key images and get the reference ranges / clinical interpretation section from Henry's lab medicine.
Reading File
Reading File
Loading Image
Excellent content gathered. Let me now get the Lippincott cholesterol synthesis (HMG-CoA reductase pathway) and the clinical reference values / Friedewald equation sections.
Reading File
Reading File
I now have comprehensive material to write a thorough answer. Let me also fetch the cholesterol synthesis diagram.
Loading Image
Searching PubMed
lipid profile cardiovascular risk assessment
I now have rich content from multiple authoritative sources. Let me compile a comprehensive answer.
Lipid Profile - Biochemistry
1. What is a Lipid Profile?
A lipid profile (also called a lipid panel or fasting lipid panel) is a blood test that measures the circulating concentrations of lipids and lipoproteins. The standard panel includes:
- Total cholesterol (TC)
- Triglycerides (TG)
- HDL-cholesterol (HDL-C)
- LDL-cholesterol (LDL-C) - usually calculated
- Non-HDL cholesterol (TC - HDL-C)
- VLDL-cholesterol (derived)
2. Biochemical Components
Cholesterol
Cholesterol is a highly hydrophobic steroid alcohol consisting of four fused hydrocarbon rings (A-D, the steroid nucleus) with an eight-carbon branched hydrocarbon chain at C-17, a hydroxyl group at C-3, and a double bond between C-5 and C-6. Most plasma cholesterol is esterified (fatty acid attached at C-3), making it even more hydrophobic. Because of this, cholesterol must be transported in lipoprotein particles or solubilized by phospholipids.
Functions of cholesterol:
- Structural component of all cell membranes (modulates fluidity)
- Precursor of bile acids (for fat digestion)
- Precursor of steroid hormones (glucocorticoids, mineralocorticoids, sex hormones)
- Precursor of vitamin D
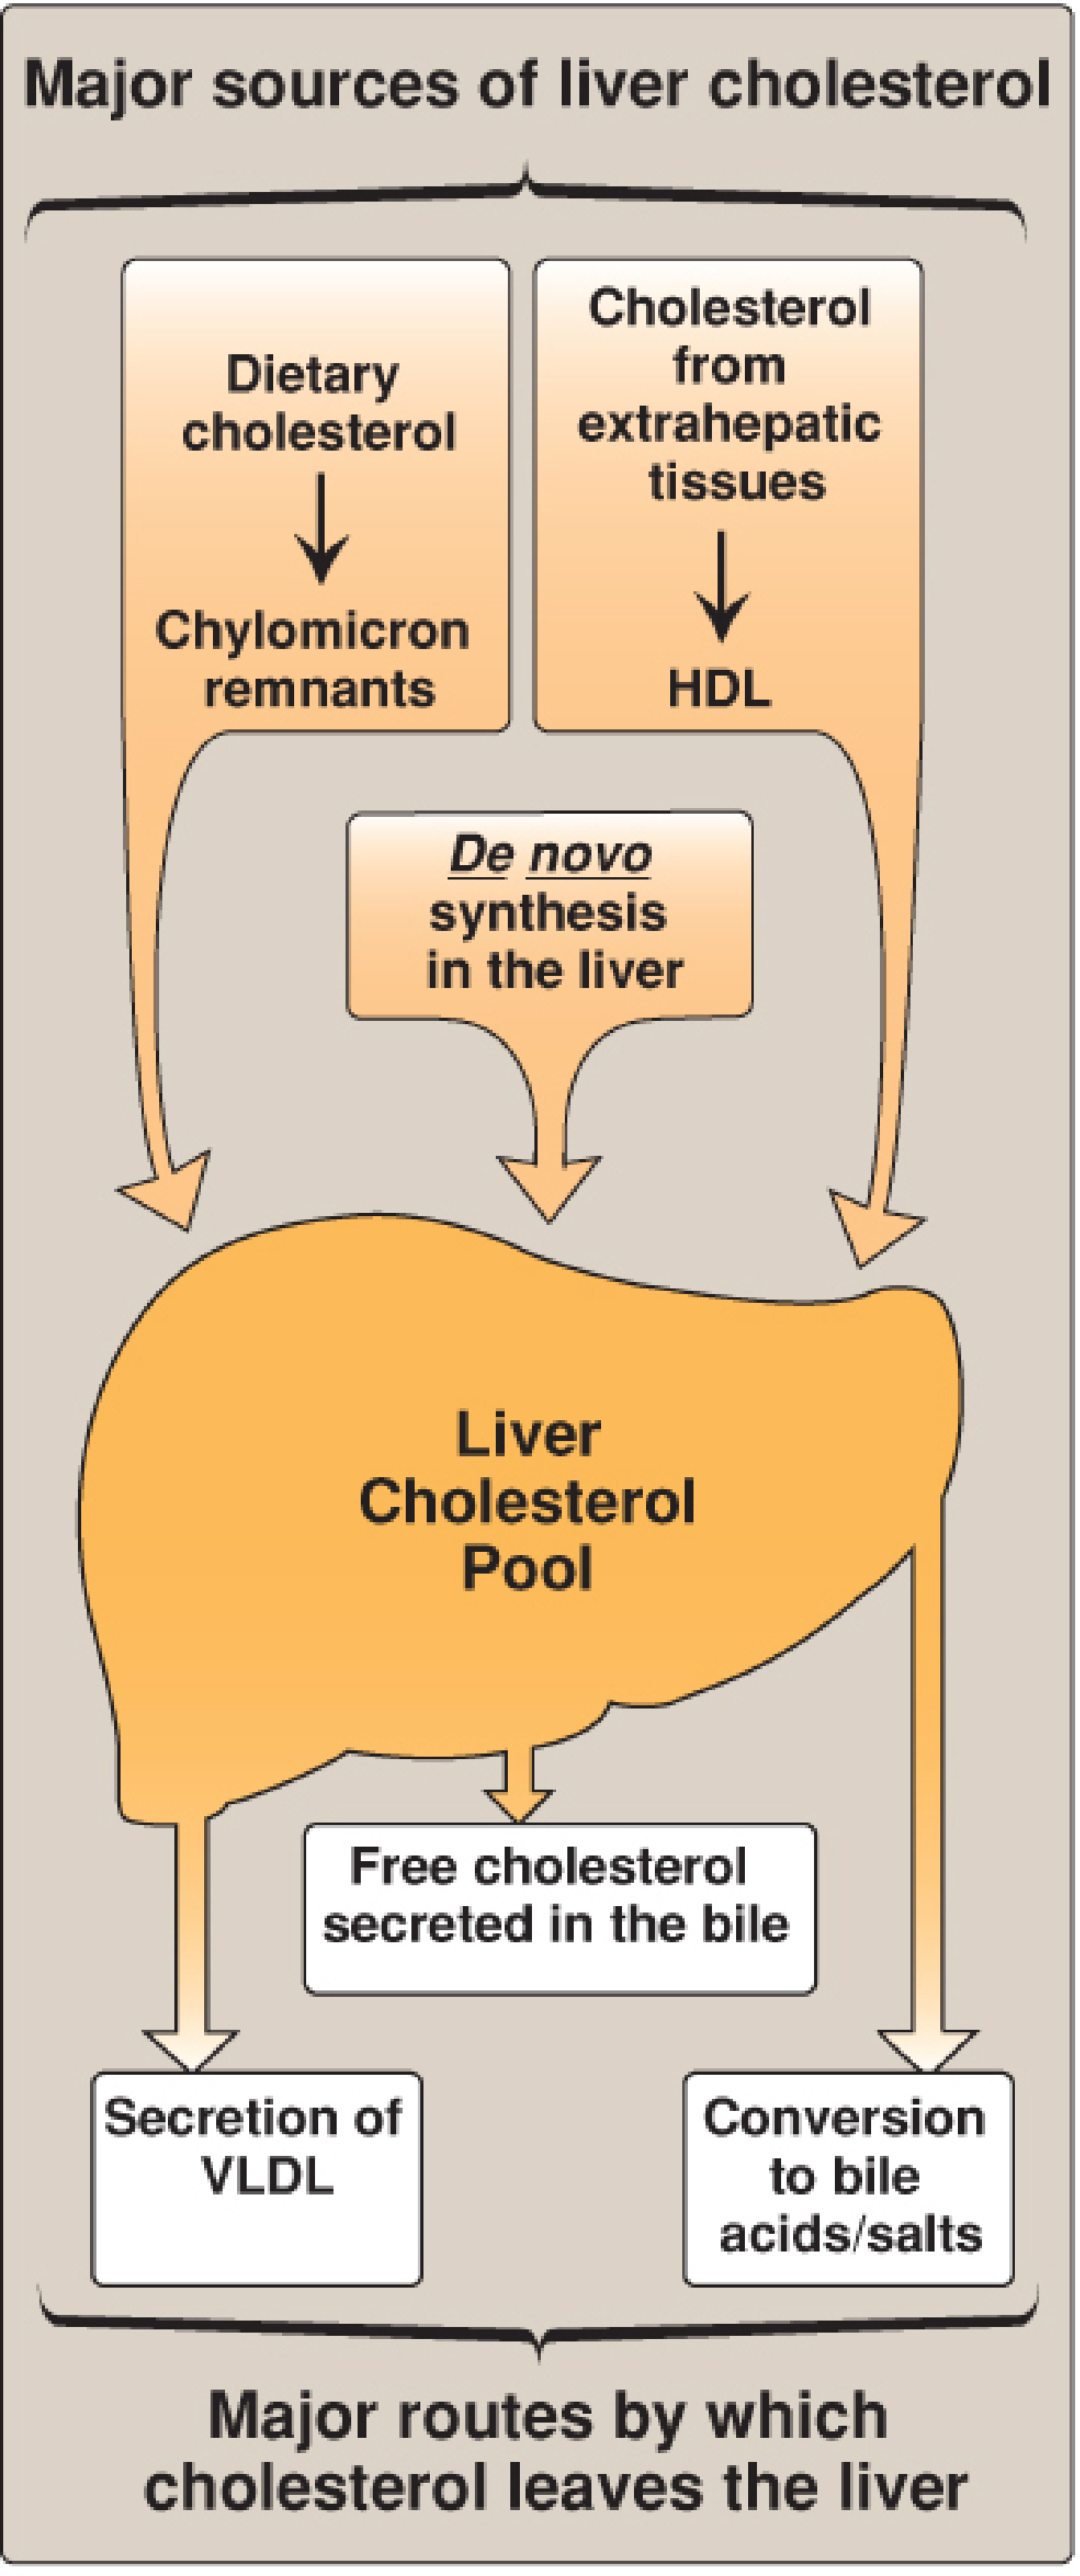
The liver is central to cholesterol homeostasis - Lippincott Illustrated Reviews: Biochemistry, 8th ed.
Cholesterol Synthesis (De Novo)
Synthesized in virtually all tissues, but primarily the liver, intestine, adrenal cortex, and gonads. All carbons come from acetyl-CoA; reducing equivalents from NADPH.
Key steps:
- 2 Acetyl-CoA → Acetoacetyl-CoA (thiolase)
- Acetoacetyl-CoA + Acetyl-CoA → HMG-CoA (HMG-CoA synthase, cytosolic isoform)
- HMG-CoA → Mevalonate - rate-limiting step - catalyzed by HMG-CoA reductase (uses 2 NADPH; irreversible). This is the target of statins.
- Mevalonate → isoprene units → squalene → lanosterol → cholesterol (via ~20 additional steps)
Regulation of HMG-CoA reductase:
- Inhibited by high intracellular cholesterol (SREBP pathway - downregulates transcription)
- Inhibited by statins (competitive inhibitors)
- Activated by insulin; inhibited by glucagon
- Degraded when sterol levels are high
Triglycerides (TG)
Triacylglycerols are esters of glycerol with three fatty acids. They are the primary form of energy storage in adipose tissue and a major energy source for the body. Elevated TG (>150 mg/dL) is associated with metabolic syndrome, pancreatitis risk (at very high levels >500 mg/dL), and cardiovascular risk when TG-rich remnant lipoproteins accumulate.
3. Lipoprotein Structure
Because lipids are insoluble in water, they are packaged into lipoproteins - spherical macromolecular complexes with:
- Hydrophobic core: triglycerides (TG) + cholesteryl esters (CE)
- Amphipathic shell (monolayer): phospholipids + unesterified (free) cholesterol + apolipoproteins
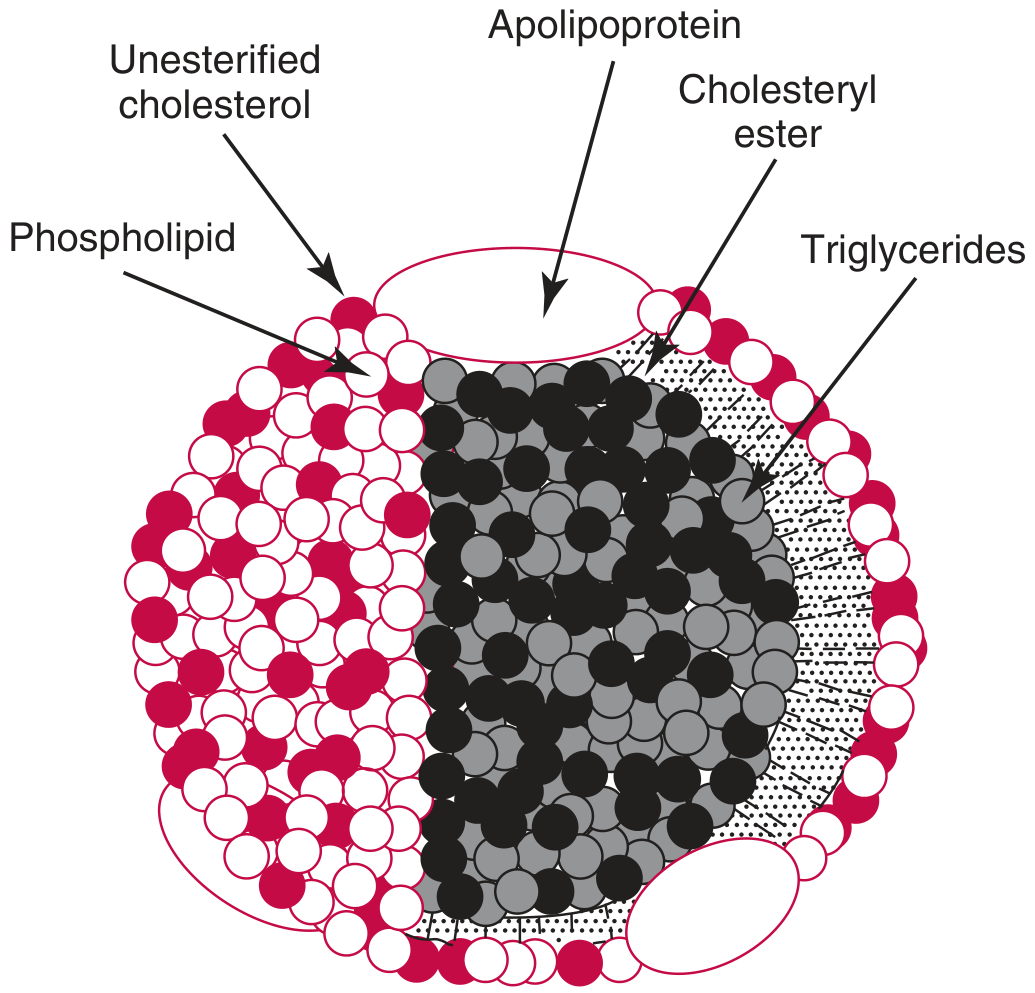
Tietz Textbook of Laboratory Medicine, 7th ed.
The shell is stabilized by hydrogen bonding and van der Waals forces. Cholesteryl ester transfer protein (CETP) exchanges TGs and CEs between lipoproteins. Phospholipid transfer protein (PLTP) transfers phospholipids between lipoproteins.
4. Lipoprotein Classes
Lipoproteins are classified by hydrated density (ultracentrifugation) or electrophoretic mobility. Density increases as lipid content decreases and protein content increases.
| Lipoprotein | Density (g/mL) | Diameter | Major Apolipoproteins | TG (%) | Cholesterol (%) | Main Function |
|---|---|---|---|---|---|---|
| Chylomicrons | <0.95 | 75-1200 nm | ApoB-48, ApoC-II, ApoE | 85-88 | 3-7 | Dietary lipid transport (intestine→tissues) |
| VLDL | 0.95-1.006 | 30-80 nm | ApoB-100, ApoC-II, ApoE | 45-65 | 18-22 | Endogenous TG transport (liver→tissues) |
| IDL | 1.006-1.019 | 25-35 nm | ApoB-100, ApoE | 25-40 | 30-40 | VLDL→LDL intermediate |
| LDL | 1.019-1.063 | 18-25 nm | ApoB-100 | 5-10 | ~50 | Cholesterol delivery to tissues |
| HDL | 1.063-1.21 | 5-12 nm | ApoA-I, ApoA-II | Trace | 18-22 | Reverse cholesterol transport |
| Lp(a) | >1.05 | 26 nm | ApoB-100, Apo(a) | ~5 | ~45 | Independent CVD risk factor |
5. Apolipoprotein Functions
| Apolipoprotein | Location | Function |
|---|---|---|
| ApoA-I | HDL | Activates LCAT; SR-B1 ligand; major structural protein of HDL |
| ApoB-48 | Chylomicrons | Structural; secretion of chylomicrons from intestine |
| ApoB-100 | VLDL, IDL, LDL, Lp(a) | LDL receptor ligand; cannot transfer between particles |
| ApoC-I | VLDL, HDL | Activates LCAT; inhibits CETP, LPL |
| ApoC-II | VLDL, chylomicrons | Activates lipoprotein lipase (LPL) - essential for TG hydrolysis |
| ApoC-III | VLDL, HDL | Inhibits LDL receptor and LRP clearance; stimulates LDL assembly; loss-of-function = lower CVD risk |
| ApoE | VLDL, IDL, HDL | Hepatic clearance ligand for LDL receptor (remnant uptake) |
6. Lipoprotein Metabolism Pathways
Exogenous (Dietary) Pathway
- Dietary fat absorbed in intestine → chylomicrons (with ApoB-48) secreted into lymphatics → thoracic duct → blood
- LPL (activated by ApoC-II) on capillary endothelium hydrolyzes TG → fatty acids taken up by muscle/adipose
- Chylomicron remnants (enriched in ApoE, cholesteryl esters) cleared by liver via LDL receptor-related protein (LRP)
Endogenous Pathway
- Liver secretes VLDL (with ApoB-100, ApoC-II, ApoE) containing endogenous TG
- LPL hydrolyzes VLDL TG → IDL (intermediate density lipoprotein)
- IDL further processed by hepatic lipase (HL) → LDL (cholesterol-enriched, ApoB-100 only)
- LDL taken up by tissues via LDL receptor (LDLR) → receptor-mediated endocytosis → intracellular cholesterol released
- Excess LDL oxidized → taken up by macrophage scavenger receptors → foam cells → atherosclerotic plaques
Reverse Cholesterol Transport (HDL Pathway)
- Nascent HDL (lipid-poor ApoA-I / pre-β HDL) secreted by liver and intestine
- Picks up free cholesterol from peripheral cells via ABCA1 transporter
- LCAT (Lecithin-Cholesterol Acyl Transferase, activated by ApoA-I) esterifies the cholesterol → mature spherical HDL (HDL3 → HDL2)
- Cholesteryl esters transferred to VLDL/LDL via CETP, or directly taken up by liver via SR-B1 receptor
- This pathway constitutes the main anti-atherogenic mechanism of HDL
7. Key Enzymes & Proteins in Lipid Metabolism
| Enzyme/Protein | Function | Clinical Relevance |
|---|---|---|
| HMG-CoA reductase | Rate-limiting step in cholesterol synthesis | Target of statins |
| LPL (Lipoprotein lipase) | Hydrolyzes TG in VLDL/chylomicrons; requires ApoC-II | LPL deficiency → familial hyperchylomicronemia (Type I) |
| LCAT | Esterifies cholesterol on HDL | LCAT deficiency → fish-eye disease |
| CETP | Transfers CE from HDL to VLDL/LDL; exchanges TG | CETP inhibitors raised HDL but failed to reduce CVD in trials |
| LDL receptor (LDLR) | Hepatic/peripheral uptake of LDL (via ApoB-100) | Mutations → familial hypercholesterolemia (FH) |
| PCSK9 | Degrades LDLR → fewer receptors → less LDL clearance | PCSK9 inhibitors (evolocumab, alirocumab) lower LDL markedly |
| Hepatic lipase (HL) | Converts IDL → LDL; remodels HDL | |
| 7-α-Hydroxylase | Rate-limiting step in bile acid synthesis | Upregulated by LXR (high cholesterol); downregulated by FXR (bile acids) |
| Niemann-Pick C1L1 (NPC1L1) | Intestinal cholesterol absorption | Target of ezetimibe |
8. LDL Cholesterol Calculation
Since LDL-C is not measured directly in most labs, it is calculated using the Friedewald equation:
LDL-C = TC - HDL-C - (TG/5) (in mg/dL)
or in mmol/L: LDL-C = TC - HDL-C - (TG/2.2)
- The TG/5 term estimates VLDL-C (assuming TG:VLDL-C ratio of 5:1)
- Not valid when TG >400 mg/dL (ratio assumption breaks down), in Type III dyslipidemia (broad beta disease), or in chylomicronemia
- In such cases, direct LDL-C measurement or the Martin-Hopkins equation (uses variable TG:VLDL ratio based on non-HDL-C and TG) is preferred
9. Reference Ranges and Clinical Interpretation
(Values from NCEP ATP III / AHA guidelines, consistent with Tietz 7th ed.)
Total Cholesterol (mg/dL)
| Category | Value |
|---|---|
| Desirable | <200 |
| Borderline high | 200-239 |
| High | ≥240 |
LDL-Cholesterol (mg/dL)
| Category | Value |
|---|---|
| Optimal | <100 |
| Near optimal | 100-129 |
| Borderline high | 130-159 |
| High | 160-189 |
| Very high | ≥190 |
| Very high risk goal | <70 (or even <55 for very high-risk patients) |
HDL-Cholesterol (mg/dL)
| Category | Value |
|---|---|
| Low (risk factor) | <40 (men), <50 (women) |
| Normal | 40-59 |
| Protective | ≥60 |
Triglycerides (mg/dL)
| Category | Value |
|---|---|
| Normal | <150 |
| Borderline high | 150-199 |
| High | 200-499 |
| Very high (pancreatitis risk) | ≥500 |
Non-HDL Cholesterol
= TC - HDL-C. Represents all atherogenic particles (VLDL, IDL, LDL, Lp(a)).
Goal for high-risk patients: <130 mg/dL (30 mg/dL higher than LDL-C goal)
10. Frederickson-WHO Classification of Dyslipidemias
| Type | Lipoprotein Elevated | Lipid Abnormality | Genetic Cause |
|---|---|---|---|
| I | Chylomicrons | ↑TG, ↑TC | LPL deficiency / ApoC-II deficiency |
| IIa | LDL | ↑TC (TG normal) | Familial hypercholesterolemia (LDLR mutation) |
| IIb | LDL + VLDL | ↑TC + ↑TG | Combined hyperlipidemia |
| III | IDL (β-VLDL) | ↑TC + ↑TG | ApoE2 homozygosity |
| IV | VLDL | ↑TG (TC normal/mildly ↑) | Familial hypertriglyceridemia |
| V | VLDL + Chylomicrons | ↑↑TG | Combined |
11. Pre-Analytical Factors
- Fasting: 9-12 hours required for accurate TG and Friedewald LDL-C (non-fasting OK for TC, HDL-C, non-HDL-C)
- Posture: Cholesterol can be 5-10% higher standing vs. supine (hemoconcentration)
- Drugs: Oral contraceptives ↑TG; thiazides ↑TC+TG; beta-blockers ↓HDL, ↑TG
- Conditions affecting results: Hypothyroidism (↑LDL), nephrotic syndrome (↑LDL), liver disease (abnormal LpX), pregnancy, acute illness (↓TC acutely due to acute phase response)
- Specimen: Serum or EDTA plasma acceptable; avoid prolonged tourniquet; no hemolysis
12. Advanced Lipid Markers
| Marker | Significance |
|---|---|
| ApoB-100 | Counts atherogenic particle number; superior to LDL-C when TG high or small dense LDL present; one ApoB per LDL/VLDL/IDL particle |
| ApoA-I | Surrogate for HDL particle function; some guidelines recommend with ApoB |
| Lp(a) | Independent CVD risk factor; elevated in FH; genetic determinant; not responsive to statins (responds to PCSK9 inhibitors, inclisiran) |
| Small dense LDL | More atherogenic than large LDL; penetrates arterial wall more readily; associated with TG-rich states |
| Non-HDL-C | Better predictor than LDL-C in hypertriglyceridemia; recommended by 2022 guidelines alongside ApoB |
Sources:
- Tietz Textbook of Laboratory Medicine, 7th ed., Chapter 36 (Lipoproteins)
- Lippincott Illustrated Reviews: Biochemistry, 8th ed., Chapter 18 (Cholesterol and Lipoprotein Metabolism)
- Henry's Clinical Diagnosis and Management by Laboratory Methods, Chapter on Lipid Disorders
Recent evidence note: A 2024 network meta-analysis (PMID 39521985) confirms PCSK9 inhibitors and inclisiran as efficacious alternatives to statins+ezetimibe for LDL lowering, consistent with the PCSK9 pathway described above.
Standard lipid profile
Reading File
The standard lipid profile covers Total Cholesterol, LDL-C, HDL-C, Triglycerides, and derived values. Let me pull the most relevant reference ranges, clinical interpretation, and testing methodology from the textbooks.
Searching sources...
Finding Sources
Finding Sources
Finding Sources
Reading File
Reading File
Reading File
Reading File
Reading File
Reading File
Reading File
Finding Sources
Reading File
Finding Sources
I now have enough detailed content from all the key sources to write a focused, well-structured answer on the standard lipid profile.
Standard Lipid Profile
A standard (or routine) lipid profile measures the major circulating lipid fractions used to assess cardiovascular risk and diagnose dyslipidemia. As defined by Tietz 7th ed.: "a standard lipid profile that will identify most hyper- and dyslipidemias should include plasma cholesterol and TG together with LDL-C, HDL-C, and non-HDL-C."
Components of the Standard Panel
| Parameter | How Obtained | Unit |
|---|---|---|
| Total Cholesterol (TC) | Directly measured | mg/dL or mmol/L |
| Triglycerides (TG) | Directly measured | mg/dL or mmol/L |
| HDL-Cholesterol (HDL-C) | Directly measured | mg/dL or mmol/L |
| LDL-Cholesterol (LDL-C) | Calculated (usually) or directly measured | mg/dL or mmol/L |
| VLDL-Cholesterol (VLDL-C) | Estimated (TG ÷ 5) | mg/dL or mmol/L |
| Non-HDL Cholesterol | Calculated: TC - HDL-C | mg/dL or mmol/L |
1. Total Cholesterol (TC)
Method: Enzymatic colorimetric assay - cholesterol esterase cleaves cholesterol esters, cholesterol oxidase oxidizes free cholesterol, and the H₂O₂ produced reacts with a chromogen (Trinder reaction) to give a measurable color.
Reference ranges (NCEP / AHA):
| Category | mg/dL | mmol/L |
|---|---|---|
| Desirable | <200 | <5.18 |
| Borderline high | 200-239 | 5.18-6.19 |
| High | ≥240 | ≥6.22 |
- TC alone is a poor predictor because it includes both atherogenic (LDL) and anti-atherogenic (HDL) fractions
- Always interpreted alongside HDL-C and LDL-C
2. Triglycerides (TG)
Method: Enzymatic - glycerol released by lipase hydrolysis is measured via glycerol kinase and glycerol-3-phosphate oxidase, generating H₂O₂ detected colorimetrically.
Reference ranges:
| Category | mg/dL | mmol/L |
|---|---|---|
| Normal | <150 | <1.70 |
| Borderline high | 150-199 | 1.70-2.25 |
| High | 200-499 | 2.26-5.64 |
| Very high | ≥500 | ≥5.65 |
- Fasting sample required for accurate TG measurement (non-fasting TG can be 20-30% higher after a meal due to postprandial chylomicrons)
- TG >500 mg/dL: risk of acute pancreatitis
- TG >400 mg/dL: Friedewald LDL-C calculation is invalid
3. HDL-Cholesterol (HDL-C)
Method: Homogeneous (direct) enzymatic assays are standard. These use surfactants or antibodies to selectively react with non-HDL lipoproteins, leaving only HDL cholesterol accessible to the cholesterol assay. Older precipitation methods (polyethylene glycol, dextran sulfate-Mg²⁺, phosphotungstic acid-Mg²⁺) sediment non-HDL lipoproteins; cholesterol is then measured in the supernatant.
Reference ranges (NCEP ATP III):
| Category | mg/dL | mmol/L |
|---|---|---|
| Low (independent risk factor) | <40 (men) / <50 (women) | <1.03 / <1.30 |
| Normal | 40-59 | 1.03-1.55 |
| High (protective) | ≥60 | ≥1.55 |
- HDL-C is inversely correlated with cardiovascular risk
- HDL-2 subclass is considered more cardioprotective than HDL-3
- Very high HDL-C (>100 mg/dL) may paradoxically not be protective (dysfunctional HDL, CETP deficiency)
4. LDL-Cholesterol (LDL-C)
A. Friedewald Calculation (most common)
LDL-C = TC − HDL-C − (TG ÷ 5) (mg/dL)LDL-C = TC − HDL-C − (TG ÷ 2.175) (mmol/L)
The TG÷5 term estimates VLDL-C (based on the assumption that VLDL TG:cholesterol ratio = 5:1).
Limitations of Friedewald:
- Not valid when TG >400 mg/dL (ratio assumption breaks down, LDL-C underestimated)
- Not valid if chylomicrons are present (non-fasting sample)
- Not valid in Type III hyperlipidemia / β-VLDL (IDL is wrongly included in "VLDL")
- Not valid in cholestasis (LpX present)
- Accuracy also decreases at very low LDL-C (<70 mg/dL), common in treated patients
B. Martin-Hopkins Equation (improved)
Uses an adjustable TG:VLDL-C factor based on the individual's non-HDL-C and TG levels (lookup table). Accuracy vs. ultracentrifugation: 92% (vs. 85% for Friedewald). Particularly superior for LDL-C <70 mg/dL and in hypertriglyceridemia.
C. Direct (Homogeneous) LDL-C Assay
Specific surfactants or antibodies block non-LDL particles; cholesterol is measured enzymatically in the remaining LDL. Used when TG >400 mg/dL, in non-fasting samples, or post-treatment monitoring at low LDL-C.
Reference ranges (ACC/AHA 2018):
| Category | mg/dL | mmol/L |
|---|---|---|
| Optimal | <100 | <2.59 |
| Near optimal | 100-129 | 2.59-3.34 |
| Borderline high | 130-159 | 3.35-4.12 |
| High | 160-189 | 4.14-4.89 |
| Very high | ≥190 | ≥4.92 |
| Very high-risk goal | <70 | <1.81 |
| Extreme-risk goal (ACS/FH) | <55 | <1.42 |
LDL-C is the primary treatment target for cardiovascular risk reduction.
5. VLDL-Cholesterol (VLDL-C)
Estimated as: VLDL-C = TG ÷ 5 (mg/dL) or TG ÷ 2.175 (mmol/L)
Normal range: 2-30 mg/dL
Elevated VLDL-C indicates overproduction of TG-rich lipoproteins (endogenous hypertriglyceridemia), often seen in metabolic syndrome, diabetes, obesity, and alcohol excess.
6. Non-HDL Cholesterol
Non-HDL-C = TC − HDL-C
This captures cholesterol in all atherogenic particles: VLDL + IDL + LDL + Lp(a). It is particularly useful when TG is elevated (Friedewald becomes unreliable) and is now recommended alongside LDL-C by 2018 ACC/AHA and 2019 ESC/EAS guidelines.
Treatment goals (30 mg/dL higher than LDL-C goal):
| Risk Category | Non-HDL-C Goal |
|---|---|
| High risk | <130 mg/dL |
| Very high risk | <100 mg/dL |
| Extreme risk | <85 mg/dL |
7. Specimen Requirements & Pre-Analytical Considerations
| Factor | Recommendation |
|---|---|
| Fasting | 9-12 hours required for TG and Friedewald LDL-C; non-fasting acceptable for TC, HDL-C, non-HDL-C |
| Specimen | Serum (plain tube) or EDTA plasma; values differ ~3% |
| Posture | Sit for ≥5 min before collection; standing raises cholesterol 5-10% (hemoconcentration) |
| Stability | Stable at 4°C for 4 days; −70°C for longer storage |
| Avoid | Prolonged tourniquet use, hemolysis, lipemic samples |
| Plasma appearance | Creamy top layer = chylomicrons; turbid = elevated VLDL; clear despite elevated LDL or HDL |
Conditions affecting results:
- Hypothyroidism → ↑LDL-C (reduced LDL receptor expression)
- Nephrotic syndrome → ↑LDL-C, ↑TG
- Liver disease → ↓cholesterol synthesis; LpX may form in cholestasis
- Pregnancy → physiological ↑TG, ↑TC, ↑LDL-C (especially 3rd trimester)
- Acute illness → ↓TC acutely (acute phase response)
- Drugs → OCP ↑TG; thiazides ↑TC+TG; beta-blockers ↓HDL-C; statins ↓LDL-C 30-50%
8. Expanded Lipid Profile
The 2018 ACC/AHA and 2019 ESC/EAS guidelines recommend adding the following in selected patients:
| Test | Indication |
|---|---|
| ApoB-100 | Better particle count; preferred when TG high or discordance with LDL-C; 1 molecule per atherogenic particle |
| Lp(a) | Measure once in all adults; major independent risk factor; not reduced by statins |
| ApoA-I | Functional HDL assessment |
| LDL particle number (LDL-P) | Nuclear MR spectroscopy; superior predictor when LDL-C is low |
| hsCRP | Inflammatory risk marker; used in borderline-risk patients (Reynolds/PCE score) |
9. Screening Recommendations
- Adults ≥20 years: Fasting lipid panel every 4-6 years (ACC/AHA); more frequent if risk factors present
- Children: Universal screening at age 9-11 years (AAP); selective screening if family history of premature CVD or FH
- Children with FH: Statin therapy typically initiated at 8-10 years if LDL-C remains high; homozygous FH - begin in the first year of life
10. Treatment Thresholds (Guidelines Summary)
| Guideline | LDL-C Threshold for Treatment |
|---|---|
| US 2018 ACC/AHA | ≥190 mg/dL (primary); most ASCVD (secondary); diabetics; PCE 10-yr risk ≥7.5% |
| Europe 2019 ESC/EAS | ≥190 mg/dL primary; ASCVD with LDL-C ≥55 mg/dL (secondary) |
| Canada 2016 CCS | LDL-C ≥193 mg/dL; most ASCVD; diabetics |
Sources:
- Tietz Textbook of Laboratory Medicine, 7th ed., Chapter 36
- Henry's Clinical Diagnosis and Management by Laboratory Methods, Chapter on Lipid Disorders
- Quick Compendium of Clinical Pathology, 5th ed., Section 1.8
This is a shared conversation. Sign in to Orris to start your own chat.