
CSF formation & circulation, factors affecting ICP. Exam ready easy answer for md anasxthesia exam . withflowcharts and mnemonics and headings . Possible viva questions .
CSF cerebrospinal fluid circulation ventricles flow diagram
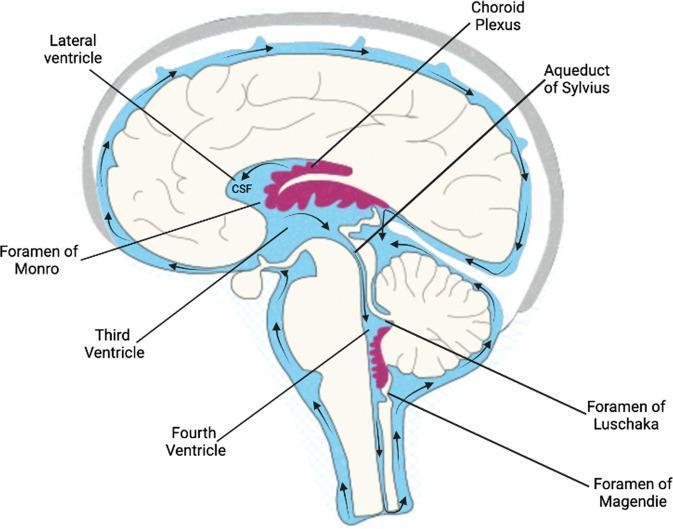
An anatomical diagram in sagittal view illustrating the human ventricular system and the physiological pathway of cerebrospinal fluid (CSF) flow. The diagram depicts the lateral ventricles, containing the choroid plexus (highlighted in pink), where CSF production occurs. Black arrows indicate the unidirectional flow of CSF from the lateral ventricles through the interventricular Foramen of Monro into the third ventricle. The pathway continues through the narrow Aqueduct of Sylvius into the fourth ventricle, located anterior to the cerebellum. From the fourth ventricle, CSF exits the ventricular system through the median Foramen of Magendie and the lateral Foramina of Luschka to enter the subarachnoid space. The diagram further illustrates the circulation of CSF around the external surface of the brain and spinal cord within the subarachnoid space (colored in light blue), showing its eventual movement toward the superior sagittal sinus for reabsorption. Key anatomical labels include the ventricles, foramina, and the brainstem/cerebellar silhouettes.
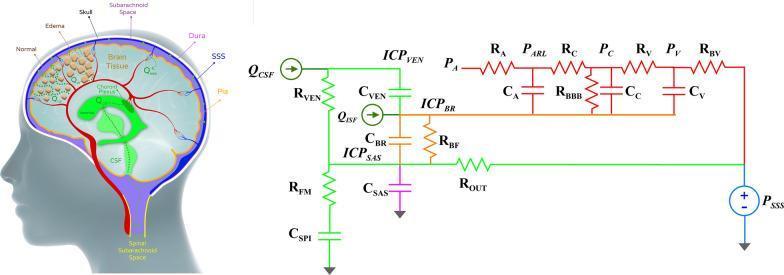
This figure presents a multi-modal educational diagram of intracranial physiology and hydrodynamics, consisting of a structural anatomical model (left) and a corresponding electrical analogue model (right). The anatomical diagram illustrates four major compartments: the brain parenchyma, the ventricular system containing cerebrospinal fluid (CSF), the subarachnoid space (SAS) bounded by the dura and pia mater, and the cerebrovascular circulation. It highlights the production of CSF at the choroid plexus (QCSF), its flow through the ventricles to the SAS, and drainage into the superior sagittal sinus (SSS). It additionally contrasts normal tissue with cerebral edema, showing interstitial fluid (QISF) dynamics. The electrical analogue model translates these physiological processes into a circuit diagram using lumped parameters. Capacitors (C) represent the compliance of various compartments like the brain (CBR), ventricles (CVEN), and vasculature (CA, CC, CV). Resistors (R) represent flow resistances, including the blood-brain barrier (RBBB), ventricular flow (RVEN), and CSF outflow (ROUT). This comparison helps visualize intracranial pressure (ICP) dynamics and the impact of conditions like hydrocephalus or brain injury on fluid shifts between compartments.
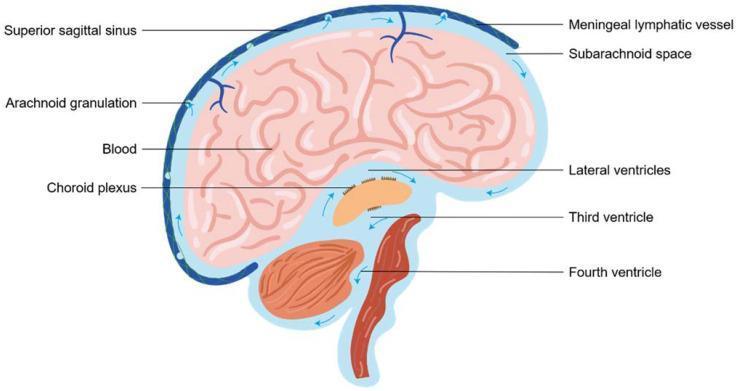
This medical anatomical diagram illustrates the production, circulation, and drainage pathways of cerebrospinal fluid (CSF) in the human brain via a sagittal section view. The illustration highlights the CSF flow starting from the choroid plexus within the lateral, third, and fourth ventricles. Blue arrows indicate the directional movement of fluid into the subarachnoid space (SAS) surrounding the cerebral cortex and cerebellum. Key drainage mechanisms are depicted: the traditional venous pathway where arachnoid granulations protrude into the superior sagittal sinus (containing blood), and the emerging lymphatic pathway via meningeal lymphatic vessels. The diagram provides a comprehensive overview of neuroanatomy and physiology related to intracranial pressure regulation and metabolite clearance, suitable for neuroscience and clinical neurology education.
intracranial pressure volume compliance curve Monro-Kellie
CSF Formation & Circulation + Factors Affecting ICP
MD Anaesthesia Exam - Complete Guide
SECTION 1: CSF - OVERVIEW & QUICK FACTS
| Parameter | Value |
|---|---|
| Total CSF volume | ~150 mL (50 mL spinal, 100 mL cranial) |
| Rate of formation | ~500 mL/day (0.35 mL/min) |
| Rate of absorption | = Rate of formation (steady state) |
| Normal ICP | 5-15 mmHg (adult, supine) |
| CSF turnover | ~4-5 times/day |
SECTION 2: CSF FORMATION
Site of Production
- 70-80% - Choroid plexus (lateral > third > fourth ventricles)
- 20-30% - Ependymal cells, cerebral capillaries, brain parenchyma
Mechanism of Formation
PLASMA  →  Choroid Plexus Epithelium  →  CSF

Step 1: Ultrafiltration of plasma across fenestrated capillaries
        (passive, driven by hydrostatic pressure)

Step 2: Active secretion by choroid plexus epithelial cells
        - Na⁺/K⁺-ATPase pumps Na⁺ into CSF
        - Water follows osmotically
        - Carbonic anhydrase → HCO₃⁻ secretion
        - Cl⁻ actively secreted
Mnemonic: "CHAP" for CSF formation
- C - Choroid plexus (main site)
- H - High Na⁺/K⁺-ATPase activity
- A - Active transport (not simple filtration)
- P - Passive ultrafiltration also contributes
CSF vs. Plasma Composition
| Component | CSF | Plasma |
|---|---|---|
| Na⁺ | 138 mEq/L | 138 mEq/L |
| K⁺ | 2.8 mEq/L | 4.5 mEq/L (CSF lower) |
| Cl⁻ | 119 mEq/L | 102 mEq/L (CSF higher) |
| Glucose | 45-80 mg/dL | 70-110 mg/dL (CSF ~60%) |
| Protein | 15-45 mg/dL | 6000-8000 mg/dL (CSF much lower) |
| pH | 7.33 | 7.40 |
| Pressure | 70-180 mm H₂O | - |
SECTION 3: CSF CIRCULATION FLOWCHART
LATERAL VENTRICLES (choroid plexus - main production site)
        |
        ↓  (via Foramen of Monro)
THIRD VENTRICLE (choroid plexus)
        |
        ↓  (via Aqueduct of Sylvius / Cerebral Aqueduct)
FOURTH VENTRICLE (choroid plexus)
        |
        ↓  (via Foramina of Magendie [median] + Luschka [2 lateral])
SUBARACHNOID SPACE (around brain + spinal cord)
        |
   ┌────┴────┐
   ↓         ↓
Cisterns   Spinal
(basal)    SAC
   |
   ↓  (upward over cerebral convexities)
ARACHNOID GRANULATIONS / VILLI
(protrude into Superior Sagittal Sinus)
        |
        ↓  (bulk flow absorption - pressure-dependent)
VENOUS SINUSES → Systemic Circulation
Mnemonic for Foramina: "M & 2 L"
- Magendie (Median, 1) + Luschka (Lateral, 2)
- "Monro connects Lateral to Third" (MLT)
- "Sylvius connects Third to Fourth" (STF)
SECTION 4: CSF ABSORPTION
- Primary route: Arachnoid granulations (villi) → dural venous sinuses
- Secondary routes:
- Lymphatic vessels along cranial nerves (esp. olfactory nerve - cribriform plate)
- Meningeal lymphatics (recently described - "glymphatic system")
- Mechanism: Passive bulk flow down a pressure gradient
- CSF pressure > Venous sinus pressure → absorption occurs
- Absorption rate increases linearly with ICP
- Minimum pressure for absorption: ~68 mm H₂O
SECTION 5: THE MONRO-KELLIE DOCTRINE
"The skull is a rigid box. Volume of brain + CSF + blood = CONSTANT"
The Three Compartments
┌─────────────────────────────────────┐
│          SKULL (rigid)              │
│  ┌──────────┬──────────┬─────────┐  │
│  │  BRAIN   │   CSF   │  BLOOD  │  │
│  │  (80%)   │  (10%)  │  (10%)  │  │
│  │ ~1400g   │ ~75mL   │ ~75mL   │  │
│  └──────────┴──────────┴─────────┘  │
│                                     │
│  ↑ One compartment = ↓ another      │
└─────────────────────────────────────┘
Compliance Curve (Pressure-Volume)
ICP
↑
|              ← DECOMPENSATED
|            /  (steep rise, small ΔV = big ΔICP)
|           /
|          /
|_________/  ← COMPENSATED
|            (flat, large ΔV = small ΔICP)
└─────────────────→ Volume

Compensation: CSF displaced to spinal sac +
              venous blood displaced extracranially
SECTION 6: NORMAL ICP VALUES
| Population | Normal ICP |
|---|---|
| Adults (supine) | 5-15 mmHg (70-200 mm H₂O) |
| Children | 3-7 mmHg |
| Neonates | 1.5-6 mmHg |
| Raised ICP | > 20 mmHg |
| Severely raised | > 40 mmHg |
SECTION 7: FACTORS AFFECTING ICP
Mnemonic: "BVFC PAC" (Big Volumes Fill Cranium - Pressure Always Climbs)
A. FACTORS INCREASING ICP
- Vasogenic edema (BBB disruption - tumors, abscess, trauma)
- Cytotoxic edema (cell swelling - ischemia, hypoxia)
- Interstitial edema (hydrocephalus)
- Osmotic edema (hyponatremia)
- ↑ PaCO₂ (hypercarbia) → vasodilation → ↑ CBV → ↑ ICP
- Most important acute determinant!
- Each 1 mmHg ↑ PaCO₂ = ~2-4% ↑ CBF
- ↓ PaO₂ (< 60 mmHg) → vasodilation → ↑ CBF → ↑ ICP
- Loss of autoregulation
- Volatile anesthetics (dose-dependent vasodilation)
- Venous obstruction (raised CVP, neck position, PEEP)
- Valsalva maneuver, coughing, straining
- Obstructive hydrocephalus (blocked CSF outflow)
- Communicating hydrocephalus (impaired absorption)
- ↑ CSF production (choroid plexus papilloma - rare)
- Decreased absorption (meningitis, subarachnoid hemorrhage)
- Tumor, hematoma, abscess, edema
B. KEY PHYSIOLOGICAL FACTORS - FLOWCHART
PaCO₂ ↑  ──→  Cerebral vasodilation
                      ↓
               ↑ CBF & CBV
                      ↓
               ↑ ICP
(Range: PaCO₂ 20-80 mmHg has LINEAR effect on CBF)


PaO₂ ↓ <60 mmHg ──→  Vasodilation → ↑ CBF → ↑ ICP
(PaO₂ > 60 mmHg: minimal effect on CBF)


MAP ↑↑ (loss of autoregulation) ──→ ↑ CBF → ↑ ICP
MAP ↓↓ (below autoregulatory range) ──→ ↓ CPP → ischemia
C. CEREBRAL AUTOREGULATION
Normal autoregulation maintains CBF = 50 mL/100g/min
across MAP range of 50-150 mmHg

Below 50 mmHg → CBF falls (pressure-passive)
Above 150 mmHg → CBF rises (breakthrough)

Lost in: head injury, ischemia, volatile agents (>1 MAC)
         hypertension, tumors
SECTION 8: CPP AND ICP RELATIONSHIP
CPP = MAP - ICP

Normal CPP = 70-100 mmHg
Critical CPP = <60 mmHg (ischemia risk)

↑ ICP ──→ ↓ CPP ──→ ↓ CBF ──→ BRAIN ISCHEMIA

Cushing's Triad (late sign of ↑ ICP):
┌────────────────────────────────────────┐
│  1. HYPERTENSION (widened pulse press) │
│  2. BRADYCARDIA                        │
│  3. IRREGULAR RESPIRATION              │
└────────────────────────────────────────┘
Mnemonic: "HBR" = Hypertension, Bradycardia, Respiration
SECTION 9: ANESTHETIC EFFECTS ON ICP
| Agent | CBF | ICP | CMR O₂ |
|---|---|---|---|
| Propofol | ↓↓ | ↓↓ | ↓↓ |
| Thiopentone | ↓↓ | ↓↓ | ↓↓ |
| Etomidate | ↓ | ↓ | ↓ |
| Ketamine | ↑↑ | ↑↑ | ↑ |
| Midazolam | ↓ | ↓ | ↓ |
| Isoflurane | ↑/↓* | ↑ (dose-dep) | ↓↓ |
| Sevoflurane | ↑/↓* | ↑ (dose-dep) | ↓ |
| N₂O | ↑ | ↑ | ↑ |
| Succinylcholine | ↑ (mild) | ↑ (mild) | - |
| Opioids | ↓ (slight) | ↓ | ↓ |
| Mannitol | ↓ CBV | ↓↓ | - |
SECTION 10: MANAGEMENT OF RAISED ICP (Quick Summary)
Mnemonic: "THINK MAP"
| Letter | Intervention |
|---|---|
| T | Tilt head up 30° (venous drainage) |
| H | Hyperventilate (PaCO₂ 30-35 mmHg - short term) |
| I | Intracerebral drain (EVD / ventriculostomy) |
| N | Narcotic + sedation (propofol/thiopentone) |
| K | Keep MAP adequate (CPP > 60 mmHg) |
| M | Mannitol / hypertonic saline (osmotherapy) |
| A | Avoid N₂O, ketamine, hyperthermia |
| P | Prevent hypoxia, hypercarbia, coughing |
SECTION 11: CSF CIRCULATION DIAGRAM
SECTION 12: VIVA QUESTIONS WITH ANSWERS
Q1. What is the rate and site of CSF production?
Q2. What is the Monro-Kellie doctrine?
Q3. What is the most important acute determinant of ICP?
Q4. What is CPP and what is the critical value?
Q5. Which induction agent is best for raised ICP patients and why?
Q6. Why does succinylcholine increase ICP and should it be avoided?
Q7. What is the mechanism by which volatile anesthetics affect ICP?
Q8. How does head-up positioning help in ICP?
Q9. What is the glymphatic system?
Q10. What are the components of cerebral compliance?
- Displacement of CSF to spinal subarachnoid space (~65 mL displaced)
- Reduction in cerebral venous blood volume (intracranial sinuses → extracranial)
- Slight compression of brain parenchyma (minimal)
Q11. What is the autoregulatory range for cerebral blood flow?
Q12. Name the CSF exit foramina from the fourth ventricle.
SECTION 13: RAPID REVISION - KEY NUMBERS
| Parameter | Value |
|---|---|
| CSF volume total | 150 mL |
| CSF production | 500 mL/day, 0.35 mL/min |
| Normal ICP | 5-15 mmHg |
| Raised ICP | >20 mmHg |
| Normal CPP | 70-100 mmHg |
| Critical CPP | <60 mmHg |
| CBF (normal) | 50 mL/100g/min (whole brain ~750 mL/min) |
| Autoregulation range | MAP 50-150 mmHg |
| PaCO₂ - CBF relationship | 1 mmHg ↑ PaCO₂ = ~2-4% ↑ CBF |
| PaO₂ threshold for vasodilation | <60 mmHg |
| Target PaCO₂ in raised ICP | 30-35 mmHg |