Explain me 10 common heart diseases with ECG changes and ECG image of those disease
Reading File
Finding Sources
Searching Images
ECG electrocardiogram myocardial infarction ST elevation
Finding Sources
Searching Images
atrial fibrillation ECG irregular rhythm absent P waves
Searching Images
ventricular fibrillation ECG chaotic waveform
Searching Images
complete heart block third degree AV block ECG
Searching Images
left ventricular hypertrophy ECG voltage criteria
Searching Images
Wolff-Parkinson-White syndrome ECG delta wave short PR interval
Searching Images
pericarditis ECG saddle shaped ST elevation diffuse
Searching Images
right bundle branch block RBBB ECG RSR prime pattern
Searching Images
ventricular tachycardia ECG wide complex tachycardia
Searching Images
hypertrophic cardiomyopathy ECG deep Q waves lateral leads
Here is a comprehensive guide to 10 common heart diseases with their characteristic ECG changes and representative ECG images:
10 Common Heart Diseases: ECG Changes & Images
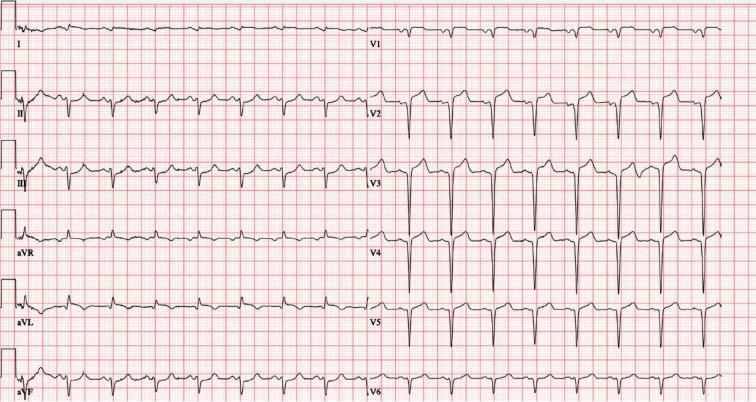
1. ST-Elevation Myocardial Infarction (STEMI)
ECG Changes
- Hyperacute T waves (earliest change — tall, peaked, asymmetric T waves)
- ST-segment elevation ≥1 mm in ≥2 contiguous limb leads, or ≥2 mm in ≥2 contiguous precordial leads (convex/tombstone morphology)
- Reciprocal ST-segment depression in opposite leads
- Pathological Q waves (>40 ms wide, >25% QRS height) — appear hours later, indicating necrosis
- T-wave inversions in the recovery phase
| Territory | Elevated Leads | Reciprocal Changes |
|---|---|---|
| Anterior (LAD) | V1–V4 | II, III, aVF |
| Inferior (RCA/LCx) | II, III, aVF | I, aVL |
| Lateral (LCx) | I, aVL, V5–V6 | II, III, aVF |
| Posterior | Tall R + ST↓ in V1–V2 | — |

2. Non-ST-Elevation Myocardial Infarction / Unstable Angina (NSTEMI/UA)
ECG Changes
- ST-segment depression (horizontal or down-sloping, ≥0.5 mm) in ≥2 contiguous leads
- T-wave inversions (symmetric, deep) — most prominent in the territory of ischemia
- No pathological Q waves (by definition — no transmural necrosis)
- Transient ST-T changes that may normalize between episodes
- The ECG may be normal in up to 6% of NSTEMI cases
Key distinction: Unlike STEMI, NO persistent ST elevation; treatment pathway differs (no immediate thrombolysis).
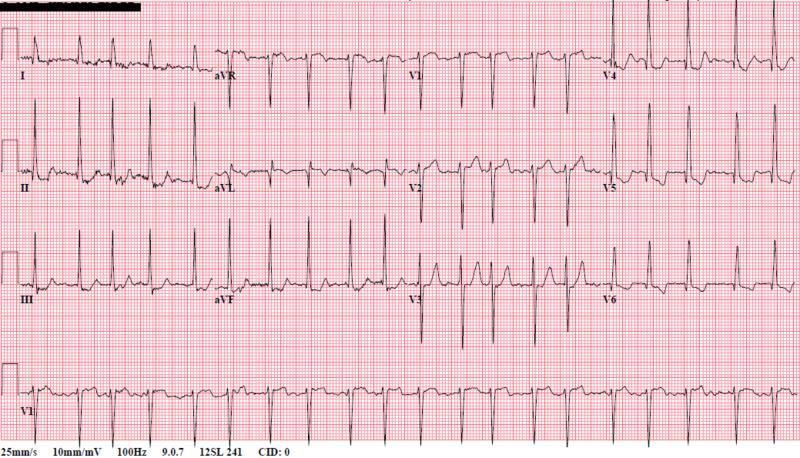
3. Atrial Fibrillation (AF)
ECG Changes
- Absent P waves — replaced by chaotic fibrillatory baseline (f-waves), best seen in V1
- Irregularly irregular R-R intervals (hallmark finding)
- Narrow QRS complexes (unless aberrant conduction/accessory pathway)
- Ventricular rate variable: 100–180 bpm (uncontrolled), 60–100 bpm (rate-controlled)
- Fibrillatory baseline most prominent in lead V1 and limb leads
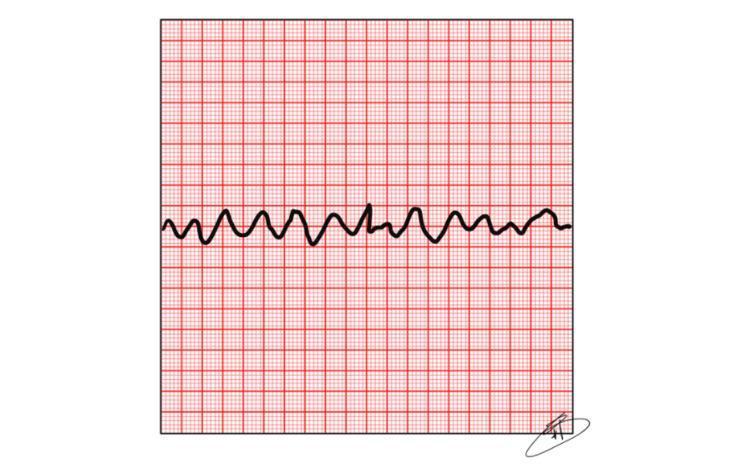
4. Ventricular Fibrillation (VF)
ECG Changes
- Completely chaotic, disorganized waveforms with no identifiable P, QRS, or T waves
- Irregular undulations of varying amplitude and frequency
- Heart rate effectively undefined — no organized cardiac output
- Coarse VF: higher amplitude oscillations (often more recent onset, more responsive to defibrillation)
- Fine VF: low amplitude, difficult to distinguish from asystole
Medical emergency — requires immediate defibrillation (200J biphasic).
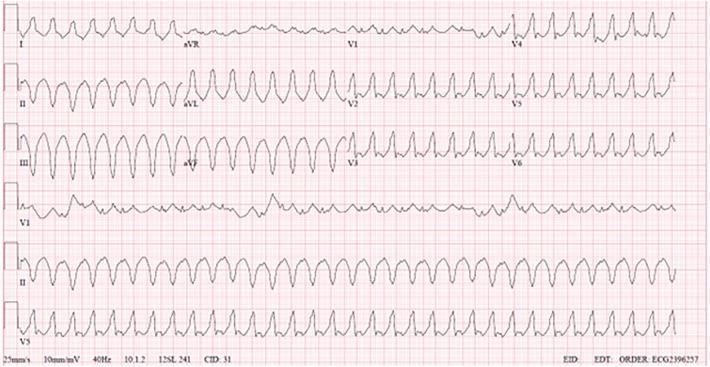
5. Ventricular Tachycardia (VT)
ECG Changes
- Wide QRS complexes (>120 ms) at a rapid rate (100–250 bpm)
- Regular rhythm (monomorphic VT) or irregular (polymorphic VT/Torsades)
- AV dissociation — P waves march independently from QRS (pathognomonic when seen)
- Fusion beats and capture beats (Dressler beats) — highly specific for VT
- Concordance across precordial leads (all positive = positive concordance, all negative = negative concordance)
- Axis: often superior (northwest axis)
Brugada criteria, Vereckei algorithm, and RWPT help differentiate VT from SVT with aberrancy.
6. Complete (Third-Degree) AV Block
ECG Changes
- Complete AV dissociation — P waves and QRS complexes are completely independent
- Regular P-P intervals (atrial rate: ~60–100 bpm)
- Regular R-R intervals but at a much slower rate (ventricular escape rate: 20–60 bpm)
- No consistent PR interval — P waves "march through" QRS complexes
- QRS morphology depends on escape focus:
- Junctional escape (His bundle) → narrow QRS (~40–60 bpm)
- Ventricular escape → wide, bizarre QRS (~20–40 bpm)
7. Pericarditis (Acute)
ECG Changes
Four classic stages:
| Stage | Timing | ECG Finding |
|---|---|---|
| 1 | Days 1–2 | Diffuse saddle-shaped (concave) ST elevation in almost all leads except aVR and V1; PR depression (most specific sign) |
| 2 | Days 3–7 | ST normalizes; T-waves flatten |
| 3 | Weeks 1–3 | Diffuse T-wave inversions |
| 4 | Months | ECG normalizes |
- Spodick's sign: downsloping TP segment (highly specific for pericarditis)
- aVR reciprocal ST elevation and PR elevation
- Differentiated from STEMI by: diffuse distribution, concave morphology, PR depression, absence of Q waves, absence of reciprocal changes (except aVR)

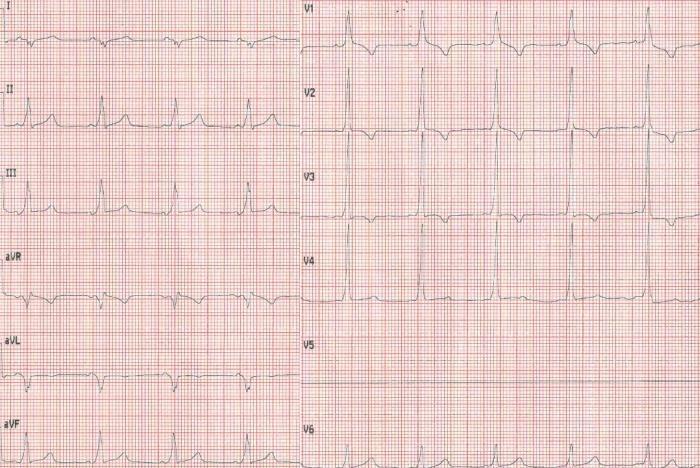
8. Wolff-Parkinson-White (WPW) Syndrome
ECG Changes
The classic WPW triad:
- Short PR interval (<120 ms) — due to bypass of AV node via accessory pathway
- Delta wave — slurred upstroke at onset of QRS (pre-excitation of ventricular myocardium)
- Widened QRS (>120 ms) — due to fusion of pre-excited and normally conducted impulses
Additional features:
- Secondary ST-T wave changes (opposite to QRS direction)
- Pseudo-Q waves in inferior leads (mimics inferior infarction)
- Accessory pathway localization by delta wave polarity (e.g., positive delta in V1 = left-sided pathway)
- Risk of AF with rapid ventricular response via the accessory pathway (life-threatening)
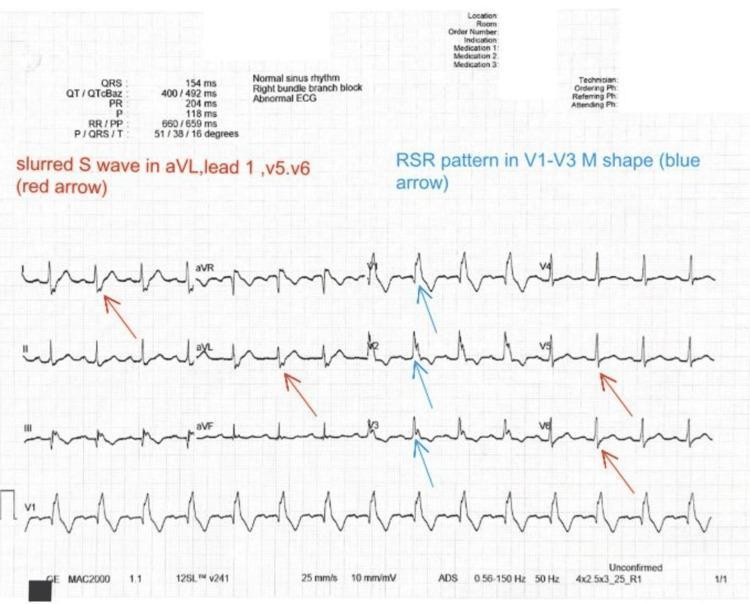
9. Right Bundle Branch Block (RBBB)
ECG Changes
- QRS duration ≥120 ms (complete RBBB); 100–119 ms (incomplete RBBB)
- rSR' pattern ("rabbit ears") in V1–V3 — the classic finding
- Wide, slurred S waves in leads I, aVL, V5, V6
- Secondary ST-T wave changes: T-wave inversions in V1–V3 (always secondary to conduction delay — not primary ischemia)
- Right axis deviation may be present
- Associated with: pulmonary embolism (new RBBB), right heart disease, post-cardiac surgery
New RBBB + anterior ST elevation = Sgarbossa criteria territory — possible LAD occlusion.
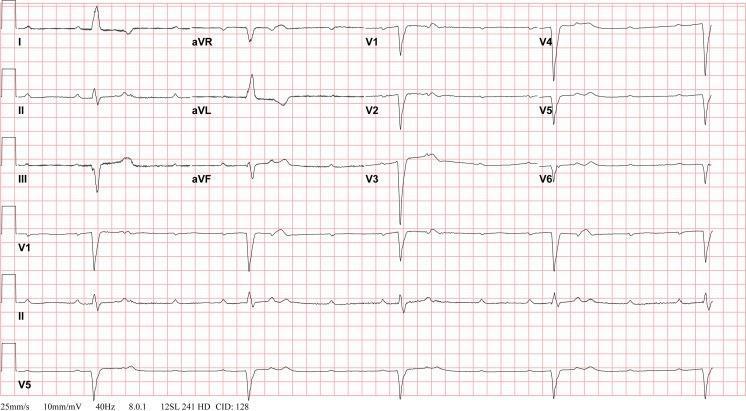
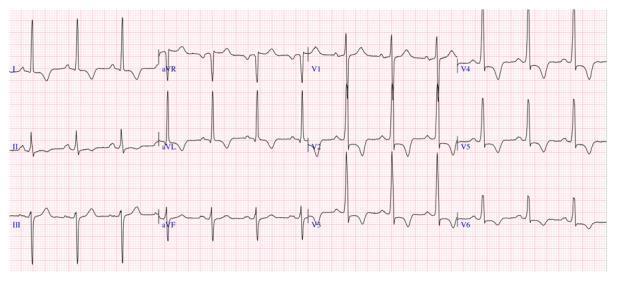
10. Hypertrophic Cardiomyopathy (HCM)
ECG Changes
- Left ventricular hypertrophy (LVH) voltage criteria:
- Sokolow-Lyon: S(V1) + R(V5 or V6) >35 mm
- Cornell: R(aVL) + S(V3) >28 mm (men), >20 mm (women)
- Deep, narrow Q waves ("dagger Q waves") in lateral leads (I, aVL, V5–V6) and inferior leads — due to septal hypertrophy
- Giant T-wave inversions (≥10 mm) in precordial leads V2–V5 — especially in apical HCM (Yamaguchi syndrome)
- LV strain pattern: ST depression + T-wave inversion in lateral leads
- Left axis deviation
- P-wave abnormality (left atrial enlargement): bifid P wave (P mitrale) or P >120 ms
- ECG is abnormal in 90–95% of HCM patients
Quick Reference Summary
| # | Disease | Key ECG Finding |
|---|---|---|
| 1 | STEMI | Convex ST elevation, reciprocal depression, Q waves |
| 2 | NSTEMI/UA | ST depression, T-wave inversion, no Q waves |
| 3 | Atrial Fibrillation | Absent P waves, irregularly irregular rhythm |
| 4 | Ventricular Fibrillation | Chaotic, no recognizable complexes |
| 5 | Ventricular Tachycardia | Wide QRS tachycardia, AV dissociation, concordance |
| 6 | Complete AV Block | P-QRS dissociation, slow escape rhythm |
| 7 | Pericarditis | Diffuse concave ST elevation, PR depression, Spodick's sign |
| 8 | WPW Syndrome | Short PR, delta wave, widened QRS |
| 9 | RBBB | rSR' in V1, wide S in I/aVL/V5–V6, QRS ≥120 ms |
| 10 | HCM | LVH voltage, deep Q waves, giant T-wave inversions |
Clinical pearl: Always interpret the ECG in the context of clinical history, symptoms, and hemodynamic status. ECG changes can overlap between conditions, and serial ECGs often provide more diagnostic value than a single tracing.
This is a shared conversation. Sign in to Orris to start your own chat.