
Explain blood picture in megaloblastic anaemia.
megaloblastic anaemia blood picture peripheral smear macrocytes hypersegmented neutrophils
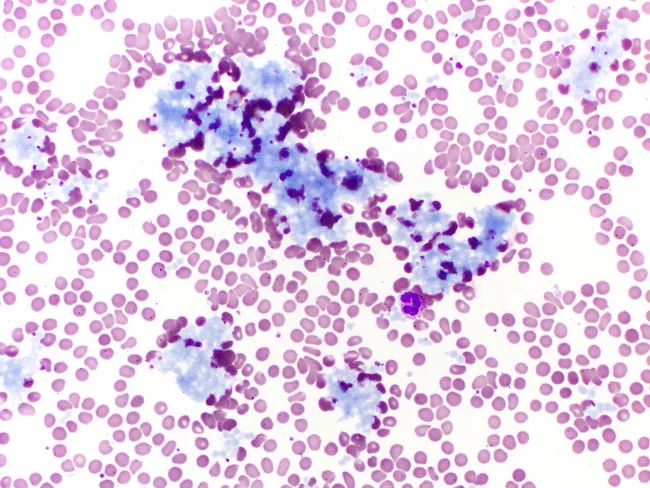
Peripheral blood smear from a patient with Waldenström macroglobulinemia (lymphoplasmacytic lymphoma) showing IgM immunoglobulin aggregates on brightfield microscopy after Wright-Giemsa staining. The smear features numerous small, round erythrocytes with mild central pallor and occasional rouleaux formation, alongside conspicuous blue‑purple proteinaceous aggregates. These aggregates represent high‑molecular‑weight IgM paraprotein that precipitates or polymerizes in serum and circulates as macroglobulins, a hallmark of hyperviscosity syndrome. The IgM‑derived clumps are irregular, amorphous to coarse in appearance, and contrast with the pink cytoplasm of RBCs, producing a striking multicellular landscape. Notably, the leukocyte morphology is not the primary focus here, but scattered neutrophils and mononuclear cells are present. Clinically, the observation supports a diagnosis of Waldenström macroglobulinemia with hyperviscosity-related symptoms, including neuropathy, blurred vision, and headaches. Correlation with serum protein electrophoresis demonstrating an IgM monoclonal spike and elevated serum viscosity is recommended. Therapeutic implications include plasmapheresis to rapidly lower IgM‑driven viscosity, followed by disease‑modifying therapy (e.g., rituximab‑based regimens, proteasome inhibitors). This image is valuable for hematology education, cytology training, and case-based teaching on IgM paraproteinemia. This image also highlights the importance of distinguishing extracellular IgM aggregates from cellular inclusions, and demonstrates how sample handling and temperature can influence aggregate formation.
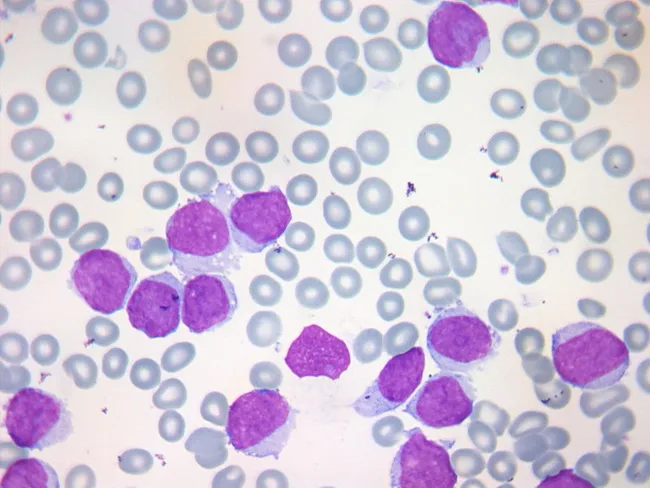
This is a light-m microscopy image of a peripheral blood smear, prepared with May-Grünwald-Giemsa stain and evaluated under standard hematology practice. The specimen demonstrates circulating malignant lymphoid cells consistent with mantle cell lymphoma in the leukemic phase. In typical MCL with blood involvement, the circulating cells are small to medium in size with scant cytoplasm and irregular, indented or clefted nuclei, and reticular chromatin; spectrums of blasts may occur in occasional cases. Notably, the clumped chromatin characteristic of chronic lymphocytic leukemia is not observed. In this slide, a subpopulation of larger cells with higher nuclear-to-cytoplasmic ratio and more conspicuous nucleoli resembles a blastoid morphology, correlating with the aggressive variant and rapid clinical progression (often 3–4 months). The background contains numerous mature erythrocytes and scattered neutrophils, providing a typical smear context. Immunophenotyping by flow cytometry would typically reveal clonal B cells expressing CD5, CD19, CD20, surface immunoglobulin light chain restriction, and cyclin D1 overexpression due to t(11;14)(q13;q32). The presence of circulating tumor cells in peripheral blood can accompany massive splenomegaly with minimal nodal disease and has prognostic significance as a marker of disease burden. This image is educational for hematology, cytology, and pathology training, illustrating differential considerations among leukemic lymphoproliferations and guiding ancillary testing.
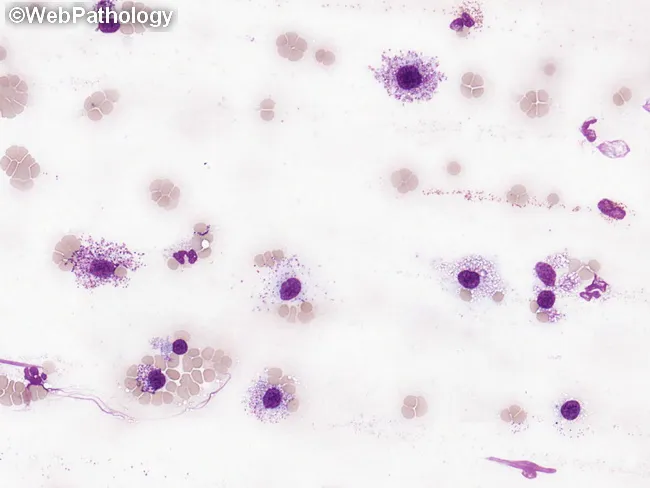
This peripheral blood smear was prepared and stained with Wright-Giemsa and examined by bright-field light microscopy to assess circulating hematopoietic cells in suspected systemic mastocytosis (SM). The smear shows rare, but conspicuous, mast cells with round to polygonal shapes and abundant cytoplasmic granules that impart a deep purple, metachromatic appearance. Nuclei are generally round to ovoid and may be slightly irregular or bilobed in some cells; granules occupy most of the cytoplasm and may obscure nuclear detail. The surrounding leukocytes include eosinophils and neutrophils, and the erythrocyte background is normocytic with occasional anisocytosis. In SM, circulating mast cells are typically infrequent; when they constitute a substantial fraction of leukocytes (≥10%), the finding is highly suggestive of mast cell leukemia (MCL). The image exemplifies an increased mast cell burden consistent with aggressive SM or MCL, often accompanied by cytopenias such as anemia or thrombocytopenia and potential associated hematologic neoplasms (e.g., CMML, MDS/MPN). This morphologic snapshot supports integration with phenotypic assays (CD117/c-KIT), flow cytometry, and molecular testing for KIT mutations, to establish diagnosis, prognostication, and therapeutic planning. Relevant keywords: systemic mastocytosis, mast cell leukemia, circulating mast cells, metachromatic granules, Wright-Giemsa, toluidine blue, KIT D816V, CD117, SM-AHN. This description emphasizes morphology guiding diagnosis appropriately.
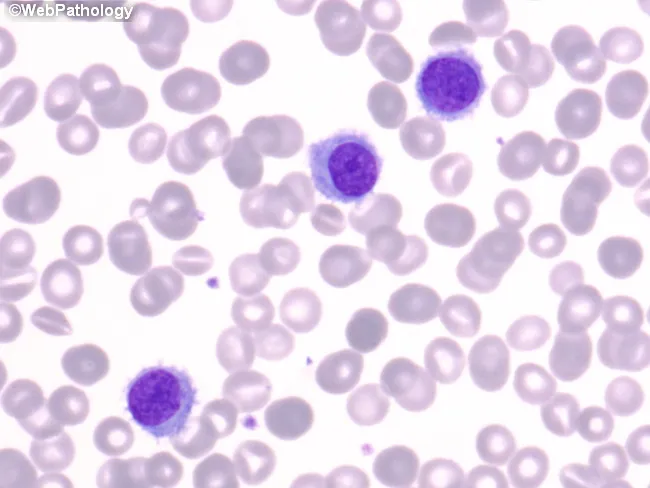
Imaging modality and technique: Light microscopy on peripheral blood smear stained with Wright-Giemsa. Specimen type: peripheral blood smear. Primary subject: Hairy cells. Anatomical context: hematopoietic peripheral blood. Observed morphology: Hairy cells are larger than small lymphocytes, about 1.5–2× the size; nuclei are oval to bean-shaped with open, coarse chromatin and inconspicuous nucleoli. Cytoplasm is moderate in volume, pale blue, with fine, hair-like cytoplasmic projections that extend from the cell surface. Chromatin is evenly dispersed; nucleoli are not prominent. The smear shows scattered hairy cells among a background of normocytic erythrocytes and neutrophils. In some cases cytoplasm may appear flocculent; proplate-like projections are best seen in well-prepared thin areas of smear. This morphology is best appreciated on peripheral smear preparations rather than aspirate smears, where hair projections may be less evident. Diagnostic significance: characteristic hairy cell features suggest a diagnosis of hairy cell leukemia (HCL) in appropriate clinical context; TRAP positivity, CD11c, CD25, and CD103 expression support the diagnosis. Clinical correlation includes cytopenias, splenomegaly, and exposure to risk factors; differential includes other lymphoid and myeloid disorders with cytoplasmic projections or atypical lymphocytes. Utility in education and differential diagnosis: hematology teaching, smear interpretation, cellular morphologic recognition, and confirmation with flow cytometry.
megaloblastic anaemia macrocytes oval macrocytes hypersegmented neutrophils bone marrow
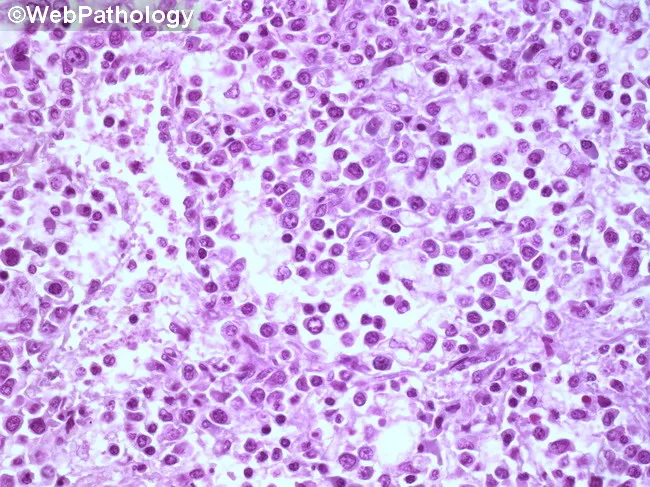
Imaging modality: light microscopy of a hematopathology slide from a bone marrow aspirate smear. Stain: Hematoxylin and Eosin (H&E). Magnification: high-power field (~400x total; 40x objective with 10x ocular). Anatomical location: bone marrow within the medullary cavity (hematopoietic tissue). Visual features: sheets of immature blasts with high nuclear-to-cytoplasmic ratio, round to oval nuclei, fine chromatin, prominent nucleoli, and scant basophilic cytoplasm; increased cellularity with near-complete effacement of normal hematopoiesis; occasional mitotic figures; minimal cytoplasmic granularity; sparse residual neutrophils, erythroid precursors, and megakaryocytes. Pathologic interpretation: diffuse marrow infiltration by blasts, consistent with an acute leukemia until immunophenotyping and genetic studies delineate subtype. Diagnostic significance: morphologic hallmark of an acute hematologic malignancy; requires ancillary tests (flow cytometry, immunohistochemistry, cytogenetics/molecular studies) for lineage classification (myeloid vs lymphoid), prognosis, and treatment planning. Differential considerations: ALL (acute lymphoblastic leukemia), AML (acute myeloid leukemia), lymphoblastic lymphoma with marrow involvement, myelodysplastic syndrome with excess blasts, or nonhematopoietic marrow infiltration. Clinical correlation: commonly presents with cytopenias, fatigue, infections, and bleeding; pediatric ALL vs adult AML guidance; urgent hematology-oncology workup is indicated. Educational use: foundational blast morphology recognition, marrow infiltration patterns, and the need for confirmatory immunophenotyping. This image is valuable for training in blast morphology, differential diagnosis, and education in hematopathology.
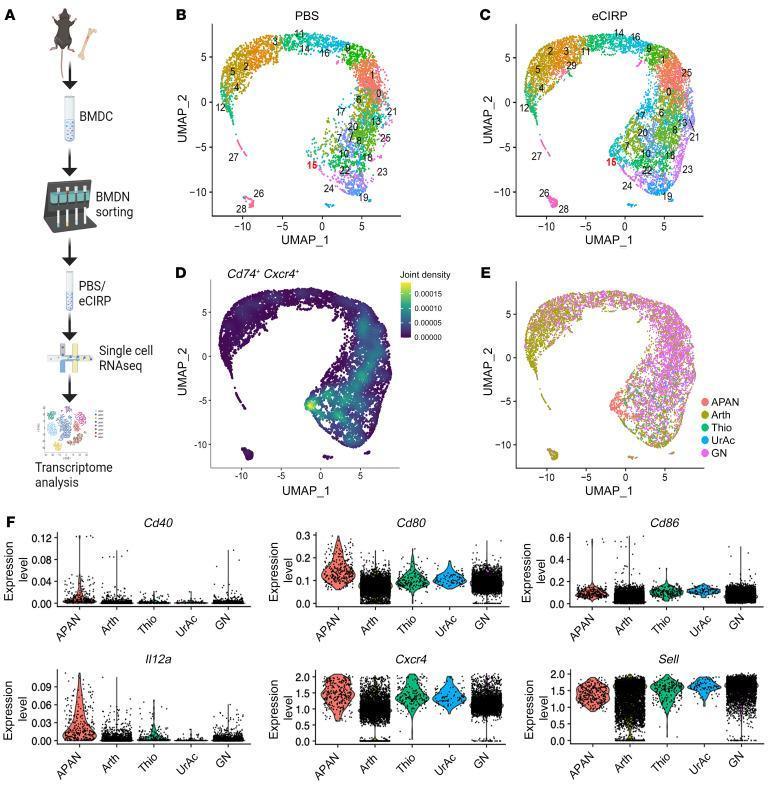
Educational figure illustrating the single-cell transcriptomic characterization of mouse bone marrow-derived neutrophils (BMDNs) into a distinct subpopulation termed APANs (Antigen-Presenting Aged Neutrophils). (A) Workflow diagram showing BMDN purification, eCIRP stimulation, and 10x Genomics scRNA-Seq pipeline. (B-C) UMAP plots comparing resting (PBS) versus eCIRP-stimulated neutrophils, revealing cluster 15 as a specific population that expands upon stimulation. (D) Feature plot highlighting the joint density of Cd74 and Cxcr4, markers defining the APAN cluster. (E) UMAP plot integrating reference transcriptomes (Arth, Thio, UrAc, GN) with the newly identified APAN cluster. (F) Series of violin plots comparing the expression levels of key marker genes (Cd40, Cd80, Cd86, Il12a, Cxcr4, and Sell) across the five neutrophil transcriptomes. APANs demonstrate distinctively high expression of Il12a and Cxcr4, and characteristic levels of costimulatory molecules Cd80 and Cd86, supporting their antigen-presenting phenotype.
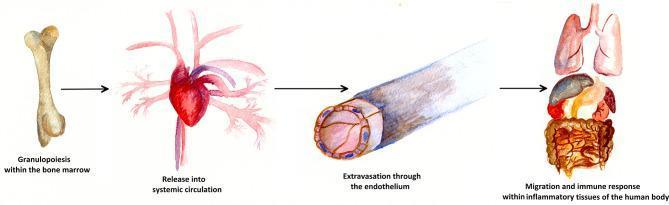
This medical illustration depicts the four primary stages of the neutrophil lifecycle using a linear progression diagram. Starting from the left, the first stage is 'Granulopoiesis within the bone marrow,' represented by an illustration of a long bone where neutrophil production occurs. An arrow leads to the second stage, 'Release into systemic circulation,' symbolized by an anatomical heart with branching vasculature. The third stage, 'Extravasation through the endothelium,' displays a detailed cross-sectional view of a postcapillary venule, showing the endothelial lining and the process of leukocytes exiting the vessel into the interstitium. The final stage on the right, 'Migration and immune response within inflammatory tissues of the human body,' illustrates various target organs, including the lungs, liver, and intestines, where neutrophils perform innate immune functions such as phagocytosis and chemotaxis. The illustration serves as an educational summary of hematopoiesis, vascular transit, and the localized inflammatory response.
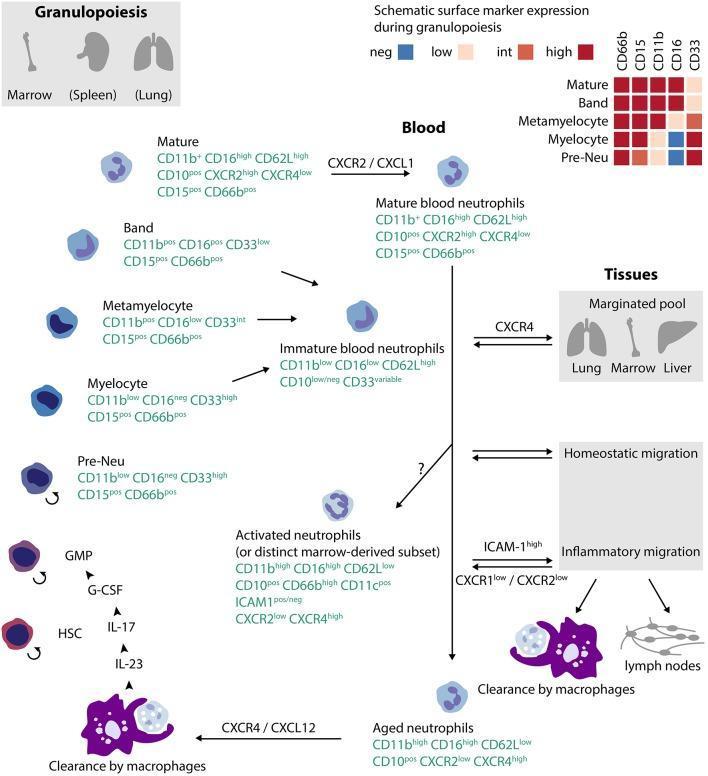
This pathophysiology diagram illustrates the lifecycle of human neutrophils, from granulopoiesis in the bone marrow to blood circulation and tissue clearance. The diagram details the progression from Hematopoietic Stem Cells (HSC) and Granulocyte-Monocyte Progenitors (GMP) through maturation stages including pre-Neu, myelocyte, metamyelocyte, and band cells to mature neutrophils. Key surface marker profiles are provided for each stage, highlighting the dynamic expression of CD11b, CD16, CD10, CD33, and CD62L. A heatmap indicates the transition of CD66b, CD15, CD11b, CD16, and CD33 expression levels during differentiation. In the blood compartment, the diagram distinguishes between mature, immature, activated, and aged neutrophils, noting chemotactic receptors like CXCR2 (mobilization) and CXCR4 (homing/aging). The right side of the infographic shows neutrophil fates: margination in the lung, marrow, and liver; homeostatic tissue migration; and inflammatory migration mediated by ICAM-1. The lifecycle concludes with clearance by macrophages in the tissues or bone marrow, providing a comprehensive overview of neutrophil ontogeny, heterogeneity, and functional trafficking.
Blood Picture in Megaloblastic Anaemia
1. Red Blood Cells (Erythrocytes)
- The most characteristic finding on the peripheral smear.
- Red cells are large and egg-shaped. These are called macro-ovalocytes and are highly distinctive of megaloblastic anaemia (as opposed to the round macrocytes of liver disease or hypothyroidism).
- The MCV is often >110 fL (normal: 78-98 fL), sometimes reaching 130-140 fL in severe cases.
- Despite appearing "hyperchromic" because they lack central pallor, the mean cell haemoglobin concentration (MCHC) is actually normal - the cells just have more haemoglobin in absolute terms because they are larger.
- There is marked variation in red cell size (anisocytosis) and shape (poikilocytosis).
- Tear-drop cells (dacryocytes) and fragmented cells may also be present.
- Nuclear remnants (Howell-Jolly bodies) are commonly seen within red cells due to karyorrhexis (nuclear fragmentation) during abnormal megaloblastic maturation.
- The red cell count is disproportionately low relative to the haemoglobin - because each cell is so large, fewer cells are needed to carry the same amount of haemoglobin.
2. White Blood Cells (Leukocytes)
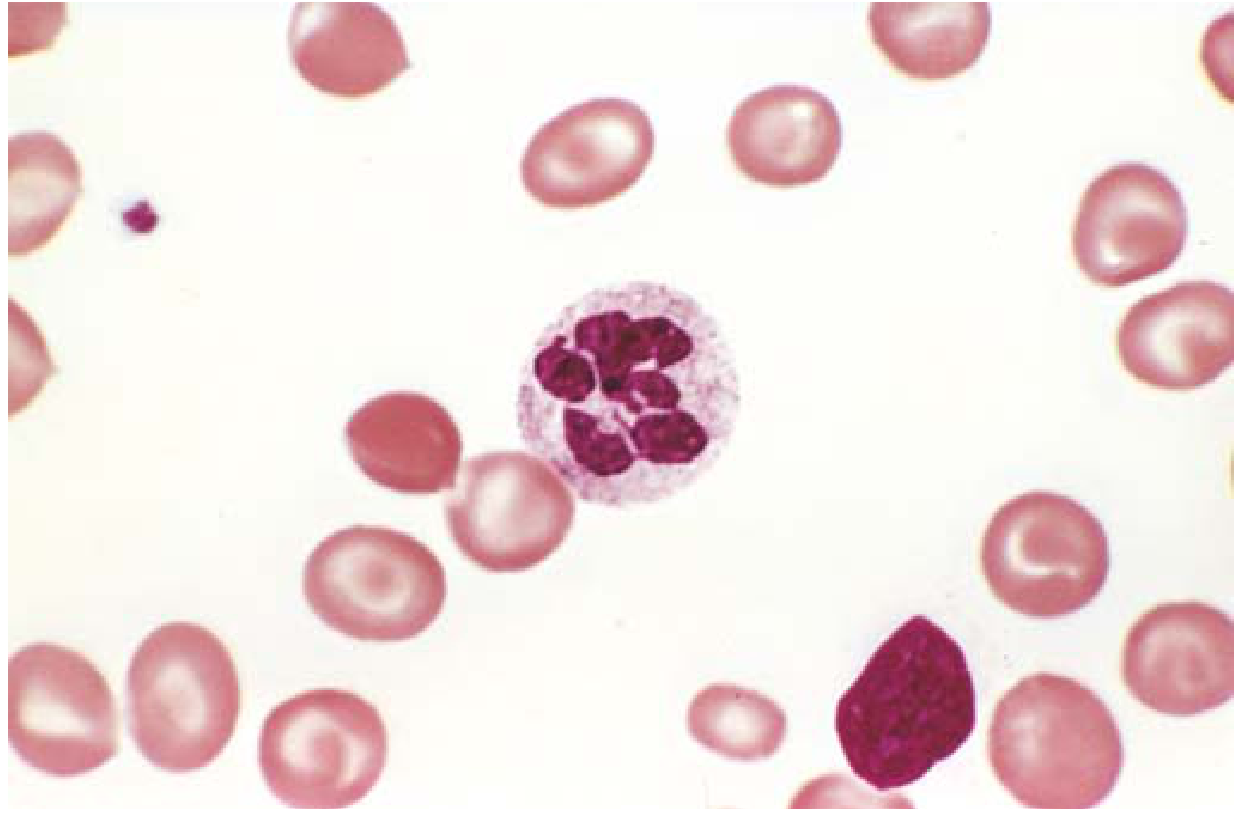
- Hypersegmented neutrophils appear before the anaemia becomes apparent and are considered the earliest peripheral blood change.
- Diagnostic criteria: 5 or more lobes in >5% of neutrophils, OR any neutrophil with 6 or more lobes.
- Normal neutrophils have 3-4 nuclear lobes. In megaloblastic anaemia, this is consistently exceeded.
- Caused by the same nuclear-cytoplasmic asynchrony - granulocyte precursors undergo nuclear maturation failure similar to erythroid cells.
- Giant metamyelocytes may also be seen (best appreciated on the bone marrow, but occasionally in peripheral blood in severe disease).
- The white cell count is reduced (granulocytopenia), contributing to the pancytopenia that characterises most cases.
3. Platelets (Thrombocytes)
- Thrombocytopenia is present - platelet precursors (megakaryocytes) are also affected by the same DNA synthesis defect.
- Large, misshapen (bizarre) platelets may be seen on the smear, reflecting abnormal megakaryocyte maturation.
4. Complete Blood Count (CBC) Summary
| Parameter | Finding |
|---|---|
| Haemoglobin | Reduced (anaemia) |
| MCV | Markedly elevated (>100, often >110 fL) |
| MCHC | Normal |
| MCH | Elevated (absolute, due to large cell size) |
| RDW | Increased (reflects anisocytosis) |
| White cell count | Decreased (leukopenia/granulocytopenia) |
| Platelet count | Decreased (thrombocytopenia) |
| Reticulocyte count | Decreased (ineffective erythropoiesis) |
5. Bone Marrow Picture (Context)
- Megaloblasts at all stages: promegaloblasts, basophilic, polychromatophilic, and orthochromatic megaloblasts. They are larger than normoblasts with delicate, finely reticulated ("open") nuclear chromatin that fails to clump normally even as haemoglobin accumulates.
- Giant metamyelocytes - abnormally large granulocyte precursors.
- Abnormally large, multilobed megakaryocytes.
Key Points to Remember
- The earliest peripheral blood change is hypersegmented neutrophils - preceding anaemia.
- The most characteristic red cell change is macro-ovalocytes (not just round macrocytes).
- Most patients present with pancytopenia (anaemia + leukopenia + thrombocytopenia).
- The reticulocyte count is low despite the hypercellular marrow - a hallmark of ineffective erythropoiesis.
- B12 and folate deficiency produce identical haematological pictures; they are distinguished by serum levels and (in B12 deficiency) by the presence of neurological involvement (subacute combined degeneration of the spinal cord).