The electrocardiogram analysis: components of a normal electrocardiogram and pathological changes of elements of an electrocardiogram (a hypertrophy of the right and left atriums, a hypertrophy of the right and left ventricles, pathological ectopic beats and rhythm, the electrocardiogram in acute coronary syndrome) long notes explained clearly
normal ECG components P wave QRS complex T wave intervals segments
ECG atrial hypertrophy right left P pulmonale P mitrale criteria
normal ECG waveform components labeled P QRS T wave
ventricular hypertrophy ECG right left criteria voltage axis deviation
ECG ectopic beats arrhythmia PAC PVC supraventricular tachycardia atrial fibrillation
ECG ST elevation STEMI acute myocardial infarction ACS changes
Electrocardiogram (ECG) Analysis: Comprehensive Clinical Notes
PART 1: THE NORMAL ECG
1.1 Basic Principles
- Paper speed: 25 mm/s → 1 small box = 0.04 s; 1 large box = 0.2 s
- Amplitude calibration: 1 mV = 10 mm (2 large boxes)
- Isoelectric line: baseline between beats; deviations indicate electrical activity
1.2 ECG Waveforms and Intervals
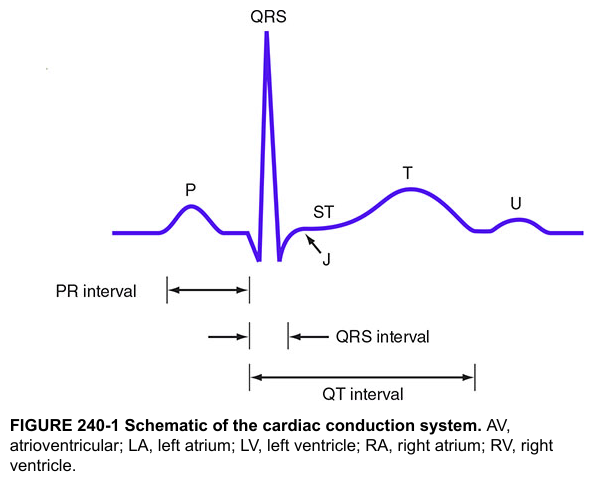
| Component | Represents | Normal Duration/Amplitude |
|---|---|---|
| P wave | Atrial depolarization (SA node → AV node) | Duration ≤ 120 ms (3 small boxes); Amplitude ≤ 2.5 mm; Positive in I, II, aVF |
| PR interval | AV conduction time (from P onset to QRS onset) | 120–200 ms (3–5 small boxes) |
| QRS complex | Ventricular depolarization | 60–100 ms; < 120 ms |
| J point | Junction between end of QRS and start of ST segment | At isoelectric line |
| ST segment | Early ventricular repolarization plateau | Isoelectric (≤ 1 mm deviation in limb leads) |
| T wave | Ventricular repolarization | Positive in I, II, V3–V6; Amplitude < 10 mm |
| U wave | Repolarization of Purkinje fibers / M cells | Small positive deflection after T; best seen V2–V3 |
| QT interval | Total ventricular electrical systole | QTc: 350–440 ms (males); 350–460 ms (females) |
1.3 Detailed Waveform Analysis
P Wave
- Produced by right atrial depolarization (first 40 ms) followed by left atrial depolarization
- Normal morphology: smooth, rounded, upright in leads I, II, aVF
- Inverted P in aVR (normal)
- Biphasic (±) in V1 — initial positive = RA, terminal negative = LA
PR Interval
- Reflects conduction through the AV node, Bundle of His, and bundle branches
- Short PR (< 120 ms): pre-excitation (WPW), junctional rhythm, LGL syndrome
- Long PR (> 200 ms): first-degree AV block
QRS Complex
- Q wave: initial septal depolarization (left → right); normal Q < 40 ms, < 25% of R height
- R wave: main ventricular depolarization; normal progression V1→V6 (R grows, S shrinks)
- S wave: terminal basal depolarization
- Transition zone: where R = S, normally V3–V4
ST Segment
- Represents the period when all ventricular cells are depolarized
- Should be isoelectric
- Measured from J point
T Wave
- Normally asymmetric (slow rise, rapid fall)
- Inverted T in aVR and V1 is normal
- Peaked T in V1: right atrial enlargement or hyperkalemia clue
QT Interval / QTc
- Corrected using Bazett's formula: QTc = QT / √RR (all in seconds)
- Prolonged QTc → risk of Torsades de Pointes
1.4 Cardiac Axis
| Axis | Degrees | Limb Leads |
|---|---|---|
| Normal | 0° to +90° | Positive QRS in I and II |
| Left axis deviation (LAD) | −30° to −90° | Positive I, negative II and aVF |
| Right axis deviation (RAD) | +90° to +180° | Negative I, positive II and aVF |
| Extreme/NW axis | −90° to ±180° | Negative I and aVF |
PART 2: PATHOLOGICAL ECG CHANGES
PART 2A: ATRIAL HYPERTROPHY / ENLARGEMENT
2A.1 Right Atrial Enlargement (RAE) — "P Pulmonale"
- P wave amplitude ≥ 2.5 mm (tall, peaked) in leads II, III, aVF
- P wave duration usually normal (≤ 120 ms)
- May also appear as tall initial positivity in V1
- P wave axis often rightward (> +75°)
- Cor pulmonale (chronic lung disease, pulmonary hypertension)
- Tricuspid stenosis or regurgitation
- Pulmonary stenosis
- Right heart failure
2A.2 Left Atrial Enlargement (LAE) — "P Mitrale"
- Broad, notched P wave ≥ 120 ms in limb leads (I, II, aVL) — the "M-shaped" or bifid P
- Biphasic P wave in V1 with a broad, deep terminal negative component
- Terminal negative portion: depth × duration ≥ 1 mm × 40 ms (Morris index ≥ 0.04 mm·s)
- P wave axis often leftward
- P-wave terminal force in V1 is the most sensitive criterion
- Mitral stenosis (classic "P-mitrale")
- Mitral regurgitation
- Left heart failure / LVH
- Hypertension
- Can occur with LA conduction delay without true anatomical enlargement
2A.3 Biatrial Enlargement
- Broad AND tall P waves: duration ≥ 120 ms AND amplitude ≥ 2.5 mm
- Or: tall P waves in inferior leads + wide negative terminal component in V1
PART 2B: VENTRICULAR HYPERTROPHY
2B.1 Right Ventricular Hypertrophy (RVH)
| Criterion | Finding |
|---|---|
| R/S ratio in V1 > 1 | Dominant R wave in V1 (normally S > R) |
| R in V1 ≥ 7 mm | Tall R in right precordial lead |
| S in V5 or V6 ≥ 7 mm | Deep S in left precordial leads |
| Right axis deviation (RAD) ≥ +90° | Negative QRS in lead I |
| ST depression and T-wave inversion in V1–V3 | "Strain pattern" = systolic overload |
| qR pattern in V1 | Indicates severe RVH or cor pulmonale |
| S1Q3T3 pattern | Also seen in acute cor pulmonale/PE |
| Incomplete or complete RBBB | May accompany RVH |
| P pulmonale | Often co-exists due to RA overload |
- Pulmonary hypertension (primary or secondary)
- Pulmonary stenosis
- Tetralogy of Fallot
- Chronic obstructive pulmonary disease (COPD)
- Mitral stenosis (with pulmonary HTN)
2B.2 Left Ventricular Hypertrophy (LVH)
| Criterion | Threshold | Sensitivity | Specificity |
|---|---|---|---|
| Sokolow-Lyon | S in V1 + R in V5 or V6 ≥ 35 mm | ~60% | ~85% |
| Cornell voltage | R in aVL + S in V3 ≥ 28 mm (men) / ≥ 20 mm (women) | ~42% | ~96% |
| Lewis index | RI + SIII − SI − RIII ≥ 17 mm | — | — |
| R in aVL ≥ 11 mm (isolated) | Highly specific | ~20% | ~95% |
- Left axis deviation (−30° to −90°)
- Prolonged QRS (100–110 ms), broad R wave peak time > 50 ms in V5/V6
- ST depression + T-wave inversion in I, aVL, V5–V6 → LV "strain" pattern (systolic overload)
- Repolarization abnormality: asymmetric ST-T in V5–V6
- Voltage criteria: 3 pts
- LV strain pattern: 3 pts
- LAE: 3 pts
- LAD ≥ −30°: 2 pts
- QRS duration ≥ 90 ms: 1 pt
- Intrinsicoid deflection V5/V6 ≥ 50 ms: 1 pt
- ≥ 5 points = definite LVH; 4 points = probable LVH
- Systemic hypertension (most common)
- Aortic stenosis / aortic regurgitation
- Hypertrophic cardiomyopathy (HOCM)
- Coarctation of the aorta
PART 3: PATHOLOGICAL ECTOPIC BEATS AND RHYTHMS
3.1 Ectopic Beats — Overview
- Supraventricular (atrial or junctional) — narrow QRS (< 120 ms)
- Ventricular — wide QRS (≥ 120 ms)
3.2 Premature Atrial Complexes (PACs)
- Premature P' wave with abnormal morphology (different from sinus P)
- Usually narrow QRS (< 120 ms) — same as conducted sinus beats
- Incomplete compensatory pause (the SA node is reset)
- If P' falls too early → aberrant conduction (wide QRS) or blocked PAC (no QRS)
3.3 Premature Ventricular Complexes (PVCs)
- Wide, bizarre QRS ≥ 120 ms
- No preceding P wave (or retrograde P after QRS)
- Full compensatory pause (SA node not reset)
- T wave in opposite direction to the main QRS deflection (discordant T)
- Fusion beats: occur when a PVC coincides with a sinus impulse
| Pattern | Description |
|---|---|
| Bigeminy | PVC every other beat (sinus–PVC–sinus–PVC) |
| Trigeminy | PVC every third beat |
| Couplet | Two consecutive PVCs |
| Triplet | Three consecutive PVCs (= non-sustained VT) |
| R-on-T | PVC lands on T wave of preceding beat → risk of VF |
3.4 Supraventricular Tachycardias (SVT)
Sinus Tachycardia
- Rate 100–180 bpm; normal P waves precede each QRS; physiological
Atrial Flutter
- Rate: Atrial rate ~300 bpm; ventricular rate typically 150 bpm (2:1 block)
- Sawtooth flutter waves (F waves) in leads II, III, aVF — no isoelectric baseline
- Regular R-R intervals (if fixed block ratio)
- Narrow QRS unless aberrant conduction
Atrial Fibrillation (AF)
- Absent P waves replaced by chaotic fibrillatory (f) waves, best seen V1
- Irregularly irregular R-R intervals
- Narrow QRS (unless pre-existing BBB or aberrant conduction)
- Rate: 100–180 bpm (uncontrolled)
AV Nodal Re-entrant Tachycardia (AVNRT)
- Most common paroxysmal SVT
- Rate: 150–250 bpm
- Narrow QRS (< 120 ms)
- P waves buried in or just after QRS (retrograde P' — negative in II, III, aVF)
- Pseudo-r' in V1 or pseudo-s in inferior leads
WPW / Accessory Pathway Tachycardia
- Delta wave (slurred upstroke of QRS) during sinus rhythm
- Short PR (< 120 ms)
- Wide QRS due to ventricular pre-excitation
- Risk: AF with rapid conduction → VF
3.5 AV Blocks
| Type | ECG Features | Mechanism |
|---|---|---|
| 1st degree | PR > 200 ms; every P followed by QRS | Delayed AV conduction |
| 2nd degree Mobitz I (Wenckebach) | Progressive PR lengthening → dropped QRS | AV node fatigue |
| 2nd degree Mobitz II | Fixed PR; sudden dropped QRS without warning | Bundle of His/branches |
| 3rd degree (complete) | P waves and QRS completely dissociated; escape rhythm | Complete AV block |
3.6 Ventricular Tachycardia (VT) and Fibrillation (VF)
Ventricular Tachycardia (VT)
- ≥ 3 consecutive PVCs at rate > 100 bpm
- Wide QRS (≥ 120 ms), bizarre morphology
- AV dissociation (P waves independent of QRS) — pathognomonic
- Capture beats: occasional narrow QRS from sinus capture
- Fusion beats: partial sinus capture
- Monomorphic VT: uniform QRS morphology
- Polymorphic VT: varying QRS morphology
- No RS complex in any precordial lead → VT
- RS interval > 100 ms in any precordial lead → VT
- AV dissociation → VT
- Morphology criteria (LBBB/RBBB pattern) → VT
Torsades de Pointes
- Polymorphic VT with twisting QRS axis around baseline
- Occurs with prolonged QTc
- Causes: drugs (antiarrhythmics, antipsychotics, antibiotics), hypokalemia, hypomagnesemia, congenital long QT
Ventricular Fibrillation (VF)
- Chaotic, irregular waveform — no identifiable QRS, P, or T
- Immediately life-threatening → defibrillation required
3.7 Bundle Branch Blocks
| Feature | RBBB | LBBB |
|---|---|---|
| QRS duration | ≥ 120 ms | ≥ 120 ms |
| V1 morphology | rSR' ("rabbit ears") | Broad, notched rS or QS |
| V6 morphology | Wide S wave (slurred) | Broad, notched R (no S) |
| T wave | Discordant in V1–V2 | Discordant in V5–V6 |
| Clinical significance | Often benign; can indicate RV strain | Significant; may indicate structural disease |
PART 4: ECG IN ACUTE CORONARY SYNDROME (ACS)
4.1 ACS Spectrum Overview
| Entity | Mechanism | ECG Pattern |
|---|---|---|
| Unstable Angina (UA) | Partial occlusion, no necrosis | ST depression, T inversion, or normal |
| NSTEMI | Partial/subendocardial necrosis | ST depression, T inversion; no ST elevation |
| STEMI | Complete transmural occlusion | ST elevation, evolving Q waves |
4.2 ECG Evolution in STEMI
| Phase | Time | ECG Changes |
|---|---|---|
| Hyperacute | Minutes | Tall, peaked "hyperacute" T waves (first sign) |
| Acute | Hours | ST elevation (convex upward / "tombstone") |
| Evolving | Hours–days | T-wave inversion; Q waves begin to form |
| Established | Days–weeks | Pathological Q waves; T waves may normalize |
| Old/Chronic | Weeks–months | Persistent Q waves; ST returns to baseline |
4.3 ST Elevation — Diagnostic Criteria (STEMI)
- ≥ 1 mm (0.1 mV) in ≥ 2 contiguous limb leads
- ≥ 2 mm in ≥ 2 contiguous precordial leads (V1–V4)
- ≥ 1.5 mm in V2–V3 in women
4.4 Localization of Infarction
| Territory | Occluded Artery | Leads with ST Changes | Reciprocal Changes |
|---|---|---|---|
| Anterior | LAD (proximal) | V1–V4 | None or I, aVL |
| Anteroseptal | LAD | V1–V3 | — |
| Anterolateral | LAD or LCx | V1–V6, I, aVL | II, III, aVF |
| Lateral | LCx or diagonal | I, aVL, V5–V6 | II, III, aVF |
| Inferior | RCA (85%) or LCx (15%) | II, III, aVF | I, aVL, V1–V4 |
| Posterior | RCA or LCx | Tall R + ST depression V1–V3 (mirror image) | ST elevation in V7–V9 |
| Right ventricular | Proximal RCA | ST elevation in V3R–V4R | — |
4.5 Pathological Q Waves
- Duration ≥ 40 ms (≥ 1 small box)
- Depth ≥ 25% of the R wave in the same lead
- Present in ≥ 2 contiguous leads
- May represent transmural scar (old MI) but can also occur in LBBB, LVH, WPW, HOCM
4.6 NSTEMI / Unstable Angina
- Horizontal or downsloping ST depression ≥ 0.5–1 mm in ≥ 2 contiguous leads
- T-wave inversion (symmetric, deep) — Wellens' syndrome: critical LAD stenosis
- Transient ST elevation possible (vasospasm / Prinzmetal's)
- Normal ECG in ~30% of NSTEMI — does NOT exclude diagnosis
- Type A: Biphasic T waves in V2–V3 (less common, ~25%)
- Type B: Deep, symmetric T-wave inversions in V2–V3 (more common, ~75%)
- Pain-free at time of ECG recording
4.7 De Winter T Waves (STEMI Equivalent)
- ST depression at J point + tall, symmetric, hyperacute T waves in precordial leads
- No ST elevation
- Represents proximal LAD occlusion — treat as STEMI equivalent
- Seen in ~2% of LAD occlusions
4.8 Sgarbossa Criteria (STEMI in LBBB)
| Criterion | Score | Sensitivity/Specificity |
|---|---|---|
| Concordant ST elevation ≥ 1 mm (in leads with positive QRS) | 5 pts | High specificity |
| Concordant ST depression ≥ 1 mm in V1–V3 | 3 pts | High specificity |
| Excessively discordant ST elevation ≥ 5 mm | 2 pts | Moderate |
4.9 Right Ventricular Infarction (RVI)
- Complicates inferior STEMI (proximal RCA occlusion)
- Right-sided leads are essential:
- ST elevation ≥ 1 mm in V4R = diagnostic
- Clinical triad: hypotension + elevated JVP + clear lung fields (Kussmaul's sign)
- Important: Avoid nitrates (preload-dependent RV)
QUICK REFERENCE SUMMARY
| Topic | Key ECG Finding |
|---|---|
| RAE | Tall peaked P ≥ 2.5 mm (leads II, III, aVF) |
| LAE | Broad notched P ≥ 120 ms; deep negative terminal in V1 |
| RVH | Dominant R in V1, RAD, strain V1–V3 |
| LVH | SV1 + RV5/V6 ≥ 35 mm; strain V5–V6; LAD |
| PAC | Premature P', narrow QRS, incomplete compensatory pause |
| PVC | Wide QRS, no P, full compensatory pause |
| AF | No P waves, irregularly irregular RR |
| A-flutter | Sawtooth 300 bpm, 2:1 block → rate ~150 |
| VT | Wide QRS > 120 ms, AV dissociation, rate > 100 |
| STEMI | ST elevation ≥ 1–2 mm in ≥ 2 contiguous leads, evolving Q waves |
| NSTEMI | ST depression, T inversion, no Q waves |
| Posterior MI | Tall R + ST depression V1–V3 (mirror image) |
Sources: Harrison's Principles of Internal Medicine, 21st Edition (pp. 6787, 6796); Braunwald's Heart Disease; AHA/ACC STEMI Guidelines 2013 (updated 2015); ESC ACS Guidelines 2023.
I want all possible diagrams / image for above every topic
normal ECG waveform P wave QRS T wave intervals labeled diagram
right atrial enlargement left atrial enlargement P wave ECG
left ventricular hypertrophy ECG voltage criteria strain pattern
right ventricular hypertrophy ECG dominant R wave V1 right axis deviation
Medical education diagram of a normal ECG cardiac cycle showing all labeled components: P wave (atrial depolarization), PR interval, QRS complex (ventricular depolarization) with Q R S labeled individually, J point, ST segment, T wave (ventricular repolarization), U wave, QT interval, and RR interval. Include a grid background with time markings (0.04s per small square, 0.2s per large square). Clean, annotated, black on white clinical illustration style.
Medical ECG diagram comparing normal P wave vs right atrial enlargement (P pulmonale - tall peaked P wave ≥2.5mm in lead II) vs left atrial enlargement (P mitrale - broad notched bifid P wave ≥120ms in limb leads, and biphasic P wave with deep terminal negative component in V1). Three side-by-side ECG strip panels clearly labeled. Educational clinical illustration.
Medical education ECG diagram of right ventricular hypertrophy (RVH) showing: dominant R wave in V1 (R/S ratio >1), deep S wave in V5-V6, right axis deviation (negative QRS in lead I), ST depression and T wave inversion in V1-V3 (strain pattern), qR pattern in V1. Full 12-lead ECG layout with annotations pointing to each diagnostic feature. Clinical illustration style.
Medical education ECG diagram of left ventricular hypertrophy (LVH) showing: tall R wave in V5/V6, deep S wave in V1 (Sokolow-Lyon criteria SV1+RV5 ≥35mm), left axis deviation, ST depression and asymmetric T wave inversion in lateral leads I, aVL, V5-V6 (LV strain pattern), tall R in aVL ≥11mm. Annotated 12-lead ECG layout with measurement lines and labels. Clinical illustration.