Explain the pathogenesis of hypertension in flowchart
Reading File
Finding Sources
Finding Sources
Reading File
Reading File
Reading File
Loading Image
Reading File
Reading File
Generating Image
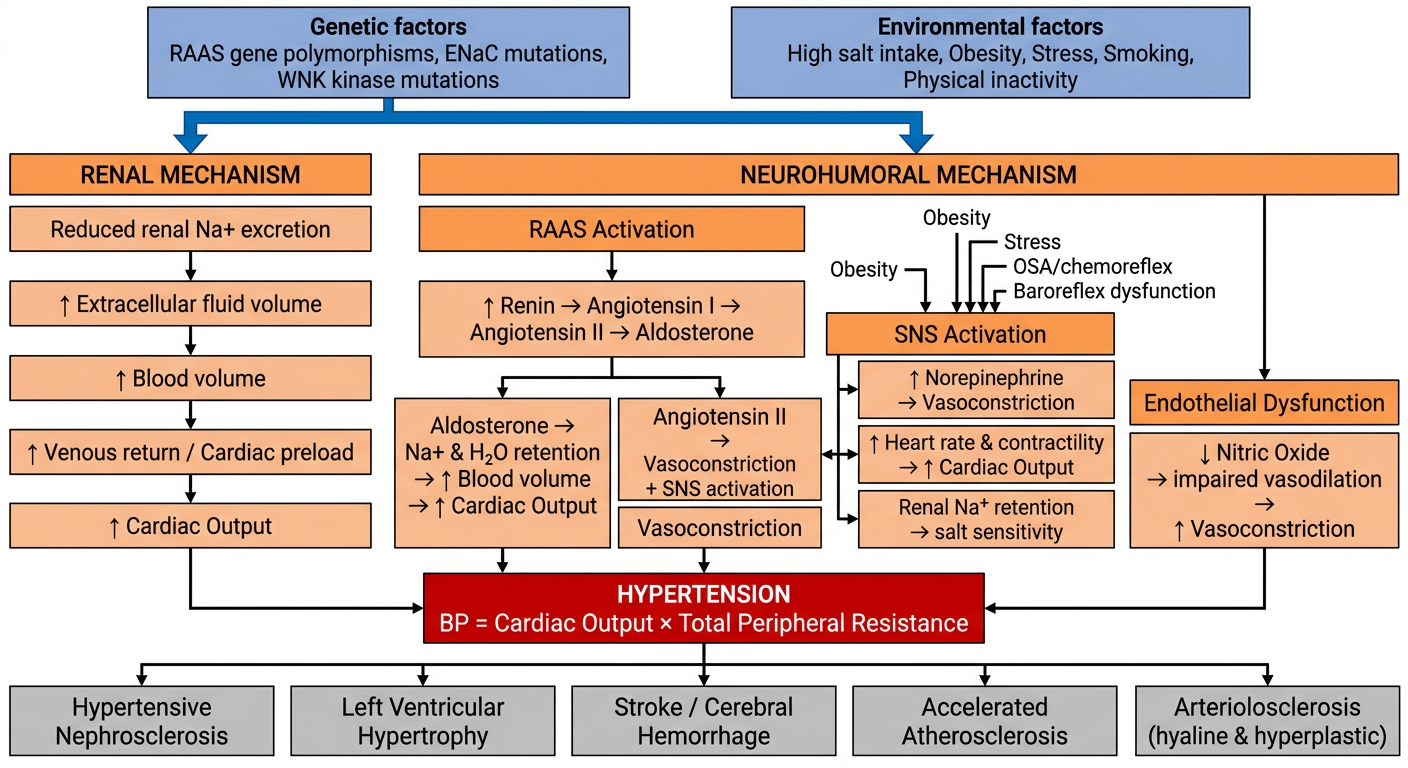
Pathogenesis of Hypertension - Explained
Here is a step-by-step breakdown of each pathway in the flowchart:
1. Starting Point: Risk Factors
Genetic factors:
- Polymorphisms in the angiotensinogen gene and AT1 receptors alter RAAS responsiveness
- Monogenic causes (e.g., Liddle syndrome - gain-of-function ENaC mutations; Gordon syndrome - WNK kinase mutations causing increased NCC activity) all share one common feature: defective renal sodium handling
- GWAS studies have identified >100 risk loci, though each contributes only ~0.5-1 mmHg
Environmental factors:
- High salt intake, obesity, stress, smoking, physical inactivity
- Obesity is particularly relevant - it drives both SNS hyperactivity and RAAS activation via insulin resistance and excess leptin
2. Two Core Mechanisms Driving BP Up
A. Renal Mechanism (Pressure Natriuresis Reset)
"Reduced renal sodium excretion in the presence of normal arterial pressure is probably a key pathogenic feature - this is a common etiologic factor in most forms of hypertension." - Robbins & Kumar Basic Pathology
- Impaired Na+ excretion → ↑ ECF volume → ↑ blood volume → ↑ venous return → ↑ Cardiac Output (CO)
- The kidney eventually excretes more Na+ at the new higher BP (pressure natriuresis), establishing a new steady state at the cost of sustained hypertension
B. Neurohumoral Mechanism
RAAS Activation:
- Low renal perfusion / low Na+ delivery → juxtaglomerular cells release Renin
- Renin cleaves angiotensinogen → Angiotensin I
- ACE converts Ang I → Angiotensin II
- Ang II acts via AT1 receptors to:
- Cause direct vasoconstriction (↑ SVR)
- Stimulate aldosterone release from adrenal cortex → Na+/H2O retention → ↑ blood volume → ↑ CO
- Promote SNS activation
- Drive endothelial dysfunction and vascular remodeling
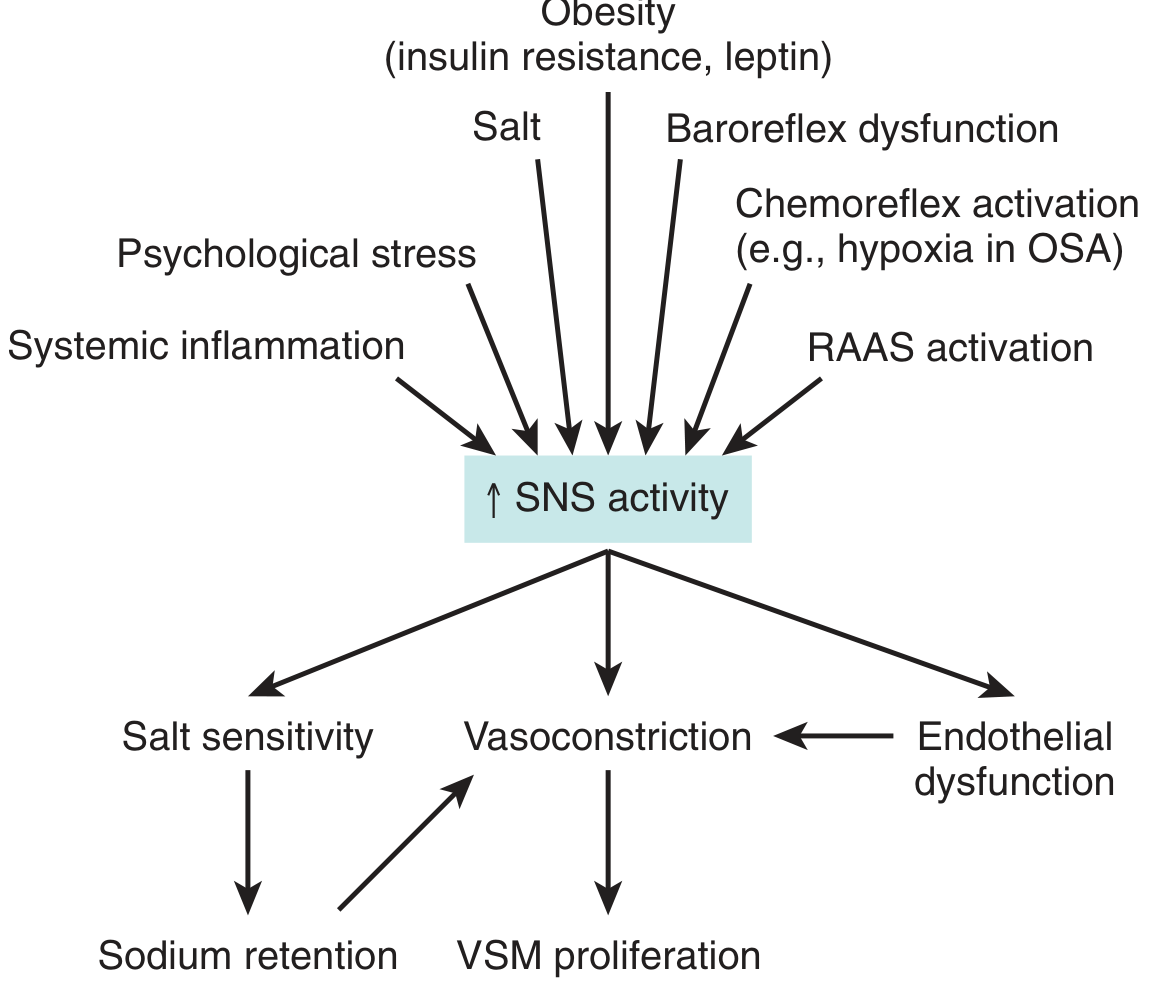
SNS Activation (see textbook diagram above):
Triggered by: obesity (leptin/insulin resistance), RAAS activation, psychological stress, baroreflex dysfunction, chemoreflex activation (e.g., OSA/hypoxia), systemic inflammation, high salt
Consequences of ↑ SNS activity:
- ↑ Norepinephrine → vasoconstriction → ↑ Total Peripheral Resistance (TPR)
- ↑ Heart rate & contractility → ↑ CO
- Renal Na+ retention → salt sensitivity
- Vascular smooth muscle (VSM) proliferation → structural thickening → permanent ↑ TPR
Endothelial Dysfunction:
- ↓ Nitric oxide (NO) production → impaired vasodilation → ↑ vasoconstriction
- Enhanced by Ang II, oxidative stress, and aldosterone
3. Final Common Pathway
BP = Cardiac Output × Total Peripheral Resistance
Both limbs converge here:
- ↑ CO (from volume expansion and SNS-driven cardiac effects)
- ↑ TPR (from vasoconstriction, endothelial dysfunction, and structural vascular remodeling)
Young patients tend to have ↑ CO-predominant hypertension; older patients develop ↑ TPR-predominant hypertension with vascular stiffening.
4. End-Organ Consequences
| Organ | Consequence |
|---|---|
| Kidney | Hypertensive nephrosclerosis (hyaline arteriolosclerosis → glomerulosclerosis) |
| Heart | Left ventricular hypertrophy, heart failure, coronary artery disease |
| Brain | Stroke, cerebral hemorrhage, lacunar infarcts |
| Vasculature | Accelerated atherosclerosis, aortic dissection |
| Small vessels | Hyaline arteriolosclerosis (benign HTN) or hyperplastic "onion-skin" arteriolosclerosis (malignant HTN) |
Key Diagram from Brenner & Rector's The Kidney
Here is the textbook figure showing SNS activation as a central hub in hypertension pathogenesis:
Sources: Robbins & Kumar Basic Pathology, p.311 | Brenner & Rector's The Kidney, p.2049 | National Kidney Foundation Primer on Kidney Diseases, 8e
This is a shared conversation. Sign in to Orris to start your own chat.