
Why my mind is flooding with random memes and content
why brain floods with random memes intrusive thoughts social media overstimulation psychology
https://pmc.ncbi.nlm.nih.gov/articles/PMC11939997
"social media" AND "attention" AND cognition
- Stress, anxiety, or poor sleep make intrusive/random thoughts more frequent and harder to dismiss.
- Multitasking habits (scrolling while doing other things) train the brain toward fragmented rather than sustained attention.
- In some cases, persistent, distressing, or repetitive intrusive thoughts (not just meme flashbacks) can be a feature of anxiety, OCD, or ADHD-related attentional difficulties - worth a conversation with a clinician if it's distressing, unwanted, or interfering with daily function, rather than just mildly annoying.
- Scheduled "no-scroll" blocks and deliberately boring downtime (lets the reward loop de-sensitize)
- Single-tasking practice (reading, walks without a phone) to rebuild sustained attention
- Reducing short-form video specifically, since its rapid-reward density is the strongest driver of this effect
- Basic sleep and stress management, since fatigue lowers your ability to filter intrusive thoughts
Hyperkalemia
hyperkalemia treatment
ECG changes hyperkalemia peaked T waves widened QRS
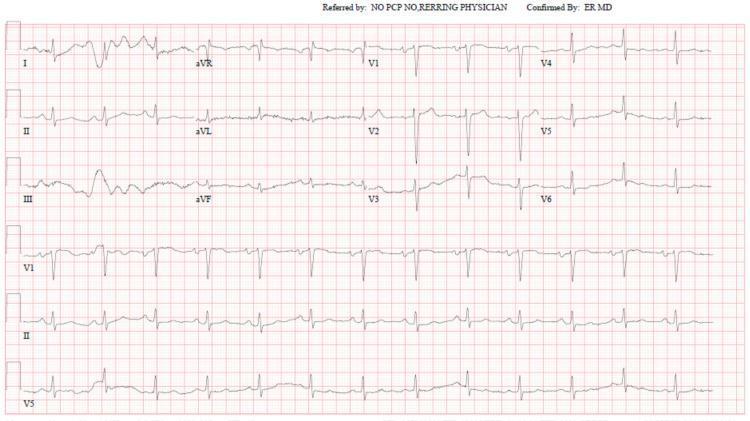
This diagnostic image is a standard 12-lead electrocardiogram (ECG) displayed on a red grid background. The tracing includes the limb leads (I, II, III, aVR, aVL, aVF) and precordial leads (V1-V6), along with rhythm strips for V1, II, and V5 at the bottom. The rhythm demonstrates a normal sinus rhythm with clearly visible, upright P waves in leads I, II, and V4-V6. The QRS complexes are narrow, and there is a normal R-wave progression from V1 through V6. The ST segments are isoelectric, and the T waves are largely upright, showing no acute signs of ischemia, infarction, or the classic manifestations of hyperkalemia (such as peaked T waves or widened QRS complexes). This ECG serves as a clinical example of a 'normal' tracing in a patient with pseudo-hyperkalemia, illustrating the absence of cardiac electrophysiological changes despite laboratory reports of severely elevated serum potassium levels. It is an important educational tool for medical professionals to differentiate between true electrolyte-induced cardiac emergencies and laboratory artifacts in the context of hematologic malignancies like chronic lymphocytic leukemia.
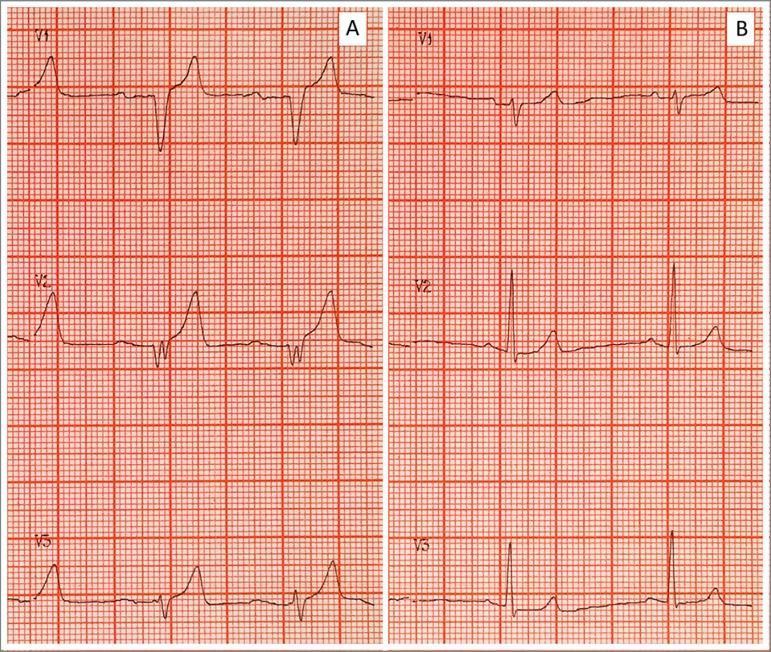
Side-by-side comparison of two electrocardiogram (ECG) tracings (A and B) demonstrating the classic cardiotoxic evolution and subsequent resolution of severe hyperkalemia. Panel A (Pretreatment) displays several pathognomonic findings including prominent, tall, tented, or 'peaked' T-waves; significant flattening and widening of the P-waves; a prolonged PR interval; and a widened QRS complex with a 'sine-wave' appearance in certain leads. These features reflect impaired atrial and ventricular conduction and delayed repolarization associated with elevated serum potassium (e.g., 9.25 mEq/L). Panel B (Post-treatment) shows the results of medical intervention (such as calcium gluconate, insulin/glucose, and bicarbonate), characterized by the normalization of the ECG morphology. Key changes in Panel B include the return of distinct P-waves, narrowing of the QRS complex to normal duration, and a reduction in T-wave amplitude to a typical physiological morphology. The images are shown on standard ECG grid paper, facilitating the assessment of interval and complex durations.
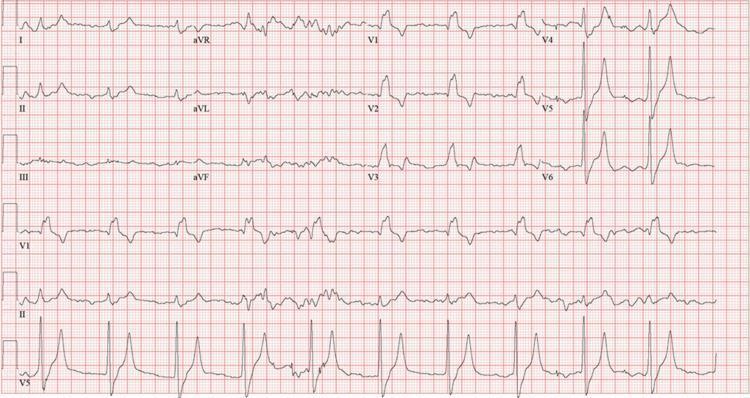
A 12-lead electrocardiogram (ECG) demonstrating several conduction abnormalities and metabolic-related changes. Key findings include a significantly widened QRS complex across all leads, exceeding 120 ms, consistent with a bundle branch block morphology; specifically, a right bundle branch block (RBBB) pattern is suggested by the RSR' morphology in V1. Additionally, the precordial leads, particularly V4 and V5, exhibit prominent, symmetrically peaked (tent-shaped) T waves, which are a characteristic visual indicator of hyperkalemia. The rhythm shows a prolonged PR interval, indicating a first-degree atrioventricular (AV) block. The tracing is presented on standard grid paper for the measurement of intervals and amplitudes. This ECG serves as a clinical teaching tool for identifying the cardiac manifestations of electrolyte imbalances (like high potassium levels) and concurrent intraventricular conduction delays.
Hyperkalemia
Causes
- Hemolysis during venipuncture, fist clenching/tourniquet use during draw
- Marked thrombocytosis, leukocytosis, or erythrocytosis (K+ released from cells during clotting)
- Sample contamination with K+-EDTA anticoagulant
- Metabolic acidosis
- Insulin deficiency, hyperglycemia
- Massive cell breakdown: rhabdomyolysis, tumor lysis syndrome, hemolysis, burns, crush injury
- Beta-blockade, digoxin toxicity (inhibits Na-K-ATPase)
- Succinylcholine (especially with neuromuscular disease/burns)
- Exercise, fasting in dialysis patients
- Acute kidney injury or CKD/ESKD (renal failure is the most common cause seen in the ER)
- Hypoaldosteronism / adrenal insufficiency
- Drugs: ACE inhibitors, ARBs, mineralocorticoid receptor antagonists (spironolactone), NSAIDs (suppress renin-aldosterone axis), K+-sparing diuretics (amiloride, triamterene), trimethoprim, calcineurin inhibitors (cyclosporine, tacrolimus), heparin
Clinical features and ECG changes
- Skeletal muscle weakness, occasionally progressing to flaccid paralysis and respiratory failure
- Cardiac conduction disturbances - the dangerous part
Treatment (three-stage approach)
- IV calcium gluconate 10 mL of 10% solution over 2-3 minutes (or calcium chloride via central line) - onset ~1-3 min, lasts 30-60 min; repeat if no ECG improvement in 5 minutes. Use cautiously in patients on digoxin (hypercalcemia potentiates digoxin toxicity) - Harrison's, Schwartz's Principles of Surgery.
- IV regular insulin (10 units) with 50 mL of 50% dextrose (D50) to prevent hypoglycemia, followed by a dextrose infusion; onset ~15-30 min, peaks 30-60 min, lasts 4-6 hours. Never give dextrose without insulin for treating hyperkalemia.
- Nebulized/IV beta-2 agonists (albuterol) as an adjunct
- Sodium bicarbonate - only useful if there's concurrent metabolic acidosis
- Loop diuretics (furosemide) plus volume if patient has some renal function
- Potassium-binding agents: sodium polystyrene sulfonate (Kayexalate, older agent with GI necrosis risk), patiromer (Veltassa), or sodium zirconium cyclosilicate (Lokelma) - newer agents, better tolerated, but onset is hours, not for acute emergencies
- Hemodialysis - the most effective and rapid definitive treatment, especially in ESKD/AKI or when other measures fail
A note on recent evidence
Does both adrenaline and not adrenaline increase heart rate
Adrenaline (epinephrine)
Noradrenaline (norepinephrine)
- Direct effect on the heart: noradrenaline increases rate and contractility (beta-1)
- Net effect in an intact person with working baroreflexes: heart rate often stays unchanged or drops (reflex bradycardia), even though cardiac contractility/inotropy stays increased - Katzung's Basic and Clinical Pharmacology.
Summary
| Direct cardiac receptor effect | Net heart rate in vivo | |
|---|---|---|
| Adrenaline | Beta-1 (+ beta-2 vasodilation limits BP rise) | Increases |
| Noradrenaline | Beta-1 (but alpha-1 vasoconstriction dominates) | Often unchanged or reflexively decreased, despite direct chronotropic potential |