
measure of mortality morbidity
Reading File
Measures of mortality and morbidity are the core tools of epidemiology used to quantify death and disease in populations. Mortality measures include crude death rate, cause-specific death rates, case fatality rate, and standardized mortality ratio. Morbidity measures include incidence rate, prevalence (point and period), attack rate, and secondary attack rate.
Searching sources...
Finding Sources
Finding Sources
Finding Sources
Finding Sources
Reading File
Finding Sources
Reading File
Finding Sources
Reading File
Finding Sources
Reading File
Finding Sources
Reading File
Finding Sources
Reading File
Reading File
I now have comprehensive content from Park's Textbook of Preventive and Social Medicine. Let me compile the full, detailed answer.
Measures of Mortality and Morbidity
(Park's Textbook of Preventive and Social Medicine)
PART A: MEASURES OF MORTALITY
Mortality data are the major resource for the epidemiologist. They provide the starting point for epidemiological studies and are relatively easy to obtain.
1. Crude Death Rate (CDR)
The simplest measure of mortality.
"Number of deaths (from all causes) per 1000 estimated mid-year population in one year, in a given place."
Formula:
CDR = (Number of deaths during the year / Mid-year population) × 1000
Limitation: The CDR is influenced by the age composition of the population. A younger population may have a lower CDR even if age-specific death rates are higher. This makes direct comparison between populations misleading.
2. Specific Death Rates
Used when analysis is planned to throw light on aetiology.
Types:
- Cause-specific (e.g., TB death rate, cancer death rate)
- Age-specific (most useful single measure of mortality)
- Sex-specific
- Age-sex specific
Example formulas:
| Rate | Formula |
|---|---|
| TB-specific death rate | Deaths from TB / Mid-year population × 1000 |
| Male-specific death rate | Deaths among males / Mid-year male population × 1000 |
| Age-specific (15-20 yr) | Deaths aged 15-20 / Mid-year pop aged 15-20 × 1000 |
Age-specific death rates are the most useful single measures of mortality and permit comparisons between causes within the same population.
3. Case Fatality Rate (CFR)
An index of severity of a disease.
CFR = (Number of deaths from a disease / Number of cases of that disease) × 100
Expressed as a percentage. It represents the killing power of a disease. Useful for comparing the severity of different epidemics or assessing treatment outcomes.
4. Proportional Mortality Rate (PMR)
Expresses deaths from a specific cause as a proportion of all deaths.
PMR = (Deaths from specific disease in a year / Total deaths from all causes in that year) × 100
Variants:
- (a) Disease-specific PMR - proportion of deaths from a specific disease
- (b) Under-5 PMR - deaths under 5 years / total deaths × 100
- (c) 50+ PMR - deaths ≥50 years / total deaths × 100
Note: PMR does not indicate the risk of contracting or dying from the disease - it only indicates relative importance within a population. It is used when population data are not available.
5. Survival Rate
Survival rate = (Total patients alive after 5 years / Total patients diagnosed or treated) × 100
Describes prognosis, especially in cancer. The survival period is reckoned from the date of diagnosis or start of treatment.
6. Adjusted / Standardized Rates
Used to compare death rates between populations with different age compositions. Two methods:
A. Direct Standardization
- Applies the age-specific death rates of each study population to a common standard population
- Produces "expected" deaths; calculates what the crude rate would be if both populations had the same age structure
B. Indirect Standardization - Standardized Mortality Ratio (SMR)
SMR = (Observed deaths / Expected deaths) × 100
- Expected deaths = what would occur if the study group had the national (standard population) death rates
- SMR > 100 = unfavourable mortality experience (excess mortality)
- SMR < 100 = favourable mortality experience
Example: Coal workers had SMR = 129, meaning their mortality was 29% more than the national population.
7. Special Mortality Rates
| Rate | Definition | Formula |
|---|---|---|
| Infant Mortality Rate (IMR) | Deaths under 1 year per 1000 live births | Deaths < 1 yr / Live births × 1000 |
| Neonatal Mortality Rate | Deaths in first 28 days per 1000 live births | Deaths < 28 days / Live births × 1000 |
| Perinatal Mortality Rate | Still births + early neonatal deaths per 1000 total births | (Still births + deaths < 7 days) / Total births × 1000 |
| Under-5 Mortality Rate (U5MR) | Deaths under 5 years per 1000 live births | Deaths < 5 yr / Live births × 1000 |
| 1-4 Year Mortality Rate | Deaths in children 1-4 years old per 1000 in that age group | Deaths aged 1-4 / Mid-year pop aged 1-4 × 1000 |
The IMR is widely used as a sensitive indicator of the health status of a community and the level of socioeconomic development.
PART B: MEASURES OF MORBIDITY
Morbidity is defined as "any departure, subjective or objective, from a state of physiological well-being."
The WHO Expert Committee noted morbidity can be measured in terms of:
- (a) Persons who were ill
- (b) The illnesses (spells of illness) they experienced
- (c) The duration of those illnesses
Three aspects are measured:
| Aspect | Measure |
|---|---|
| Frequency | Incidence rate, Prevalence rate |
| Duration | Disability rate (avg. days of disability/person) |
| Severity | Case fatality rate |
1. Incidence Rate
"The number of NEW cases occurring in a defined population during a specified period of time."
Formula:
Incidence = (New cases of specific disease during a given time period / Population at-risk during that period) × 1000
Example: 500 new cases in population of 30,000 in a year = 16.7 per 1,000 per year
Key points:
- Must always include the unit of time (e.g., "per year")
- Refers only to NEW cases (not old/existing)
- Denominator = population at risk (those susceptible)
- Measures the rate of occurrence of new disease
2. Prevalence Rate
Measures all cases (new + old) existing at a point in time or during a period.
(a) Point Prevalence
"Number of all current cases (new + old) of a disease at one point in time per total population at that point."
Point prevalence = (All cases at a point in time / Total population at that time) × 1000
(b) Period Prevalence
"Number of cases existing at any time during a specified period of time per mid-period population."
Period prevalence = (All cases existing during a period / Mid-period population) × 1000
Period prevalence = Point prevalence at start of period + New cases (incidence) arising during the period
3. Relationship Between Incidence and Prevalence
P = I × D (Prevalence = Incidence × Mean duration of disease)
- Long-duration diseases (e.g., tuberculosis, diabetes) have high prevalence relative to incidence
- Acute short-duration diseases (e.g., food poisoning) or rapidly fatal diseases have low prevalence
- Improved treatment that cures disease quickly → decreases prevalence
- Improved treatment that prevents death but not cure → increases prevalence (paradox)
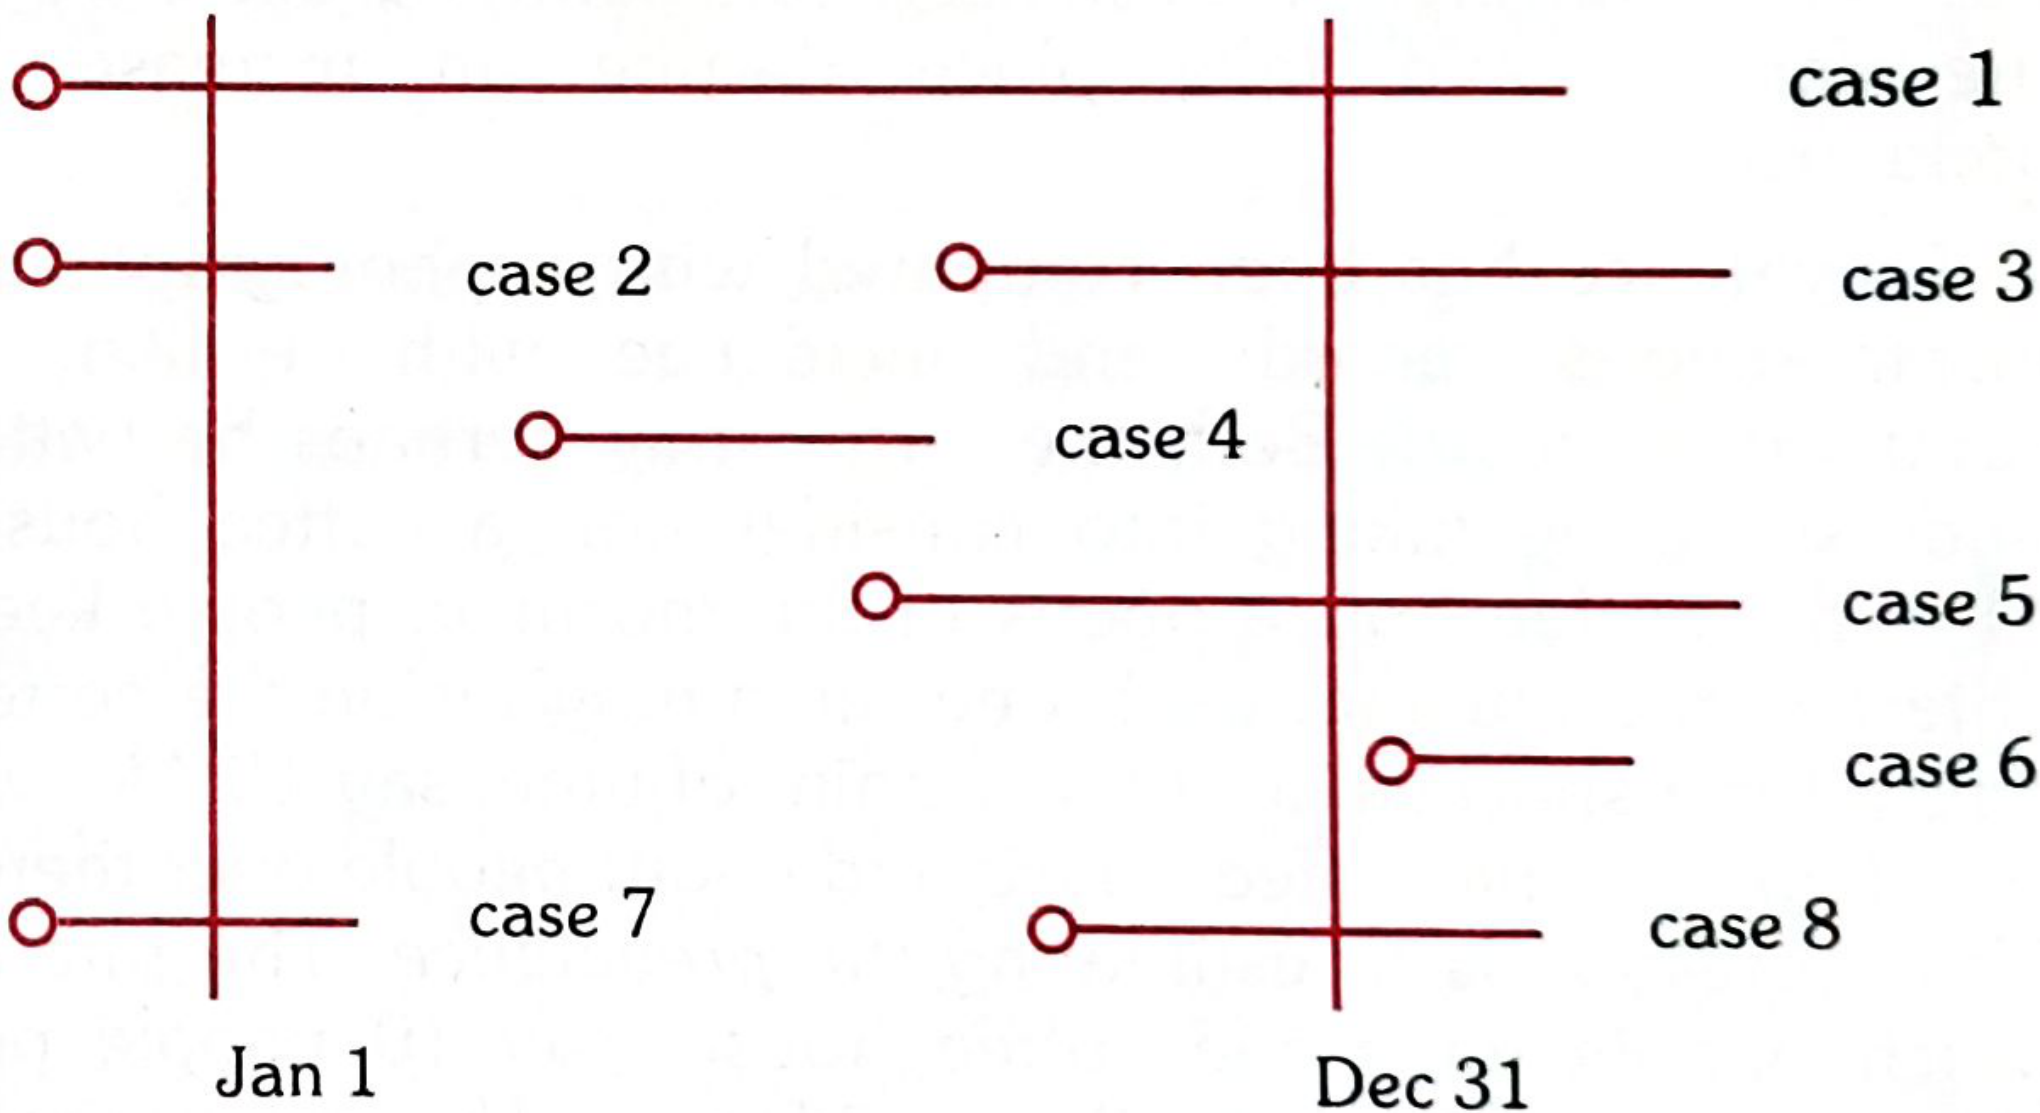
Cases 3, 4, 5, 8 = Incidence (new cases in the year) | Cases 1, 2, 7 = Point prevalence on Jan 1 | Cases 1, 2, 3, 4, 5, 7, 8 = Period prevalence (Jan-Dec)
4. Attack Rate
A special form of incidence used in epidemic/outbreak investigations.
Attack rate = (Number of new cases among exposed / Total population exposed) × 100
Expressed as a percentage. Used for acute, short-term exposures (e.g., foodborne outbreaks). Not truly a "rate" (no time unit needed) - more a proportion or risk.
Secondary Attack Rate (SAR)
Measures spread within households or close contacts:
SAR = (Number of cases among contacts in the incubation period / Total susceptible contacts) × 100
5. Other Morbidity Measures
| Measure | Description |
|---|---|
| Disability rate | Average number of days of disability per person per year |
| Bed disability days | Days confined to bed due to illness |
| Work-loss rate | Days lost from work due to illness per working population |
| Hospital admission rate | Admissions per 1000 population per year |
Summary Comparison Table
| Measure | What it counts | Denominator | Expressed per |
|---|---|---|---|
| Crude Death Rate | All deaths | Mid-year population | 1,000 |
| Age-specific Death Rate | Deaths in specific age group | Mid-year pop of that age group | 1,000 |
| Cause-specific Death Rate | Deaths from one cause | Mid-year population | 100,000 |
| Case Fatality Rate | Deaths from disease / cases | Cases of that disease | 100 (%) |
| Proportional Mortality Rate | Deaths from cause / all deaths | Total deaths | 100 (%) |
| SMR | Observed / Expected deaths | Expected deaths (standard pop) | 100 (index) |
| Incidence Rate | New cases in period | Population at risk | 1,000/year |
| Point Prevalence | All cases at one time | Total population at that time | 1,000 |
| Period Prevalence | All cases over a period | Mid-period population | 1,000 |
| Attack Rate | Cases among exposed | Total exposed | 100 (%) |
| Secondary Attack Rate | New cases in contacts | Susceptible contacts | 100 (%) |
Source: Park's Textbook of Preventive and Social Medicine, Ch. 2 (Epidemiology - Measurements)
This is a shared conversation. Sign in to Orris to start your own chat.