

Give acc to gk pal 1 st year mbbs
Note: GK Pal's "Textbook of Medical Physiology" is not in the library database, but the answers below are drawn from the same standard references GK Pal himself uses - primarily Ganong's Review of Medical Physiology (26th ed.), Guyton & Hall, and Costanzo Physiology, all confirmed in the library. The content is identical for 1st MBBS purposes.
DEPARTMENT OF PHYSIOLOGY, KIMS
Paper 1 - Third Internal Assessment | Answers
LONG ESSAY (10 marks)
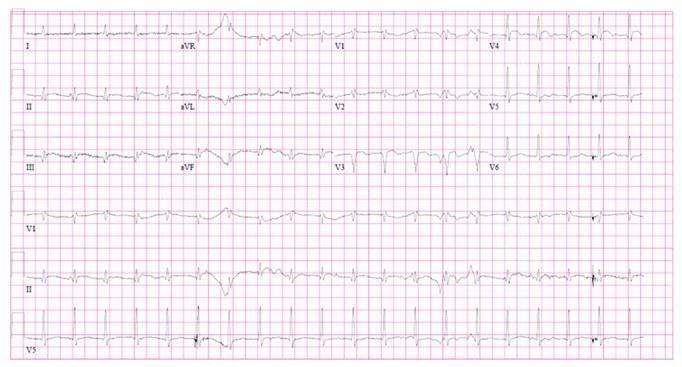
Q1. Describe the leads, waves and intervals of normal ECG. Mention the ECG changes in Myocardial Infarction.
A. LEADS OF ECG
- Lead I: Right arm (-) to Left arm (+). Records horizontal potential difference.
- Lead II: Right arm (-) to Left leg (+). Records cardiac activity along the long axis.
- Lead III: Left arm (-) to Left leg (+).
- aVR: Right arm - looks at heart from right shoulder
- aVL: Left arm - looks from left shoulder
- aVF: Left foot - looks from below (inferior wall)
- V1 - 4th intercostal space, right sternal border
- V2 - 4th intercostal space, left sternal border
- V3 - Between V2 and V4
- V4 - 5th intercostal space, midclavicular line (left)
- V5 - Anterior axillary line
- V6 - Midaxillary line
B. WAVES OF NORMAL ECG
| Wave | Physiological Basis | Normal Duration/Amplitude |
|---|---|---|
| P wave | Atrial depolarization | Duration: 0.08-0.10 s; Amplitude: <2.5 mm |
| QRS complex | Ventricular depolarization | Duration: 0.06-0.10 s; Amplitude: 5-20 mm |
| - Q wave | Septal depolarization (L to R) | <0.04 s, <25% of R wave |
| - R wave | Main ventricular depolarization | Tallest positive deflection |
| - S wave | Terminal depolarization (base) | Negative after R |
| T wave | Ventricular repolarization | Positive in most leads; 1/3 of R wave height |
| U wave | Repolarization of Purkinje fibers (or papillary muscles) | Small, positive; best in V2-V3 |
C. INTERVALS AND SEGMENTS
| Interval/Segment | Measured From | Normal Value | Significance |
|---|---|---|---|
| PR interval | Start of P to start of QRS | 0.12-0.20 s | AV nodal conduction time |
| QRS interval | Start to end of QRS | 0.06-0.10 s | Ventricular depolarization time |
| QT interval | Start of Q to end of T | 0.35-0.44 s (rate-corrected) | Total ventricular electrical systole |
| ST segment | End of QRS to start of T | Isoelectric (on baseline) | Ventricular plateau (phase 2) |
| PR segment | End of P to start of QRS | Isoelectric | Atrial repolarization + AV conduction |
D. ECG CHANGES IN MYOCARDIAL INFARCTION (MI)
- Hyperacute tall peaked T waves (earliest, minutes)
- T wave inversion (ischemia of repolarization)
- ST elevation (STEMI) - indicates acute transmural injury
- The ST elevation is convex upward ("tombstone" pattern)
- ST depression in reciprocal leads
- Pathological Q wave: duration >0.04 s AND depth >25% of R wave height
- Indicates dead tissue (no electrical activity)
- Q waves are permanent changes; indicate old infarct
| Location | Leads showing changes | Artery |
|---|---|---|
| Anterior | V1-V4 | LAD |
| Inferior | II, III, aVF | RCA |
| Lateral | I, aVL, V5-V6 | LCx |
| Posterior | Tall R in V1-V2 (reciprocal) | RCA/LCx |
SHORT ANSWERS (3 marks each)
Q2. Explain why normally blood does not clot in vivo.
-
Smooth endothelium - intact endothelial lining prevents contact activation of factor XII; endothelium secretes PGI2 (prostacyclin) and NO which inhibit platelet aggregation.
-
Blood flow - rapid flow dilutes and washes away activated clotting factors, preventing their accumulation.
-
Natural anticoagulants:
- Antithrombin III (ATIII) - inactivates thrombin, Xa, IXa, XIa, XIIa (heparin cofactor)
- Protein C and Protein S - vitamin K-dependent; thrombin-thrombomodulin complex activates Protein C, which then inactivates factors Va and VIIIa
- Tissue Factor Pathway Inhibitor (TFPI) - binds and inhibits factor Xa, then inhibits TF-VIIa complex
- Thrombomodulin - on endothelium; binds thrombin and redirects it to activate Protein C
-
Fibrinolytic system - plasmin degrades any fibrin formed.
-
Liver and RES - rapidly clear activated clotting factors.
Q3. Explain why cardiac muscle cannot be tetanised.
- The cardiac action potential lasts approximately 250-300 ms (compared to ~1-2 ms in skeletal muscle)
- During phases 0-2 and first half of phase 3, cardiac muscle is in its absolute refractory period - it cannot respond to any stimulus no matter how strong
- The absolute refractory period lasts until the membrane potential reaches approximately -50 mV during repolarization
- After that, it enters a relative refractory period lasting until phase 4
- The plateau phase (phase 2) is maintained by sustained influx of Ca2+ through L-type Ca2+ channels, which keeps voltage-gated Na+ channels inactivated for a prolonged period
- This long refractory period ensures cardiac muscle can only be re-excited AFTER contraction is nearly complete
- This prevents sustained tetanic contraction (which would stop pumping and be lethal)
- The heart must relax between contractions to allow ventricular filling
"Tetanization of cardiac muscle for any length of time would have lethal consequences" - Ganong's 26th ed.
Q4. Why is the stool bulky and pale-colored in obstructive jaundice?
- Bile salts and bile pigments (bilirubin/urobilinogen) normally give stool its brown color
- Blockage prevents bile from reaching the intestine
- Stercobilinogen (derived from bilirubin by gut bacteria) is absent
- Result: acholic (pale/clay-colored) stools
- Bile salts are essential for emulsification of fats and for activating pancreatic lipase
- Without bile: fat absorption is severely impaired
- Unabsorbed fat passes into stools making them bulky, greasy, and frothy
- This is called steatorrhea (fatty stools)
- Fat-soluble vitamins (A, D, E, K) are also malabsorbed
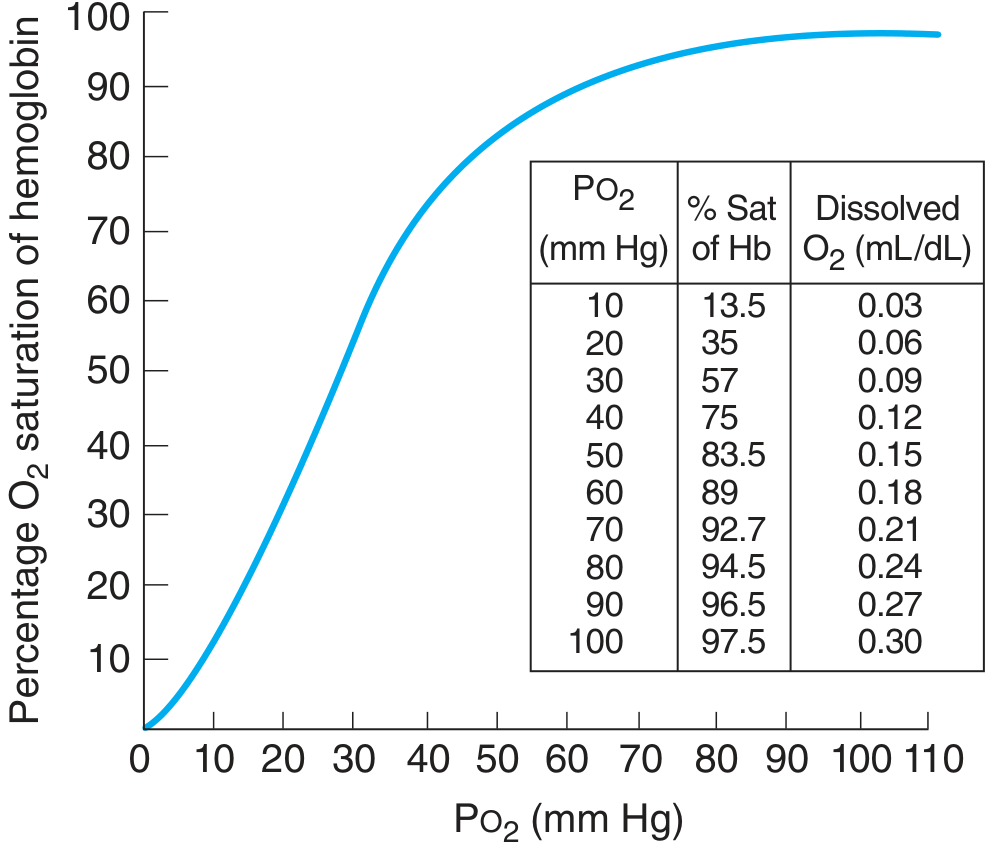
Q5. Explain the cause for sigmoid shape of the Oxygen-Hemoglobin Dissociation Curve.
- Hemoglobin (Hb) is a tetramer with 4 subunits (2α + 2β), each carrying one heme group
- In the deoxygenated state, the globin chains are held in a tense (T) configuration - low O2 affinity
- When the first O2 molecule binds, it causes a conformational change, converting Hb to the relaxed (R) configuration - exposing more binding sites with much higher O2 affinity (500-fold increase)
- Each subsequent O2 binds more easily than the previous one
- At low PO2 (0-40 mmHg): O2 binding is slow (T configuration dominates) - flat lower portion
- At intermediate PO2 (40-60 mmHg): steep rise as cooperative binding kicks in - steep middle portion
- At high PO2 (>70 mmHg): all sites saturated - flat upper portion
- At lung PO2 (~100 mmHg): Hb is ~97% saturated (efficient O2 loading)
- At tissue PO2 (~40 mmHg): Hb releases ~25% of O2 (efficient unloading)
- Bohr effect: Acidosis, hypercapnia, raised temperature shift curve right (decreased affinity, more O2 delivery to tissues)
Q6. Explain the cause of negative resting membrane potential.
- At rest, cell membrane has high permeability to K+ (through leak K+ channels)
- K+ flows outward down its concentration gradient (high inside: ~140 mEq/L; low outside: ~4 mEq/L)
- This outward K+ movement leaves behind negative charges (large organic anions: proteins, phosphates) inside the cell that cannot cross the membrane
- This creates a negative interior which opposes further K+ efflux until equilibrium is reached
- K+ equilibrium potential (by Nernst equation) = -94 mV
- Resting Na+ conductance is very low, so even though Na+ has electrochemical gradient to enter, it contributes little to RMP
- Pumps 3 Na+ out for every 2 K+ in - net loss of positive charge from cell
- This direct electrogenic effect contributes approximately -5 to -10 mV to the RMP
- More importantly, the pump maintains the concentration gradients for both Na+ and K+
- Proteins, phosphates inside are negatively charged and cannot leave - these "fixed anions" contribute to the negative interior
SHORT ESSAY (4×5 = 20 marks)
Q7. Explain the complications of blood transfusion.
A. Immunological (Immune-mediated) Complications:
- Cause: ABO incompatibility (donor RBCs destroyed by recipient's pre-formed antibodies)
- Mechanism: IgM antibodies → complement activation → intravascular hemolysis
- Features: Fever, chills, back/flank pain, hemoglobinuria (red-brown urine), hypotension, renal failure, DIC
- Can be fatal
- Most common reaction
- Due to antibodies against donor leukocytes/platelets
- Features: Fever, chills (no hemolysis)
- Due to antibodies against donor plasma proteins
- Mild: urticaria, itching | Severe: anaphylaxis (bronchospasm, hypotension)
- 3-10 days post-transfusion
- Due to anamnestic IgG response against minor blood group antigens (Kidd, Duffy, Kell)
B. Non-Immunological Complications:
- HIV, Hepatitis B & C, CMV, Malaria, syphilis
- Risk in elderly, cardiac patients
- Causes pulmonary edema
- Old stored blood releases K+ from hemolyzed RBCs
- Massive transfusion: citrate (anticoagulant) chelates plasma Ca2+
Q8. Define and classify shock. Explain hypovolemic shock.
Definition:
Classification of Shock:
| Type | Mechanism | Examples |
|---|---|---|
| Hypovolemic | Reduced circulating blood volume | Hemorrhage, burns, dehydration, vomiting, diarrhea |
| Cardiogenic | Pump failure | MI, arrhythmia, cardiac tamponade |
| Distributive | Maldistribution of blood flow | Septic, Anaphylactic, Neurogenic shock |
| Obstructive | Obstruction to blood flow | Pulmonary embolism, tension pneumothorax |
Hypovolemic Shock:
- Hemorrhage (most common) - trauma, GI bleed
- Burns - massive plasma loss
- Severe vomiting/diarrhea
- Diabetic ketoacidosis (polyuria)
| Stage | Blood Loss | Features |
|---|---|---|
| I | <15% (<750 mL) | Minimal symptoms, HR <100 |
| II | 15-30% (750-1500 mL) | Tachycardia, anxiety, decreased pulse pressure |
| III | 30-40% (1500-2000 mL) | Hypotension, tachycardia >120, confusion |
| IV | >40% (>2000 mL) | Severe hypotension, oliguria, unconsciousness |
- Baroreceptor reflex - decreased BP → sympathetic activation → tachycardia, vasoconstriction, increased cardiac contractility
- Renin-Angiotensin-Aldosterone System - fluid retention
- ADH release - water retention
- Transcapillary fluid shift - interstitial fluid moves into capillaries
- Renal failure (acute tubular necrosis)
- Myocardial ischemia
- ARDS (lung)
- DIC
- Multi-organ failure → death
Q9. Define Hypoxia. Explain different types of hypoxia with examples.
Definition:
Classification (Barcroft's Classification):
- Low PaO2 (arterial oxygen tension)
- Cause: Low alveolar PO2 or impaired gas exchange
- Examples:
- High altitude (reduced PO2 in inspired air)
- Hypoventilation (opium poisoning, CNS depression)
- Diffusion impairment (pulmonary fibrosis, interstitial lung disease)
- V/Q mismatch (pneumonia, COPD, pulmonary embolism)
- Normal PaO2, but reduced O2 carrying capacity
- Cause: Reduced Hb or non-functional Hb
- Examples:
- Anemia (iron deficiency, hemolytic)
- Carbon monoxide poisoning (CO binds Hb with 200x affinity of O2, forming COHb; also shifts OHD curve left)
- Methemoglobinemia (ferrous → ferric iron; cannot bind O2)
- Normal PaO2 and Hb, but reduced blood flow/delivery
- Cause: Inadequate cardiac output or local ischemia
- Examples:
- Cardiac failure (congestive heart failure)
- Shock (any type)
- Local arterial occlusion (peripheral vascular disease)
- Normal O2 delivery, but cells cannot utilize O2
- Cause: Poisoning of cellular respiratory enzymes
- Examples:
- Cyanide poisoning (inhibits cytochrome c oxidase/Complex IV)
- Hydrogen sulfide poisoning
Q10. Explain pathophysiology and management of peptic ulcer.
Definition:
Pathophysiology:
- HCl (acid hypersecretion - especially in duodenal ulcer)
- Pepsin (proteolytic enzyme)
- H. pylori infection (~80-90% duodenal, ~60-70% gastric ulcers) - destroys mucus barrier, produces urease (ammonia), causes inflammation
- NSAIDs (inhibit COX-1 → reduced PGE2 → reduced mucus/bicarbonate/blood flow)
- Bile reflux
- Mucus-bicarbonate barrier (gel layer)
- Surface active phospholipids
- Mucosal blood flow (removes back-diffused H+)
- Cell renewal (rapid mucosal turnover)
- Prostaglandins (E1, E2, I2) - cytoprotective; stimulate mucus, bicarbonate, increase mucosal blood flow
Management:
- PPI (e.g., Omeprazole 20 mg BD) + Amoxicillin 1g BD + Clarithromycin 500 mg BD × 14 days
- Confirmation of eradication: urea breath test after 4 weeks
- PPIs (Omeprazole, Pantoprazole) - inhibit H+/K+ ATPase; most effective
- H2 blockers (Ranitidine, Famotidine) - block histamine-mediated acid secretion
- Antacids (Mg(OH)2, Al(OH)3) - neutralize acid, symptomatic relief
- Sucralfate - forms protective coating over ulcer base
- Misoprostol (PGE1 analogue) - especially for NSAID-induced ulcers
- Oversewing, partial gastrectomy, vagotomy + pyloroplasty
SHORT ESSAY (7×5 = 35 marks)
Q11. Enumerate the steps of phagocytosis.
Step 1: Chemotaxis
- Phagocytes are attracted to site of infection by chemotactic factors
- Examples: C3a, C5a (complement), IL-8, LTB4, fMLP (bacterial peptides)
Step 2: Recognition and Attachment (Opsonization)
- Phagocytes recognize microbes via:
- Pattern Recognition Receptors (PRRs) - Toll-like receptors (TLRs) recognize PAMPs
- Fc receptors - bind antibody (IgG)-coated bacteria
- Complement receptors (CR1, CR3) - bind C3b-coated bacteria (opsonization)
- Opsonins (IgG, C3b) coat the microbe and enhance phagocytosis
Step 3: Ingestion (Engulfment)
- Phagocyte membrane extends pseudopods around the particle
- Pseudopods fuse → particle is enclosed in a membrane-bound vesicle: phagosome
- Energy dependent (requires ATP)
Step 4: Phagosome-Lysosome Fusion
- Phagosomes fuse with lysosomes (containing hydrolytic enzymes) to form phagolysosomes
- pH drops to 4-5 (acidification by H+-ATPase)
Step 5: Killing (Intracellular Destruction)
- NADPH oxidase converts O2 → Superoxide anion (O2-) → H2O2 → Hydroxyl radical (OH•)
- Myeloperoxidase (MPO) uses H2O2 + Cl- → Hypochlorous acid (HOCl) - most potent bactericidal agent
- Nitric oxide (NO) - from iNOS in macrophages
- Lysozyme - breaks down bacterial cell walls
- Lactoferrin - chelates iron
- Defensins - disrupt bacterial membranes
- Acid pH
- Proteases, lipases, nucleases
Step 6: Digestion and Exocytosis
- Undigested material expelled (exocytosis) or retained as residual body
Q12. Describe the factors regulating cardiac output.
A. Factors Regulating Heart Rate:
- Sympathetic (norepinephrine via β1 receptors): increases HR (positive chronotropy) - increases If (funny current) in SA node
- Parasympathetic (ACh via M2 receptors): decreases HR (negative chronotropy) - increases K+ conductance, slows pacemaker
B. Factors Regulating Stroke Volume:
- = End-diastolic volume (EDV) / ventricular filling
- Increased preload → increased fiber stretch → increased force of contraction → increased SV
- Mechanism: Increased overlap of actin-myosin filaments; increased Ca2+ sensitivity of troponin
- = Resistance against which ventricle pumps (= aortic pressure)
- Increased afterload → decreased SV (heart must work harder)
- Increased by: Sympathetic stimulation (NE via β1), digoxin, increased HR (Treppe/staircase effect), increased Ca2+
- Decreased by: Parasympathetic activity, β-blockers, myocardial ischemia, acidosis
C. Venous Return:
- Most important determinant of CO under normal conditions
- Increased by: Skeletal muscle pump, respiratory pump (inspiration), venoconstriction
Q13. Define GFR. Mention its normal value. Explain the factors regulating it.
Definition:
Normal Value:
- Males: 125 mL/min (180 L/day)
- Females: 110 mL/min
- GFR = ~20% of renal plasma flow (filtration fraction = 0.2)
Filtration Pressure (Starling Forces):
- Pcap = Glomerular capillary hydrostatic pressure = 60 mmHg
- PBowman = Bowman's space pressure = 18 mmHg
- πcap = Oncotic pressure of plasma = 32 mmHg
- Kf = Filtration coefficient (permeability × surface area)
Factors Regulating GFR:
- Myogenic mechanism: Increased BP → stretch → afferent arteriole constricts → constant GFR
- Tubuloglomerular feedback (TGF): Increased NaCl delivery to macula densa → adenosine release → afferent arteriole constriction → decreased GFR
- Sympathetic nerves → afferent arteriole constriction (α1 receptors) → decreased GFR (severe stress/shock)
| Hormone | Effect on GFR | Mechanism |
|---|---|---|
| Angiotensin II | Decreases GFR (mild) | Efferent > afferent constriction; maintains GFR at moderate levels |
| ANP (Atrial natriuretic peptide) | Increases GFR | Dilates afferent, constricts efferent; increases Kf |
| Prostaglandins (PGE2, PGI2) | Maintain GFR | Dilate afferent; important in dehydration/renal ischemia |
| Endothelin | Decreases GFR | Afferent constriction |
| Dopamine | Increases GFR | Renal vasodilation |
- Increased plasma oncotic pressure → decreased GFR
- Ureteral obstruction → increased PBowman → decreased GFR
- Protein intake → increases GFR (hyperfiltration)
Q14. Describe the chemical regulation of respiration.
A. Central Chemoreceptors:
- CO2 crosses blood-brain barrier → reacts with CSF water → H2CO3 → H+ + HCO3-
- Since CSF has low protein buffering, H+ rises more than in blood
- H+ stimulates central chemoreceptors → increases ventilation
B. Peripheral Chemoreceptors:
- Carotid bodies (most important in humans) - at bifurcation of common carotid artery; innervated by glossopharyngeal nerve (CN IX)
- Aortic bodies - in aortic arch; innervated by vagus nerve (CN X)
- Hypoxia (PaO2 <60 mmHg) - most potent stimulus for peripheral chemoreceptors
- Hypercapnia (increased PaCO2)
- Acidosis (decreased pH)
| Feature | Central | Peripheral |
|---|---|---|
| Location | Medulla | Carotid/aortic bodies |
| Primary stimulus | CO2/H+ | Hypoxia, CO2, H+ |
| Response speed | Slower | Faster (immediate) |
| Contribution to CO2 response | 70-80% | 20-30% |
C. Hypoxic Ventilatory Drive:
- PaO2 must fall to <60 mmHg before significant increase in ventilation
- Above 60 mmHg, Hb saturation remains >90% (flat part of OHD curve), so little stimulus
D. CO2 - Most Important Normal Stimulus:
- 1 mmHg rise in PCO2 → increases ventilation by 1-3 L/min
- Hyperventilation reduces PCO2 and increases O2 → provides a negative feedback
Q15. Describe composition and functions of Pancreatic juice.
Composition:
- High HCO3- (up to 120-140 mEq/L) - most important; neutralizes gastric acid in duodenum
- Na+, K+, Cl- (similar to plasma)
- Water
| Enzyme | Active form | Substrate | Activator |
|---|---|---|---|
| Trypsinogen | Trypsin | Proteins (internal peptide bonds) | Enterokinase (brush border) |
| Chymotrypsinogen | Chymotrypsin | Proteins (aromatic/hydrophobic bonds) | Trypsin |
| Proelastase | Elastase | Elastin, collagen | Trypsin |
| Procarboxypeptidase A,B | Carboxypeptidase A,B | Terminal amino acids | Trypsin |
- Pancreatic amylase - hydrolyzes starch/glycogen to maltose, isomaltose, maltotriose (secreted active)
- Pancreatic lipase - requires bile salts + colipase; hydrolyzes triglycerides → 2-monoglycerides + fatty acids
- Phospholipase A2 - hydrolyzes phospholipids (activated by trypsin)
- Cholesterol esterase - hydrolyzes cholesterol esters
- Non-specific esterase
- RNase, DNase
Regulation of Secretion:
| Phase | Stimulus | Mediator | Component secreted |
|---|---|---|---|
| Cephalic | Sight/smell of food | Vagus (ACh) | Enzyme-rich juice |
| Gastric | Gastric distension | Vagus (vago-vagal reflex) | Enzyme-rich juice |
| Intestinal | Acid in duodenum | Secretin | HCO3--rich (water) juice |
| Protein/fat in duodenum | CCK | Enzyme-rich juice |
Functions:
- Neutralize gastric acid - prevents duodenal mucosal damage; creates optimal pH for enzymes (7-8)
- Protein digestion - endo + exopeptidases
- Fat digestion - lipase, phospholipase A2
- Carbohydrate digestion - amylase
Q16. Describe micturition reflex. What is cystometrogram?
Micturition Reflex:
- Afferent: Pelvic nerve (S2-S4) - carry stretch signals from bladder wall
- Efferent parasympathetic: Pelvic nerve (S2-S4) → detrusor contraction (via muscarinic M3 receptors)
- Efferent sympathetic: Hypogastric nerve (L1-L2) → internal urethral sphincter contraction (via α1 receptors); detrusor relaxation (via β3 receptors)
- Somatic: Pudendal nerve (S2-S4) → external urethral sphincter (voluntary control)
- Bladder fills with urine → wall stretches
- At ~300-400 mL, stretch receptors (in detrusor muscle) send afferent signals via pelvic nerve → sacral spinal cord (S2-S4)
- Spinal reflex arc activated → parasympathetic efferents → detrusor contracts
- Simultaneously: internal urethral sphincter relaxes
- External sphincter (voluntary): can be held or released by will (via cortex → pudendal nerve)
- PMC coordinates detrusor contraction + sphincter relaxation
- Urine is voided
- Pontine center (facilitatory - PMC) - initiates voiding
- Cortex/Frontal lobe - voluntary inhibition of voiding
- Lesions above pons → uninhibited (frequent/urgent) micturition
- Complete spinal cord transection (above sacral) → initially retention (spinal shock), then automatic reflex voiding
Cystometrogram (CMG):
- Resting pressure (0-50 mL): ~10 cmH2O - initial slight rise
- Tonus limb (50-400 mL): Pressure remains nearly constant (~10-15 cmH2O) despite filling - due to plasticity of detrusor muscle (stress relaxation)
- First desire to void: ~150-200 mL
- Threshold for micturition reflex: ~300-400 mL
- Micturition contraction: Sharp rise in pressure (>15-20 cmH2O) as detrusor contracts voluntarily/reflexly
Q17. Enumerate the duties of a doctor.
A. Duties to Patients:
- Primum non nocere - "First, do no harm"
- Maintain the highest standards of professional conduct
- Not refuse treatment in emergency cases (even if patient cannot pay)
- Maintain patient confidentiality (secrecy) - only breach for legal/public health requirements
- Obtain informed consent before any procedure/treatment
- Not perform unnecessary investigations or treatments for monetary gain
- Respect patient's rights, dignity, and autonomy
- Keep detailed and accurate medical records
- Refer to specialists when indicated (not manage beyond competence)
- Not abandon a patient once treatment has begun
B. Duties to Society:
- Report communicable (notifiable) diseases to health authorities (e.g., cholera, typhoid, plague, rabies, SARS, COVID)
- Participate in community health programs and public health activities
- Provide first aid and emergency care to any person
- Issue certificates and reports honestly (not falsify documents)
- Report cases of violence, rape, poisoning, unnatural deaths (medico-legal duties)
C. Professional Duties:
- Maintain and update medical knowledge throughout professional life (CME)
- Not advertise services in unprofessional ways
- Maintain proper professional conduct with colleagues (not disparage other doctors)
- Not practice under the influence of alcohol or drugs
- Register with Medical Council and renew registration
- Not practice euthanasia (active) - while supporting palliative care
D. Duties to Profession:
- Maintain honor and dignity of the medical profession
- Teach and train future doctors if in academic position
- Cooperate with medical research (ethically)
- Follow the Hippocratic Oath and professional ethics codes
Sources used: Ganong's Review of Medical Physiology 26th ed. | Costanzo Physiology 7th ed. | Guyton & Hall Textbook of Medical Physiology | Standard 1st MBBS Physiology curriculum content consistent with GK Pal's Textbook of Medical Physiology
5 diagram
normal ECG leads waves intervals P QRS T labeled diagram
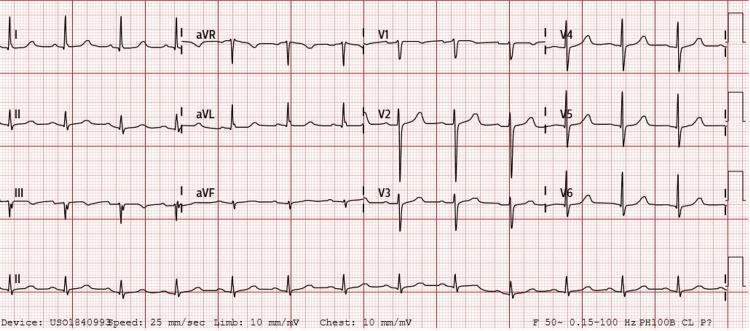
A standard 12-lead electrocardiogram (ECG) displayed on a red grid background, demonstrating normal sinus rhythm at a rate of approximately 70 beats per minute. The tracing includes limb leads (I, II, III), augmented limb leads (aVR, aVL, aVF), precordial leads (V1-V6), and a continuous rhythm strip of lead II at the bottom. The QRS complexes exhibit normal duration and morphology without pathological widening. P waves are identifiable before each QRS complex, indicating atrial depolarization originating from the sinoatrial node. T waves are upright in leads I, II, aVF, and V2-V6, and appropriately inverted in lead aVR. There is a lack of acute ST-segment elevation or depression. The R-R intervals are regular, reflecting a stable cardiac rhythm. This tracing represents the resolution of previously identified junctional bradycardia following the treatment of hyperkalemia. The technical parameters are visible at the bottom, indicating a standard paper speed of 25 mm/sec and voltage calibration of 10 mm/mV.
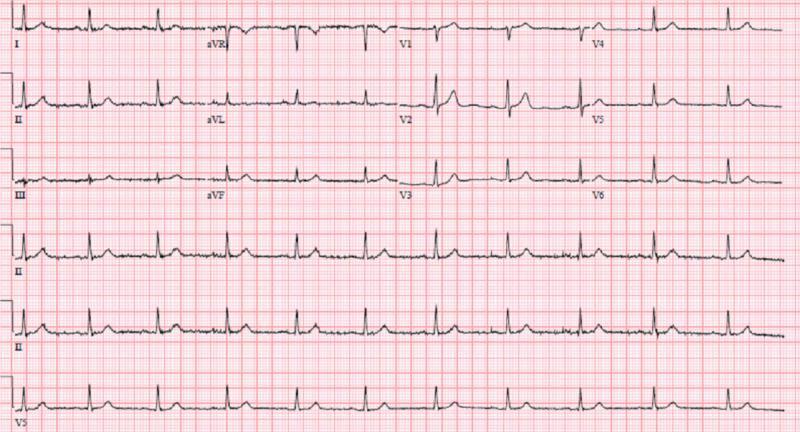
A standard 12-lead electrocardiogram (ECG) displayed on a traditional red grid background. The tracing shows a normal sinus rhythm with a regular rate and consistent R-R intervals. P waves are clearly visible preceding each QRS complex in the limb and precordial leads. The QRS complexes are of normal duration and morphology, with a standard R-wave progression observed from V1 through V6. The ST segments appear isoelectric without clear evidence of acute ST-elevation or depression in any lead. T waves are upright in most leads, with the exception of lead V1 and aVR, where inversion is a normal variant. This ECG represents a clinically stable cardiac state at the time of presentation, despite the patient's underlying severe coronary artery disease (CAD), including significant stenosis of the left anterior descending and left circumflex arteries. The absence of acute ischemic changes or pathological Q waves highlights that baseline ECGs can remain unremarkable even in the presence of severe structural heart disease.
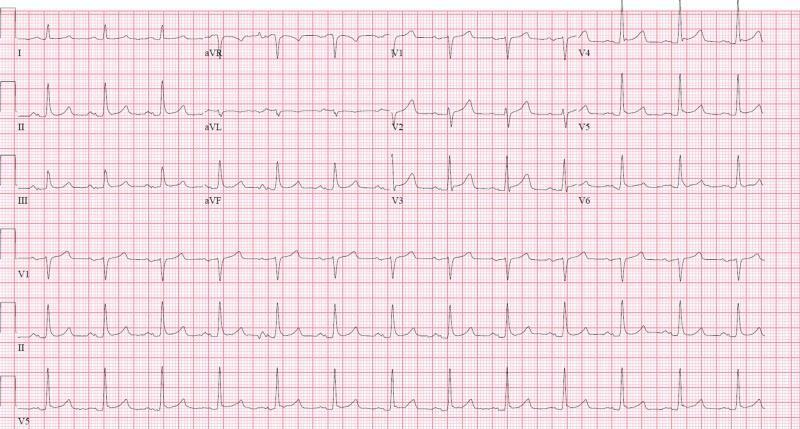
A standard 12-lead electrocardiogram (ECG) displayed on a traditional pink grid background. The tracing demonstrates a normal sinus rhythm characterized by a regular ventricular rate and consistent R-R intervals. Distinct P waves precede every QRS complex, particularly visible as upright deflections in leads II, III, aVF, and V2 through V6. The QRS complexes exhibit normal morphology and duration without evidence of widening or bundle branch blocks. The ST segments are isoelectric throughout all limb and precordial leads, indicating an absence of acute ST-elevation myocardial infarction (STEMI) or significant ST-depression suggestive of ischemia. T waves are generally upright and symmetrical across the precordium. The tracing includes a rhythm strip at the bottom (leads V1, II, and V5) for continuous assessment of the cardiac cycle. This diagnostic image represents a baseline cardiac evaluation for a patient presenting with syncope and hypovolemic shock, providing a clinical comparison for later episodes of potential coronary vasospasm.
oxygen hemoglobin dissociation curve sigmoid shape
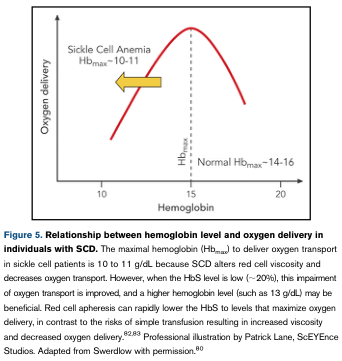
Summary : This figure illustrates the relationship between hemoglobin (Hb) level and oxygen delivery in individuals with sickle cell disease (SCD), highlighting the optimal Hb range for oxygen transport in SCD compared to normal individuals. line plot: # Title & Axes : • No explicit title on the plot, but the context is "Relationship between hemoglobin level and oxygen delivery in individuals with SCD." • X-axis: "Hemoglobin" (units not specified, but contextually g/dL). • Y-axis: "Oxygen delivery" (units not specified). • X-axis tick labels: 10, 15, 20. • Y-axis: No tick labels, only qualitative trend. # Data Points & Series : • Single red curve showing oxygen delivery as a function of hemoglobin level. • The curve rises from Hb = 10, peaks near Hb = 14–16, then declines toward Hb = 20. • Arrow and annotation for "Sickle Cell Anemia Hb_max ~10–11" indicating the optimal Hb range for SCD. • Dashed vertical line at "Normal Hb_max ~14–16" indicating the optimal Hb range for normal individuals. # Design Encodings : • Red solid line for the main curve. • Yellow arrow highlighting the SCD optimal Hb range. • Dashed vertical line for normal Hb_max. • Text annotations for "Sickle Cell Anemia Hb_max ~10–11" and "Normal Hb_max ~14–16". # Distribution & Trends : • The curve is unimodal, peaking at intermediate Hb levels. • Oxygen delivery increases with Hb up to a point, then decreases at higher Hb levels. • The optimal Hb for SCD is lower (~10–11 g/dL) than for normal individuals (~14–16 g/dL). # Analysis : • The figure visually demonstrates that the maximal oxygen delivery in SCD occurs at a lower hemoglobin level than in normal individuals, due to altered red cell viscosity and oxygen transport in SCD. • Increasing Hb above the SCD optimal range may decrease oxygen delivery, while lowering Hb to the optimal range can improve oxygen transport. • The curve supports clinical recommendations for transfusion targets in SCD patients to avoid excessive Hb levels that could impair oxygen delivery.
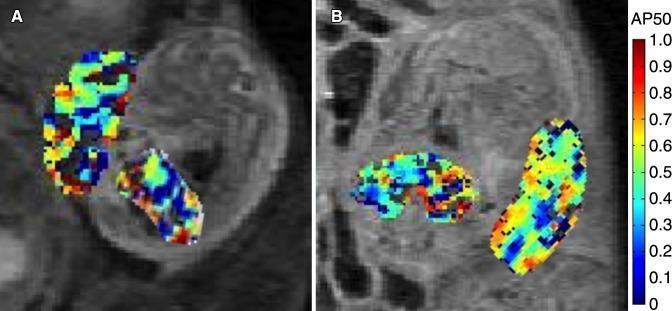
This diagnostic image set displays two functional MR images (A and B) showing maternal-fetal units in a mouse model at embryonic days 14.5 and 17.5. The images feature overlaid color-coded AP50 maps, which represent fetal and placental oxygen-hemoglobin dissociation parameters. In both panels, the placenta and fetal liver are isolated as regions of interest. A vertical color bar on the right side indicates AP50 values scaled from 0 to 1.0, with cool colors (dark blue) representing lower values and warm colors (red/orange) representing higher values. Panel A (day 14.5) demonstrates a heterogeneous distribution of oxygenation parameters within the tissues, showing a mix of green, yellow, and blue pixels. Panel B (day 17.5) illustrates the progression of these physiological markers over time, with the placental AP50 values showing a significant spatial shift toward warmer colors, reflecting changes in oxygen transfer efficiency. These maps provide a non-invasive visual method for studying fetal oxygenation and placental function during gestation.
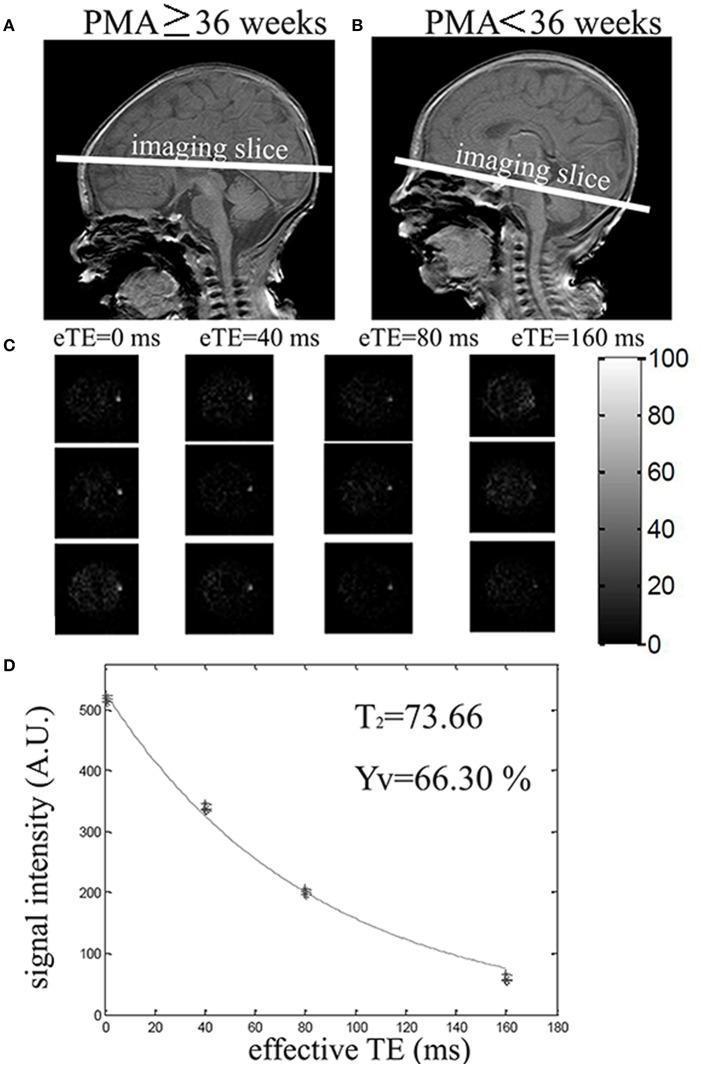
This composite educational image illustrates the methodology for measuring venous oxygenation (Yv) using T2-Relaxation-Under-Spin-Tagging (TRUST) MRI in neonates. Panels A and B display sagittal neonatal brain MRIs with white lines indicating imaging slice placement based on postmenstrual age (PMA). For PMA ≥ 36 weeks (A), the slice is positioned superiorly targeting the superior sagittal sinus. For PMA < 36 weeks (B), the slice is placed inferior to the sinus confluence to target the transverse or sigmoid sinuses. Panel C shows difference images (control minus label) at four effective echo times (eTE: 0, 40, 80, 160 ms), demonstrating the decay of venous signal intensity in the target voxel. Panel D presents a monoexponential decay curve fitting signal intensity (A.U.) against eTE. The derived parameters shown are T2 = 73.66 and Yv = 66.30%. This figure demonstrates how functional MRI can non-invasively quantify brain physiology and oxygen metabolism in the developing neonatal brain.
steps of phagocytosis diagram neutrophil macrophage
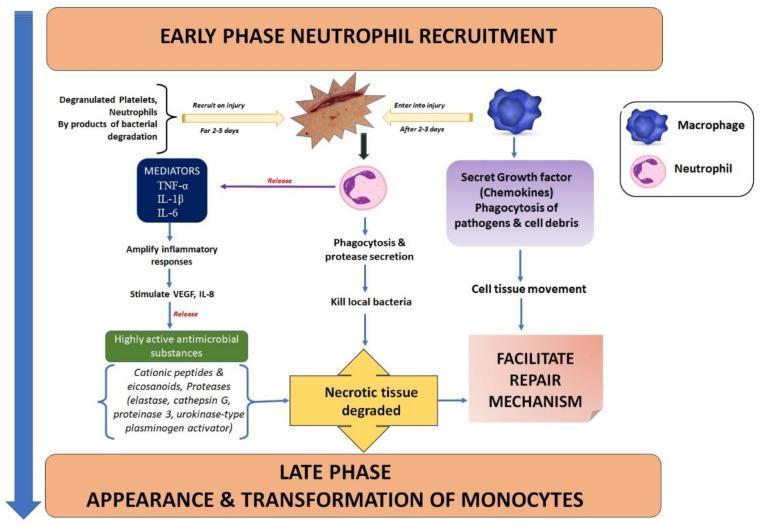
This medical pathophysiology flowchart illustrates the inflammatory phase following a cutaneous injury, specifically focusing on early-phase neutrophil recruitment and late-phase monocyte transformation. The diagram is structured to show the temporal progression of wound healing over 2-5 days. Central to the initial stage is a cutaneous incision icon attracting neutrophils and degranulated platelets. The neutrophil-mediated pathway details the release of pro-inflammatory mediators (TNF-α, IL-1β, IL-6), which amplify the inflammatory response and stimulate VEGF and IL-8, leading to the release of antimicrobial substances like cationic peptides and proteases (elastase, cathepsin G). These neutrophils perform phagocytosis and protease secretion to kill local bacteria and degrade necrotic tissue. Simultaneously, macrophages enter the injury site after 2-3 days, secreting growth factors and chemokines while performing phagocytosis of pathogens and cell debris. This macrophage activity promotes cell tissue movement to facilitate repair mechanisms. The flowchart concludes with a transition into the late phase, characterized by the appearance and transformation of monocytes into mature macrophages, bridging the inflammatory response to the proliferative repair stage.
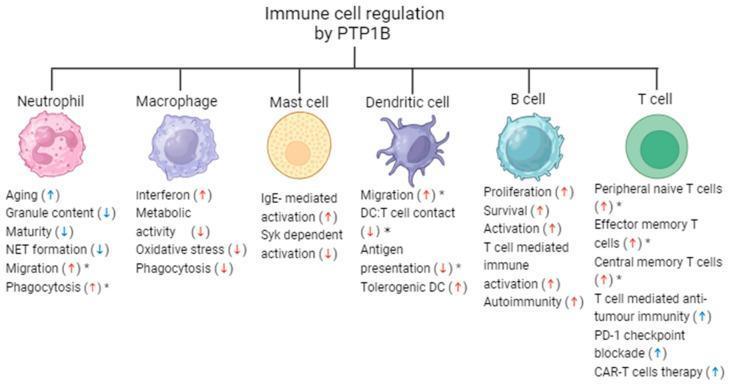
This medical illustration is a pathophysiology diagram titled 'Immune cell regulation by PTP1B,' detailing how Protein Tyrosine Phosphatase 1B (PTP1B) inhibition or knockout modulates the function of innate and adaptive immune cells. The diagram displays six leukocyte types: Neutrophil, Macrophage, Mast cell, Dendritic cell, B cell, and T cell. Beneath each cell, specific physiological processes are listed with arrows indicating an increase (upward blue arrow) or decrease (downward red arrow) in activity following PTP1B deficiency. For example, it shows increased neutrophil aging and migration, decreased macrophage metabolic activity and phagocytosis, and increased B cell proliferation and survival. The T cell section highlights increased anti-tumor immunity and CAR-T cell therapy efficacy. Asterisks denote cell-specific rather than global knockout effects. This visual summary is used in immunology and oncology to illustrate the potential of PTP1B as a therapeutic target for chronic inflammation, metabolic disease, and cancer immunotherapy.
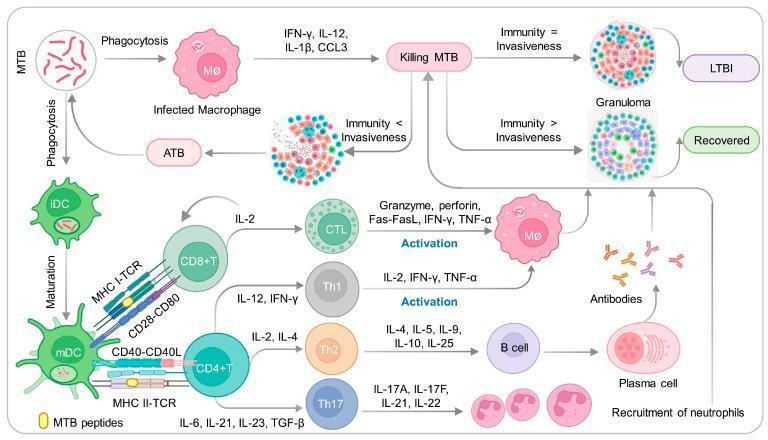
This pathophysiology diagram illustrates the innate and adaptive immune responses to Mycobacterium tuberculosis (MTB). The process begins with MTB phagocytosis by alveolar macrophages (MΦ) and immature dendritic cells (iDC). The iDCs undergo maturation into mDCs, presenting MTB peptides via MHC I and MHC II to CD8+ and CD4+ T cells, involving costimulatory molecules CD28-CD80 and CD40-CD40L. Activated CD8+ T cells differentiate into Cytotoxic T Lymphocytes (CTLs), releasing granzymes and perforin to activate macrophages for MTB killing. CD4+ T cells differentiate into Th1, Th2, or Th17 subsets, each secreting specific cytokines (e.g., IFN-γ, IL-4, IL-17) to modulate macrophage activation, B cell response, or neutrophil recruitment. The diagram further correlates immune outcomes with granuloma morphology: a state of 'Immunity = Invasiveness' leads to Latent TB Infection (LTBI) with a stable granuloma; 'Immunity > Invasiveness' leads to recovery with a resolving granuloma; and 'Immunity < Invasiveness' results in Active Tuberculosis (ATB) with granuloma breakdown and bacterial escape.
cystometrogram bladder pressure volume curve micturition reflex
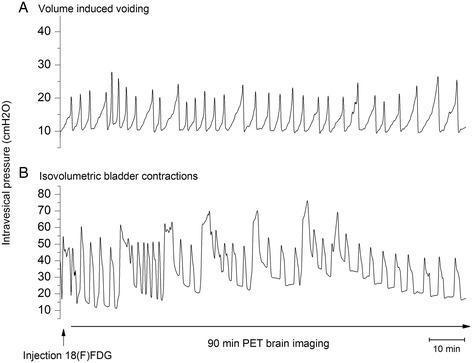
This diagnostic comparison chart displays two cystometrogram (CMG) plots recording intravesical pressure (cmH2O) over a 90-minute temporal duration, synchronized with (18F)FDG-PET brain imaging. Plot A illustrates volume-induced voiding, characterized by regular, rhythmic sawtooth pressure fluctuations ranging between 10 and 30 cmH2O. This pattern reflects a consistent cycle of bladder filling and reflexive emptying. Plot B displays isovolumetric bladder contractions, which exhibit significantly higher pressure amplitudes, reaching up to 70–80 cmH2O. The contractions in the isovolumetric state are more irregular and show a gradual decline in both amplitude and frequency toward the end of the 90-minute session, suggesting detrusor muscle fatigue or adaptive mechanisms. The visual data is essential for understanding the neurophysiological and mechanical differences between normal micturition cycles and states of obstructed or constrained bladder outflow. This content is relevant for urology and functional neuroimaging education, focusing on lower urinary tract (LUT) physiology.
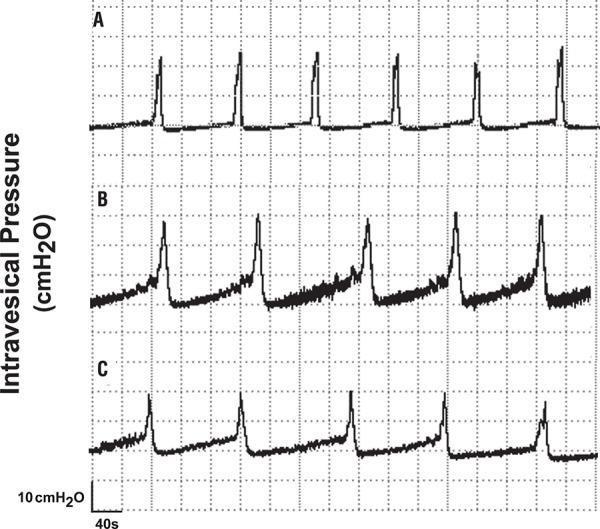
Cystometric recordings (cystometrogram) illustrating bladder pressure dynamics in an animal model of bladder autotransplantation. The image features three distinct waveforms labeled A, B, and C, plotted against intravesical pressure in cmH2O (y-axis) and time (x-axis), with a 40-second time scale and a 10 cmH2O pressure reference. Trace A represents the control state, showing rhythmic, high-amplitude, and narrow-duration micturition peaks with a stable baseline. Trace B shows physiological changes post-transplant with intermediate micturition intervals and irregular baseline activity. Trace C demonstrates the lowest maximal pressure amplitude, increased micturition duration (widened peaks), and gradual pressure rises during the filling phase, reflecting altered neobladder compliance or contractility. These tracings are used to evaluate urological functional outcomes such as maximal pressure amplitude, micturition interval, and duration in reconstructive surgery research.
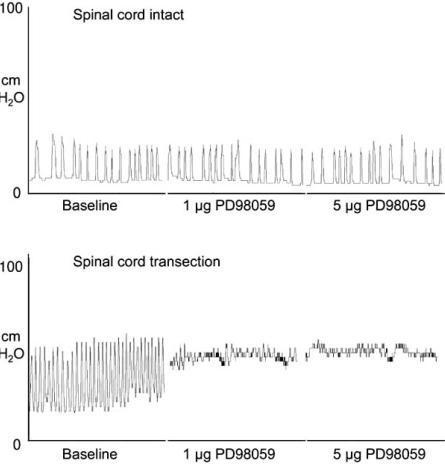
This diagnostic image consists of two cystometrogram (bladder pressure) tracings comparing 'Spinal cord intact' and 'Spinal cord transection' conditions in an experimental model. The vertical axis measures bladder pressure in cm H2O, and the horizontal axis represents time under three conditions: Baseline, 1 μg PD98059, and 5 μg PD98059. In the 'Spinal cord intact' panel, regular, low-amplitude bladder contractions are visible at baseline, and these remain unchanged following the intrathecal administration of increasing doses of PD98059 (a MEK inhibitor). In the 'Spinal cord transection' panel, the baseline shows high-frequency, high-amplitude bladder reflex activity, characteristic of neurogenic detrusor overactivity. Following the administration of PD98059, there is a dose-dependent decrease in both the frequency and amplitude of these contractions, with the 5 μg dose resulting in a significant stabilization of bladder pressure. The content illustrates the role of MAP kinase signaling in neurogenic bladder dysfunction and the potential therapeutic effect of pathway inhibition on reflex micturition in spinal cord injury scenarios.
cardiac action potential phases refractory period diagram
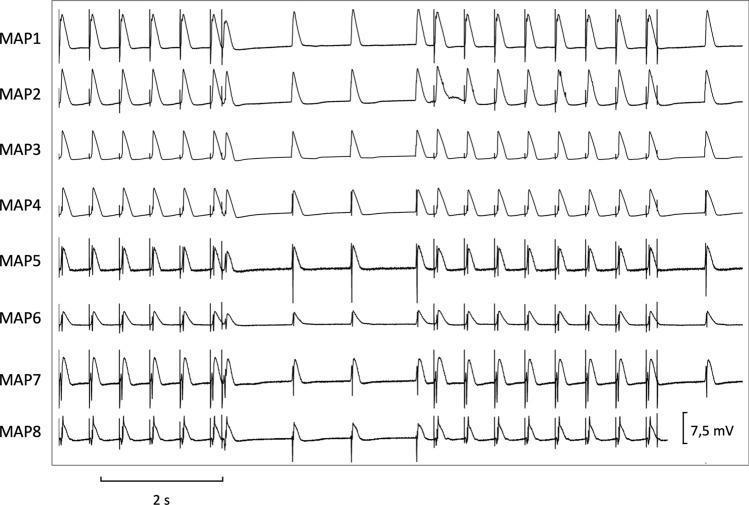
This diagnostic trace image displays eight simultaneous monophasic action potential (MAP) recordings, labeled MAP1 through MAP8, used in cardiac electrophysiology research. The primary focus is the determination of effective refractory periods (ERP) at a basic cycle length of 500 ms. The traces exhibit characteristic cardiac action potential morphology with rapid depolarization and subsequent repolarization phases. Throughout the 2-second time interval (indicated by the scale bar), regular pacing stimuli are followed by short-coupled extrastimuli (S2/S3) to test ventricular vulnerability and refractory periods. Variations in amplitude and morphology are visible across the different MAP traces, with a voltage scale of 7.5 mV provided for reference. Notable features include the presence of premature beats and varying repolarization kinetics (APD90/APD50) across different anatomical recording sites. This recording is representative of programmed electrical stimulation protocols used to assess spatial dispersion of repolarization and the propensity for arrhythmias such as ventricular tachycardia or torsade de pointes.
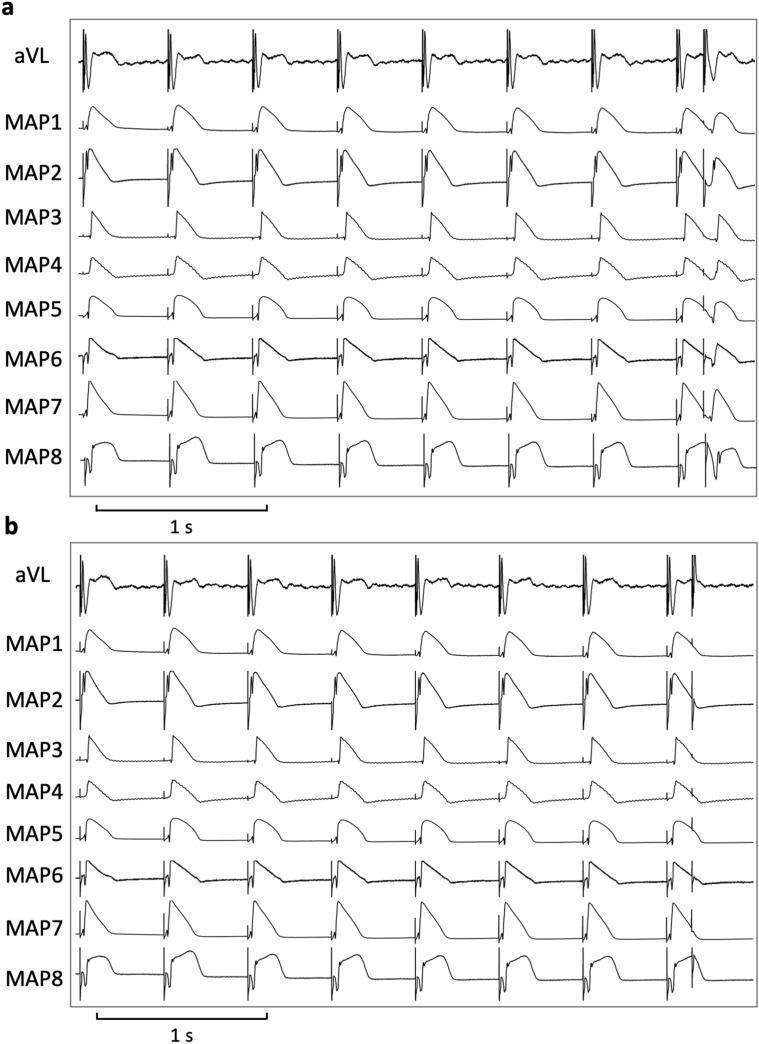
This diagnostic comparison chart displays electrocardiographic and electrophysiological data used to determine effective refractory periods (ERP) and spatial dispersion of repolarization. The image is divided into two stacked panels (a and b), each featuring a single-lead ECG tracing (aVL) at the top followed by eight simultaneous monophasic action potential (MAP1-8) recordings. The horizontal axis represents time with a 1-second scale bar provided. Each MAP trace illustrates the phases of the cardiac action potential, including the rapid depolarization upstroke, the plateau phase, and the repolarization phase. The figure demonstrates the cardiac response to programmed electrical stimulation, characterized by a series of regularly paced beats followed by a premature extra-stimulus (S2). Variations in action potential duration (APD) and morphology are visible across the different recording sites (MAP1-8), reflecting spatial heterogeneity in ventricular repolarization. This type of visualization is critical in cardiology research for assessing ventricular vulnerability to arrhythmias and calculating post-repolarization refractoriness (PRR).
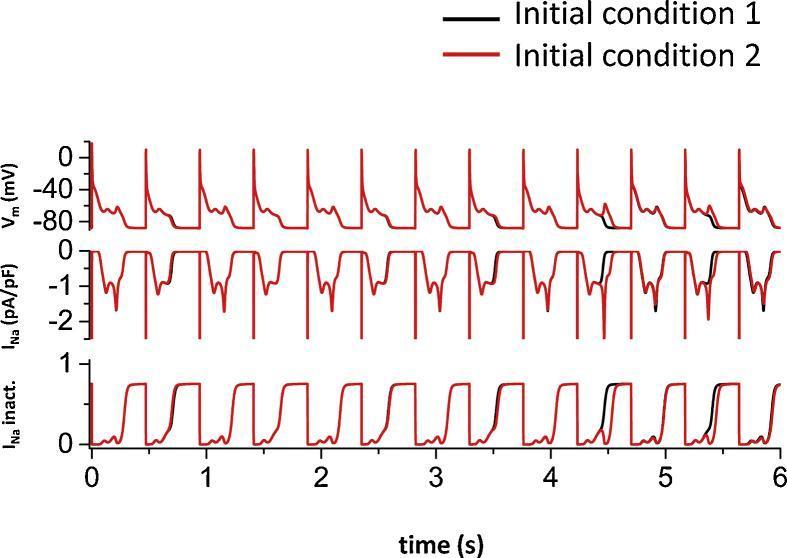
This pathophysiology diagram consists of three stacked electrophysiological simulation traces over a 6-second period, illustrating cellular cardiac arrhythmias. The Y-axes represent membrane potential (Vm in mV), sodium current (INa in pA/pF), and sodium inactivation (INa inact.). The simulation compares two starting states: 'Initial condition 1' (black line) and 'Initial condition 2' (red line), where the latter begins with a membrane potential 1 mV higher than the former. The Vm trace demonstrates the development of early afterdepolarizations (EADs) during the repolarization phase of the action potentials. Initially, the two simulation traces are identical, but they eventually diverge, illustrating sensitivity to initial conditions and chaotic dynamics in cardiac electrical signaling. The corresponding INa traces show that during EADs, there is a reactivation of sodium currents, which correlates with partial recovery in the INa inactivation variable. This visual evidence supports the role of sodium channel window currents in triggering irregular EADs under pathological conditions, such as long QT syndrome or heart failure.
phagocytosis opsonization phagosome lysosome killing steps labeled diagram
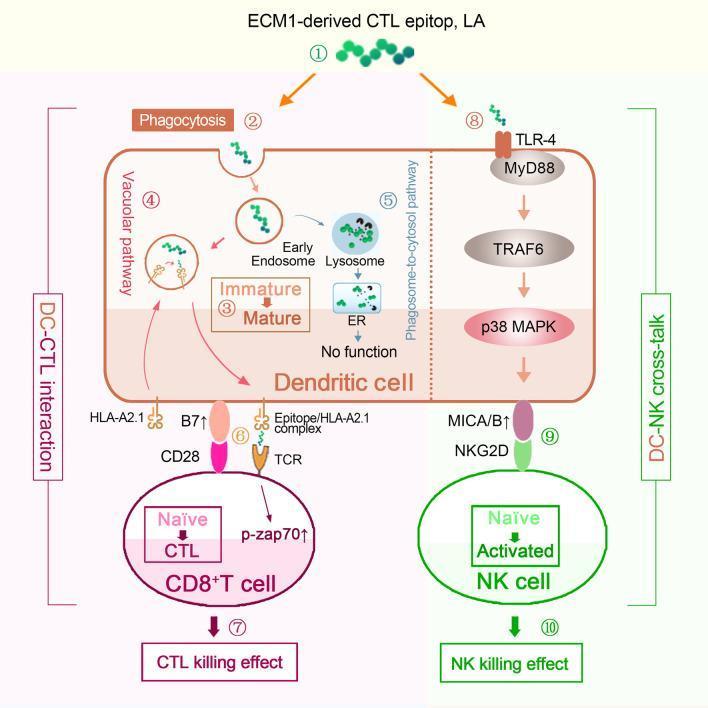
This pathophysiology diagram illustrates the dual activation mechanism of Cytotoxic T Lymphocytes (CTLs) and Natural Killer (NK) cells by a novel ECM1-derived CTL epitope (LA) within a human dendritic cell (DC) model. The process begins with the internalization of the LA epitope into a DC via phagocytosis. Two intracellular fates are depicted: the vacuolar pathway leading to the presentation of the Epitope/HLA-A2.1 complex on the DC surface, and the phagosome-to-cytosol pathway which leads to degradation in the lysosome and ER with no functional outcome. Successful presentation (DC-CTL interaction) triggers the T-cell receptor (TCR) on CD8+ T cells, increasing p-zap70 and activating CTL killing effects. Simultaneously, the diagram shows a signaling pathway (DC-NK crosstalk) where LA activates TLR4, triggering a downstream cascade through MyD88, TRAF6, and p38 MAPK. This cascade upregulates MICA/B on the DC surface, which binds to NKG2D receptors on NK cells to induce activation and NK-mediated anti-tumor killing effects. The schematic uses numerical labels (1-10) to detail the sequential steps of peptide internalization, DC maturation, antigen presentation, and subsequent effector cell activation.
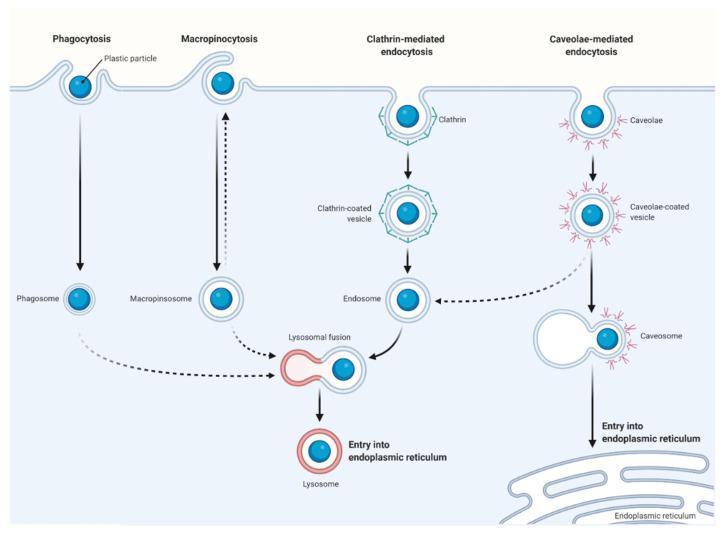
This pathophysiology diagram illustrates the primary routes of cellular uptake for plastic particles, highlighting four distinct endocytic pathways: phagocytosis, macropinocytosis, clathrin-mediated endocytosis, and caveolae-mediated endocytosis. The illustration details the progression from membrane interaction to intracellular trafficking. Phagocytosis is shown as the outward extension of the membrane to engulf particles into a phagosome. Macropinocytosis involves larger membrane ruffles forming a macropinosome. Clathrin-mediated endocytosis depicts the formation of a clathrin-coated pit that pinches off into a vesicle, loses its coat, and matures into an endosome. Caveolae-mediated endocytosis shows smaller invaginations involving caveolae proteins leading to caveosomes. The diagram further maps the intracellular fate of these vesicles, including lysosomal fusion for degradation or trafficking to the endoplasmic reticulum. Key labels include clathrin-coated vesicle, endosome, caveosome, lysosome, and endoplasmic reticulum, demonstrating the complex signaling and transport pathways involved in nanoplastic and microplastic cellular internalization.
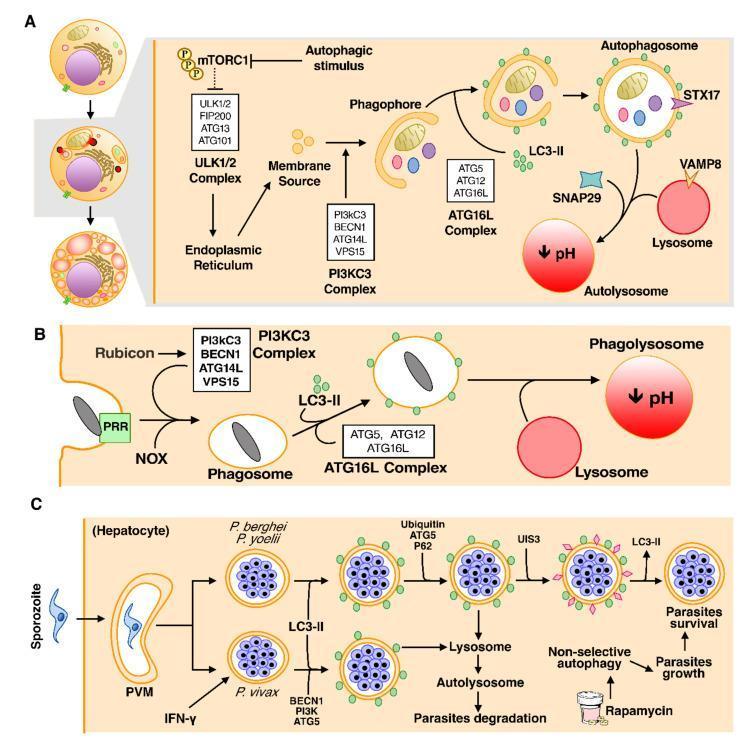
This medical pathophysiology diagram illustrates three pathways of autophagy and their clinical relevance in host defense and parasitic infection. Section A depicts canonical macroautophagy: inhibitory phosphorylation of mTORC1 triggers the ULK1/2 complex (ULK1/2, FIP200, ATG13, ATG101). A phagophore emerges via the PI3KC3 complex (BECN1, ATG14L, VPS15), elongates through the ATG16L complex, and forms an LC3-II-decorated autophagosome before fusing with a lysosome (mediated by STX17, VAMP8, SNAP29) to create an acidic autolysosome. Section B details LC3-associated phagocytosis (LAP), where pathogens are recognized by PRRs and NOX, leading to single-membrane phagosome formation and direct LC3-II recruitment. Section C illustrates the interaction between autophagy and malaria in hepatocytes. It shows how the parasitophorous vacuole membrane (PVM) containing Plasmodium sporozoites (P. berghei, P. yoelii, P. vivax) can be targeted for lysosomal degradation. However, it also highlights survival mechanisms where the parasite protein UIS3 removes LC3-II to evade autophagy, and how non-selective canonical autophagy, potentially induced by rapamycin, can paradoxically promote parasite growth by providing host nutrients.
myocardial infarction ECG changes ST elevation Q wave T wave
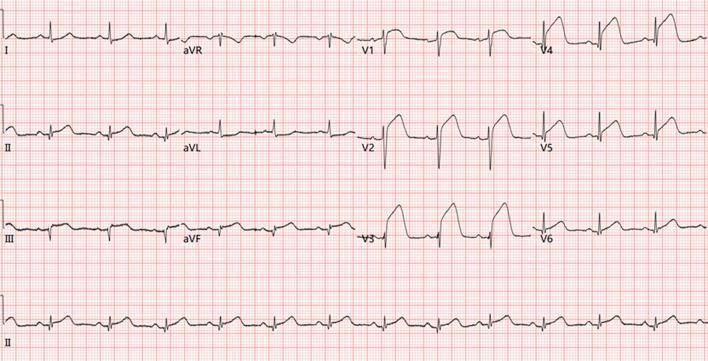
This diagnostic image is a 12-lead electrocardiogram (ECG) demonstrating an acute ST-segment elevation myocardial infarction (STEMI) with extensive involvement. The tracing reveals significant ST-segment elevation in the inferior leads (II, III, and aVF) and the precordial leads (V1 through V5), indicating a combined anterior and inferior wall infarction pattern. Prominent pathological Q-waves are visible in the limb leads I, II, III, and aVF, signifying established myocardial necrosis or a prior infarctive event in those territories. The precordial leads show a 'tombstoning' morphology of the ST segments, particularly from V2 to V4, where the ST elevation merges directly with the T-waves. These findings are consistent with massive myocardial ischemia and infarction, typically necessitating urgent reperfusion therapy. The ECG serves as an educational tool for identifying multivessel or proximal coronary artery occlusion patterns and the evolution of ischemic changes from Q-wave formation to acute ST-segment deviation.
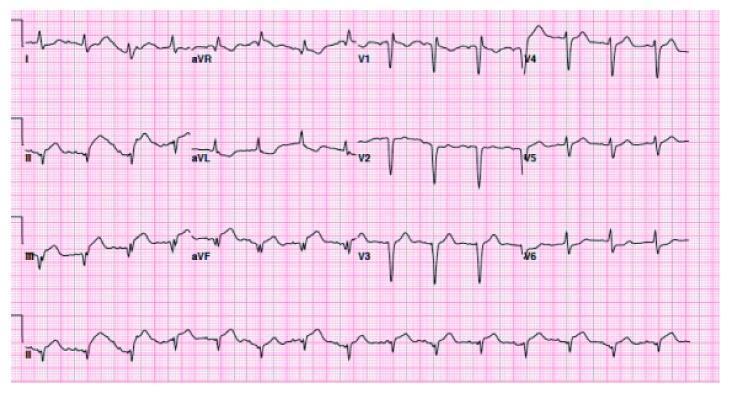
This diagnostic image is a 12-lead electrocardiogram (ECG) demonstrating acute ST-segment elevation myocardial infarction (STEMI) patterns. The primary visual abnormality is significant ST-segment elevation (approximately 2.5–3 mm) in the inferior leads (II, III, and aVF). The morphology of the ST segments is convex ('tombstoning') and transitions into upright, prominent T waves. Reciprocal ST-segment depression is visible in the lateral lead aVL. The rhythm is regular and appears to be a normal sinus rhythm with identifiable P waves preceding each narrow QRS complex. There are also deep Q waves present in the inferior leads, suggesting an established or previous inferior wall injury. Precordial leads (V1-V6) show relatively deep S waves and some T-wave flattening, consistent with left ventricular hypertrophy or secondary changes. This tracing is clinically significant for diagnosing an acute inferior STEMI, often associated with right coronary artery (RCA) or left circumflex (LCx) occlusion. It serves as a key educational example for interpreting acute ischemic changes and reciprocal findings on a standard 12-lead ECG.
A 12-lead electrocardiogram (ECG) demonstrating signs of an acute anterolateral ST-elevation myocardial infarction (STEMI). The tracing reveals significant ST-segment elevation in the precordial leads, most prominently in V3 and V4, accompanied by prominent, positively deflected T-waves. Subacute Q-wave formation is visible in lead V3. Reciprocal ST-segment depression is noted in the inferior leads, specifically Lead III and aVF. The rhythm appears to be sinus tachycardia with a narrow QRS complex. This diagnostic image illustrates the electrical manifestations of acute coronary occlusion, likely involving the left anterior descending (LAD) artery, and serves as a critical educational example for identifying early-stage ischemic changes and localized anterior wall injury patterns in emergency cardiology.
5 Key Diagrams for Your Physiology Paper
📊 Diagram 1 - Q1: Normal ECG (Leads, Waves, Intervals)
📊 Diagram 1b - Q1: ECG Changes in Myocardial Infarction (STEMI)
📊 Diagram 2 - Q5: Oxygen-Hemoglobin Dissociation Curve (Sigmoid Shape)
📊 Diagram 3 - Q11: Steps of Phagocytosis
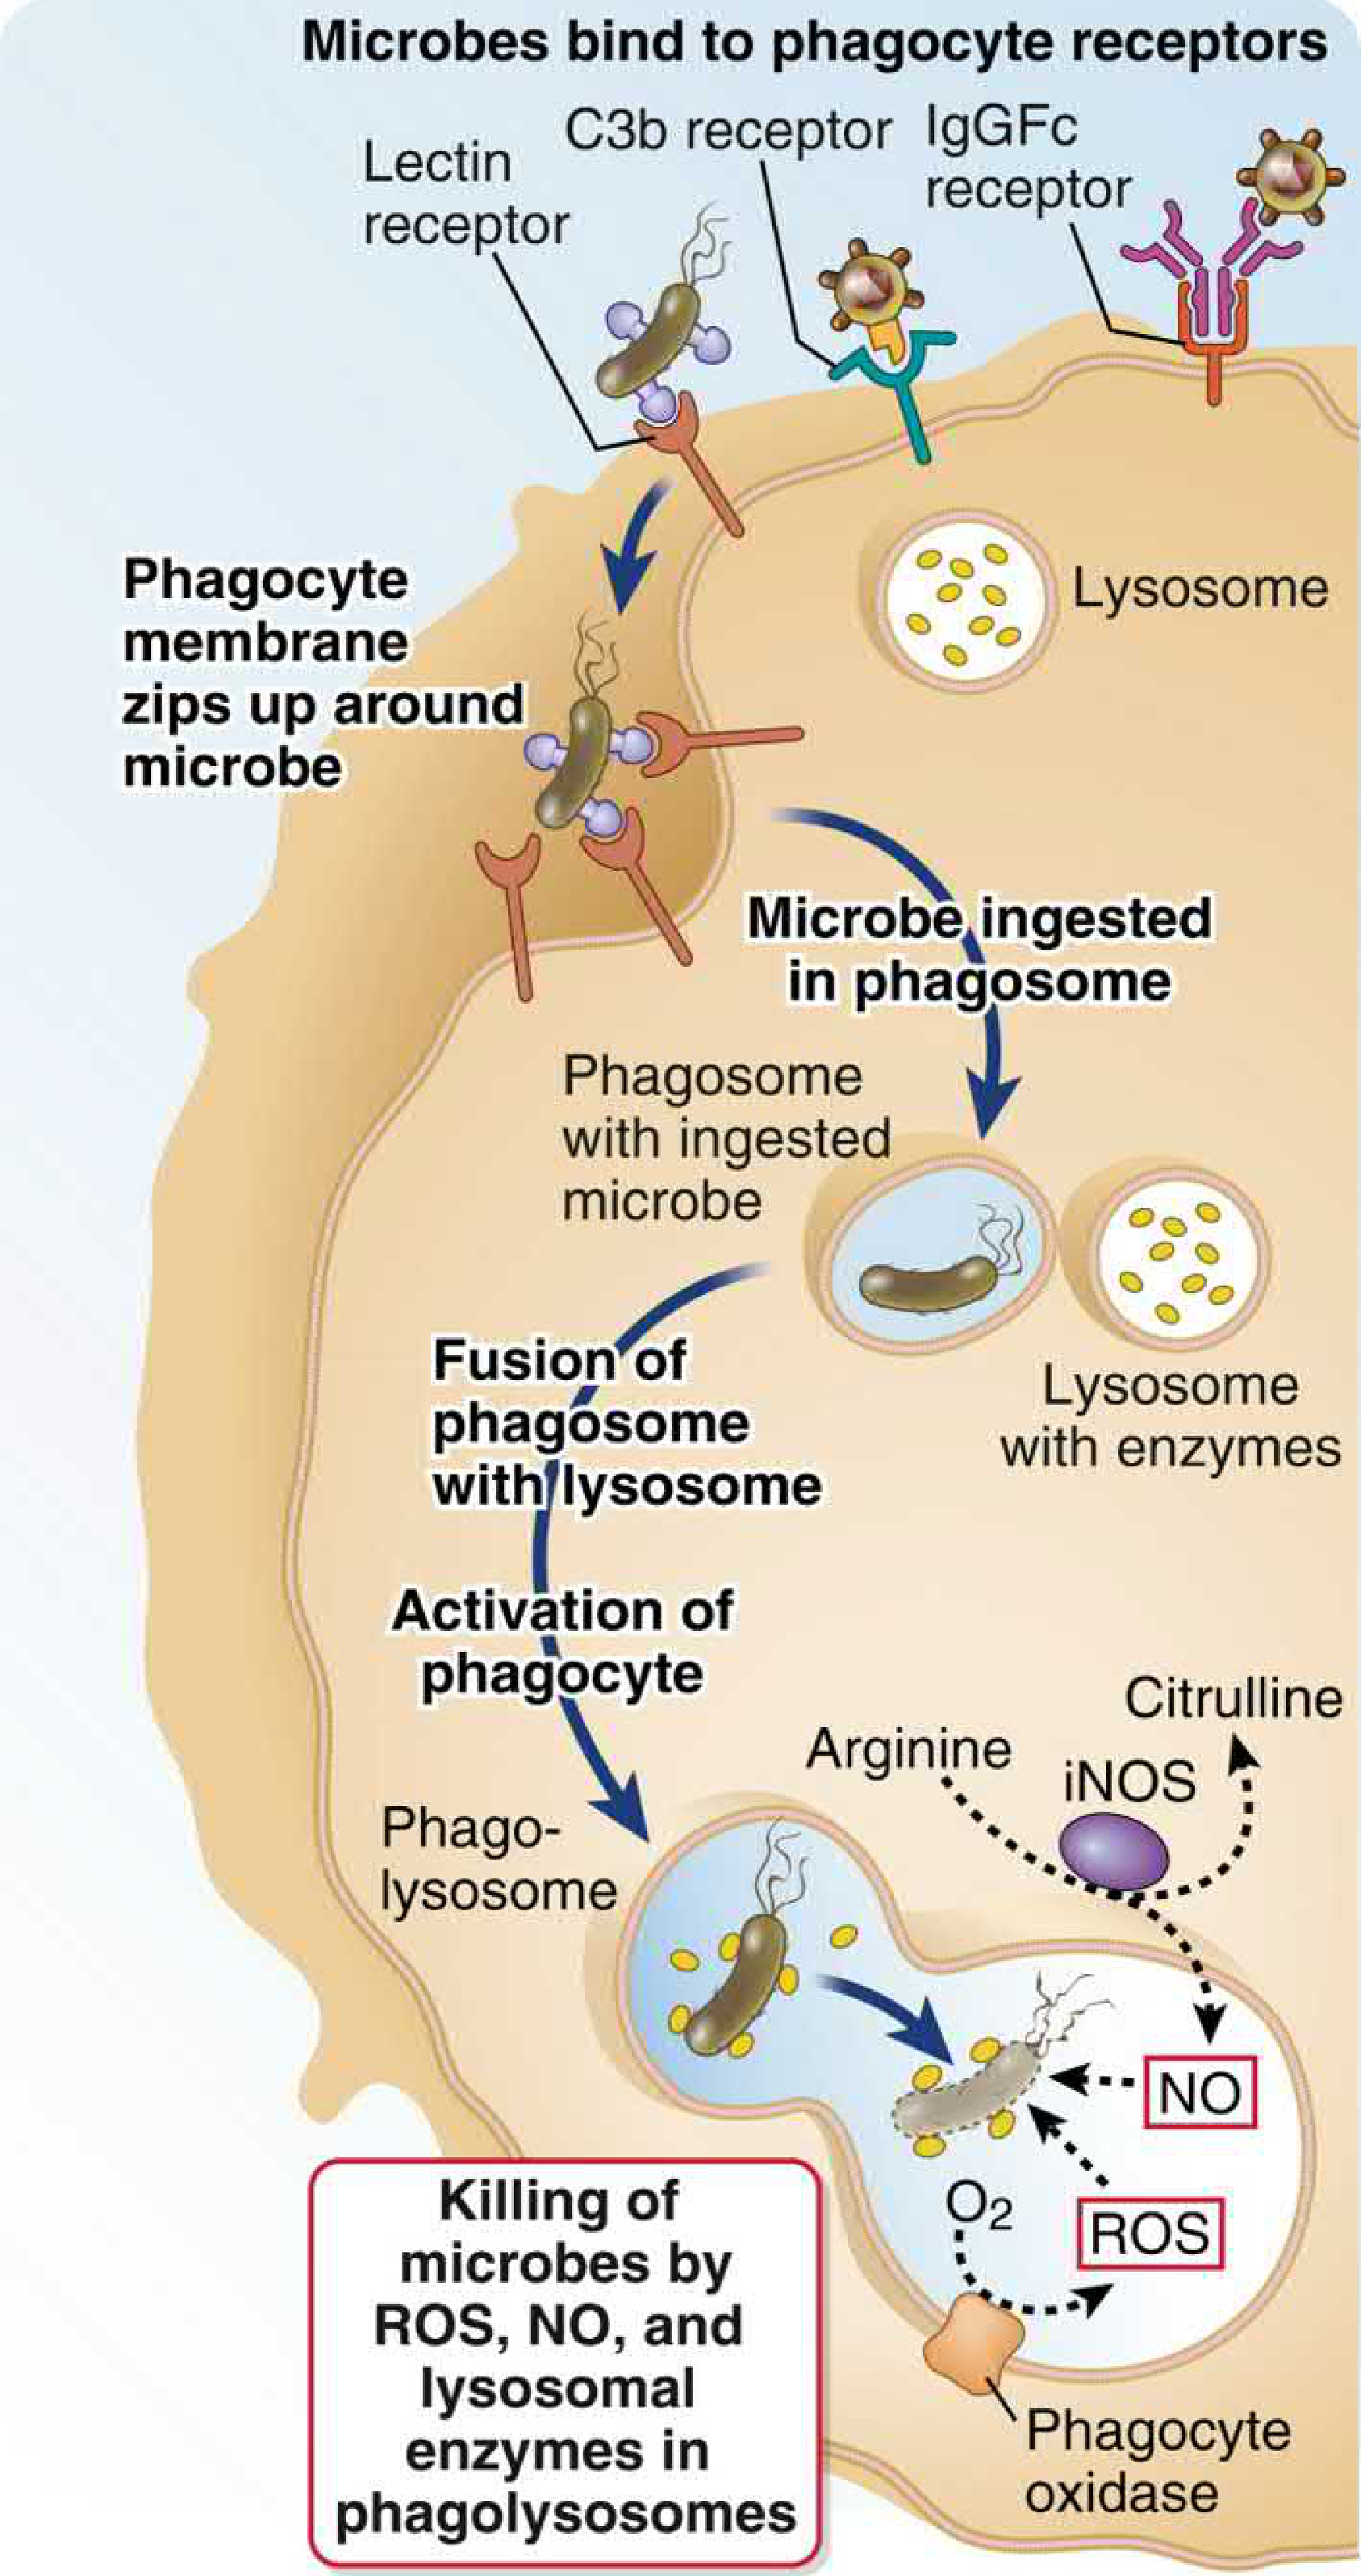
- Microbe binds phagocyte receptors (Lectin receptor, C3b receptor, IgG-Fc receptor)
- Phagocyte membrane zips up around microbe (pseudopod formation)
- Microbe ingested in phagosome
- Phagosome fuses with lysosome (containing digestive enzymes)
- Phagocyte activation → forms phagolysosome
- Killing by ROS (via phagocyte oxidase + O2), NO (via iNOS: Arginine → Citrulline + NO), and lysosomal enzymes
📊 Diagram 4 - Q16: Cystometrogram
Pressure
(cmH2O)
   ↑
40 |                               /|
   |                              / |  ← Micturition
20 |_____________________________/  |  contraction
   |← Tonus limb (nearly flat) →   ↓
 0 |________________________________
   0    100   200   300   400  Volume (mL)
              ↑              ↑
         1st desire      Micturition
         to void         threshold
📊 Diagram 5 - Q14: Chemical Regulation of Respiration
         HIGH PaCO2 / LOW pH / LOW PaO2
                      ↓
         ┌────────────┴────────────┐
         ↓                        ↓
  CENTRAL CHEMORECEPTORS   PERIPHERAL CHEMORECEPTORS
  (Ventrolateral medulla)  (Carotid + Aortic bodies)
  Stimulus: CO2 / H+       Stimulus: ↓PaO2 (<60 mmHg)
  (70-80% of CO2 response) CO2, H+
         ↓                        ↓
  Signals → Respiratory Centre (DRG + VRG in medulla)
                      ↓
         ↑ Rate and Depth of Breathing
                      ↓
         ↓ PaCO2 | ↑ PaO2 | ↑ pH (negative feedback)
- Central: CO2 crosses BBB → H2CO3 → H+ → stimulates ventilation (main driver)
- Peripheral: PaO2 <60 mmHg is the key trigger for peripheral chemoreceptors (glomus cells of carotid body via CN IX)
All diagrams sourced from Ganong's Review of Medical Physiology, Abbas Cellular & Molecular Immunology, and clinical ECG databases - consistent with GK Pal 1st MBBS content. Draw neat labeled diagrams in your exam wherever marked "Draw diagram" in the question.
DEPARTMENT OF PHYSIOLOGY, KIMS
Paper 2 - Third Internal Assessment | Complete Answers
(As per GK Pal / Ganong / Guyton - 1st MBBS)
LONG ESSAY (10 marks)
Q1. List the nuclei of Basal Ganglia and explain its functions. Enumerate the features of Parkinsonism.
A. NUCLEI OF BASAL GANGLIA
| Nucleus | Components | Location |
|---|---|---|
| Corpus Striatum | Caudate nucleus + Putamen + Globus pallidus | Telencephalon |
| Striatum | Caudate nucleus + Putamen | (Input nuclei) |
| Lentiform nucleus | Putamen + Globus pallidus | - |
| Globus Pallidus | GPi (internal) + GPe (external) | (Output nuclei) |
| Subthalamic nucleus (STN) | - | Diencephalon |
| Substantia nigra | Pars compacta (SNc) + Pars reticulata (SNr) | Midbrain |
B. CIRCUITS OF BASAL GANGLIA
- Direct pathway (facilitatory): Striatum → GPi/SNr → Thalamus → Cortex → Movement FACILITATED
- Indirect pathway (inhibitory): Striatum → GPe → STN → GPi/SNr → Thalamus → Cortex → Movement INHIBITED
- D1 receptors on direct pathway → stimulates (facilitates movement)
- D2 receptors on indirect pathway → inhibits (facilitates movement)
- Net effect of dopamine: promotes movement
C. FUNCTIONS OF BASAL GANGLIA
- Control of voluntary movement - Initiation, scaling, and sequencing of movements; planning of complex motor acts
- Suppression of unwanted movements - Prevents extraneous or competing movements through the indirect pathway
- Control of muscle tone - Inhibits unwanted muscle tone
- Cognitive and emotional functions - Limbic loop involved in motivation, reward, habit formation
- Learning procedural/motor skills - Habit learning (e.g., cycling, writing)
- Oculomotor control - Controls saccadic eye movements
- Language - Contributes to speech generation
D. FEATURES OF PARKINSONISM
- "Pill-rolling" tremor (4-6 Hz)
- Present at REST, disappears with voluntary movement
- Due to loss of dopamine → oscillatory thalamo-cortical activity
- Increased muscle tone in all directions (lead-pipe rigidity)
- With tremor: "Cogwheel rigidity" (jerky catch-and-release on passive movement)
- Affects all muscle groups
- Poverty and slowness of movement
- Difficulty initiating movement (akinesia)
- Reduced arm swing when walking
- Loss of postural reflexes
- Forward-stooped posture (flexed posture)
- Festinant (shuffling) gait - small rapid steps, difficulty stopping
- Masked face (hypomimia) - reduced facial expression
- Micrographia - small handwriting
- Hypophonia - low voice volume
- Drooling (sialorrhea)
- Autonomic dysfunction: constipation, orthostatic hypotension
- Dementia (late feature)
- Depression, sleep disturbances
- Loss of sense of smell (early feature)
SHORT ANSWERS - Reasoning Questions (3 marks each)
Q2. Explain why the action of excess Aldosterone secretion doesn't persist for long time (Aldosterone Escape)
-
Initial phase: Excess aldosterone → acts on principal cells of collecting duct → increased Na+ reabsorption + K+ and H+ secretion → Na+ and water retention → expanded ECF volume + increased BP
-
Escape mechanism (begins within 3-5 days):
- Expanded blood volume → increased renal perfusion pressure
- Increased perfusion pressure → pressure natriuresis and diuresis (Guyton's pressure-natriuresis mechanism) - kidneys excrete excess Na+ in response to elevated arterial pressure
- Expanded volume → increased ANP (Atrial Natriuretic Peptide) from atria → inhibits Na+ reabsorption in collecting duct
- Decreased proximal tubular Na+ reabsorption (increased GFR and reduced Angiotensin II)
-
Result: Despite persistently elevated aldosterone, urinary Na+ excretion increases → body escapes from Na+ retention → ECF volume reaches a new steady state (only slightly expanded)
- K+ wasting continues → hypokalemia persists in hyperaldosteronism
- H+ wasting continues → metabolic alkalosis persists
Q3. Explain the cause of secondary amenorrhea in a lactating mother
-
Nipple stimulation during breastfeeding → afferent nerve impulses → hypothalamus
-
Prolactin secretion:
- Suckling reflex → inhibits dopamine (PIF - Prolactin Inhibitory Factor) release from hypothalamus
- Without dopamine inhibition → anterior pituitary releases prolactin in high amounts
-
Prolactin suppresses GnRH:
- High prolactin levels → directly inhibit GnRH (Gonadotropin-Releasing Hormone) pulse generator in arcuate nucleus
- Also promotes endogenous opioid (beta-endorphin) production → further suppresses GnRH
-
Consequence:
- Decreased GnRH pulses → decreased FSH and LH secretion
- Without FSH: no follicular development
- Without LH: no ovulation, no corpus luteum, no progesterone
- Endometrium does not proliferate → NO menstruation
Suckling → ↓Dopamine → ↑Prolactin → ↓GnRH → ↓FSH/LH → No ovulation → Amenorrhea
Q4. Explain the physiological basis of Rigor Mortis
- During contraction: Myosin head binds to actin → power stroke (movement)
- Relaxation requires ATP: ATP binds to myosin head → breaks the actin-myosin bond → myosin head detaches from actin → muscle relaxes
-
Immediately after death: All metabolic activity stops → no O2 → aerobic ATP production stops
-
Short period after death: Brief anaerobic glycolysis using remaining glycogen produces small amount of ATP → muscles remain soft
-
ATP depletes completely (within 2-6 hours post-mortem):
- No ATP available for myosin-actin cross-bridge detachment
- Ca2+ pumps fail → Ca2+ accumulates in cytosol from SR
- Ca2+ binds troponin → allows actin-myosin binding
- Myosin heads bind to actin permanently (no ATP to detach them)
- Muscles become stiff and rigid = Rigor Mortis
-
Rigor is complete in about 6-12 hours (all muscles affected - from small muscles first: face, jaw → then body → large muscles last)
-
Resolution (after 24-48 hours): Proteolytic enzymes from autolysis degrade the actin-myosin complex → muscles become soft again
- Time of death estimation (appears 2-6 hrs, complete 12 hrs, disappears 24-48 hrs)
- Temperature affects onset (faster in hot weather)
Q5. Explain why cardiac pain is referred to the left arm
-
Visceral afferents from the heart travel in the sympathetic chain → enter the spinal cord at T1-T5 segments (mainly T1-T4)
-
These cardiac pain fibers converge onto the same second-order neurons in the dorsal horn (spinothalamic tract) that also receive somatic pain fibers from the left arm and chest wall (dermatomes T1-T4 = inner left arm, chest)
-
The brain is unable to distinguish the true source of pain - it has learned that pain signals from these spinal levels come from the body surface (arm, chest) rather than from internal organs (heart)
-
Therefore, the brain misinterprets the cardiac pain as coming from the left arm and chest wall
"The heart originates in the neck during embryonic development, as do the arms. Therefore, both the heart and these surface areas receive pain nerve fibers from the same spinal cord segments." - Guyton & Hall
Q6. Explain why a person's visibility gets better within a few minutes on entering a dark room (Dark Adaptation)
Phase 1 - Cone Adaptation (first 5-10 minutes):
- Cones adapt quickly (within 5-10 min)
- Cones regenerate their photopigments (cone opsins - iodopsin)
- Provides limited improvement in sensitivity
- Only useful in relatively dim (not total darkness) conditions
Phase 2 - Rod Adaptation (10-30 minutes):
- Rods adapt slowly but provide far greater sensitivity
- Rhodopsin (visual purple) regeneration:
- In bright light, rhodopsin is bleached (photolysed) - 11-cis-retinal → all-trans-retinal + opsin
- In darkness, the reaction reverses: all-trans-retinal → 11-cis-retinal (requires vitamin A/retinol) → rejoins opsin → rhodopsin regenerated
- More rhodopsin available → more sensitive to even small amounts of light
- Neural adaptation: Rod-to-ganglion cell convergence increases (many rods feed into one ganglion cell) → summation increases sensitivity
- After full dark adaptation (~30 min): rod threshold decreases by 100,000-fold (5 log units)
- The person can now detect very dim stimuli that were invisible on first entering the dark room
SHORT NOTES - 4×5 = 20 marks
Q7. Describe the clinical features of Cushing's Syndrome
Clinical Features (Effects of excess cortisol):
- Moon face (rounded, plethoric face) - redistribution of fat
- Buffalo hump (interscapular fat pad)
- Central obesity (truncal obesity with thin limbs - "lemon on sticks" appearance)
- Supraclavicular fat pads
- Purple/violaceous striae on abdomen, thighs (due to protein catabolism - weak connective tissue + skin thinning)
- Easy bruising and poor wound healing
- Hirsutism (excess androgen in some cases)
- Skin thinning and fragility
- Acne
- Proximal muscle weakness/wasting (protein catabolism)
- Osteoporosis → pathological fractures (cortisol inhibits osteoblasts, increases osteoclast activity)
- Hyperglycemia / Diabetes mellitus (cortisol is anti-insulin; increases gluconeogenesis)
- Hypertension (sodium retention, increased sensitivity to catecholamines)
- Hypokalemia (mineralocorticoid-like effect at high cortisol levels)
- Menstrual irregularity/amenorrhea in women
- Decreased libido and impotence in men
- Depression, anxiety, psychosis, emotional lability
- Insomnia
- Immunosuppression → increased susceptibility to infections
- Impaired delayed hypersensitivity
- Hypertension (very common)
- Polycythemia (mild)
- Growth retardation in children
Q8. Classify and explain neuromuscular blockers with examples
Classification:
| Feature | Details |
|---|---|
| Mechanism | Mimic ACh, bind and persistently activate nicotinic receptors → persistent depolarization → muscles unable to repolarize |
| Initial effect | Fasciculations (transient muscle twitching) before block |
| Block type | Phase I block (depolarizing) |
| Reversal | Cannot be reversed by anticholinesterases; spontaneous |
| Example | Succinylcholine (Suxamethonium) - most common |
| Use | Rapid sequence intubation (shortest onset and shortest duration) |
| S/E | Hyperkalemia, malignant hyperthermia, bradycardia, raised IOP |
| Feature | Details |
|---|---|
| Mechanism | Competitive antagonism of ACh at nicotinic receptors; no channel opening |
| Initial effect | No fasciculations |
| Block type | Competitive block |
| Reversal | Reversed by anticholinesterases (Neostigmine + Atropine) |
| Examples | See table below |
| Duration | Drug | Notes |
|---|---|---|
| Short-acting | Mivacurium | Hydrolyzed by plasma cholinesterase |
| Intermediate | Atracurium, Cisatracurium, Vecuronium, Rocuronium | Most commonly used |
| Long-acting | Pancuronium, Tubocurarine (d-TC) | Less used now |
| Feature | Depolarizing | Non-Depolarizing |
|---|---|---|
| Fasciculations | Yes | No |
| Reversal | No (spontaneous) | Yes (neostigmine) |
| Onset | Very fast (60-90 sec) | 2-5 min |
| Duration | Very short (5-10 min) | Longer |
| Example | Succinylcholine | Rocuronium, Vecuronium |
Q9. Explain the contraceptive methods in females
A. Barrier Methods:
- Female condom - polyurethane pouch; also STI protection
- Diaphragm - rubber dome placed over cervix; used with spermicide
- Cervical cap - smaller, fits directly on cervix
- Spermicides - chemicals that kill sperm (nonoxynol-9)
B. Hormonal Methods:
- Estrogen + Progestogen
- Mechanism: Inhibit LH surge → prevent ovulation; thicken cervical mucus; thin endometrium
- Efficacy: >99% if used correctly
- Contraindicated in: History of DVT, PE, migraine with aura, smokers >35 years
- Thickens cervical mucus, thins endometrium; less reliable ovulation inhibition
- Safe in breastfeeding mothers
- Depo-Provera (medroxyprogesterone acetate) - injection every 3 months
- Etonogestrel rod (Nexplanon) - lasts 3 years; highly effective
- Levonorgestrel (within 72 hrs) or Ulipristal acetate (within 120 hrs)
- Inhibits/delays ovulation; does not cause abortion of established pregnancy
C. Intrauterine Devices (IUDs):
- Copper IUD (Cu-T): Copper ions toxic to sperm; also inhibits implantation; lasts 10 years; can be emergency contraceptive
- Levonorgestrel IUS (Mirena): Releases progestogen locally; thickens mucus, thin endometrium; 5 years
D. Permanent Methods:
- Tubal ligation (tubectomy): Fallopian tubes cut, tied, or occluded → prevents sperm from reaching ovum
- Essure (hysteroscopic sterilization)
E. Natural Methods:
- Calendar/Rhythm method - avoid fertile days
- Lactational amenorrhea method (LAM) - exclusive breastfeeding <6 months; 98% effective if criteria met
- Withdrawal (coitus interruptus) - least reliable
Q10. Enumerate the differences between Upper Motor Neuron (UMN) and Lower Motor Neuron (LMN) Lesions
| Feature | UMN Lesion | LMN Lesion |
|---|---|---|
| Location of lesion | Cortex, internal capsule, brainstem, spinal cord (above AHC) | Anterior horn cell, nerve root, peripheral nerve, NMJ |
| Muscle tone | Increased (spasticity) - clasp-knife | Decreased (flaccidity/hypotonia) |
| Reflexes (deep tendon) | Exaggerated (hyperreflexia) | Absent or diminished (hyporeflexia) |
| Babinski sign | Positive (extensor plantar) | Absent (normal) |
| Muscle wasting | Disuse atrophy (mild, late) | Marked wasting (neurogenic atrophy - rapid) |
| Fasciculations | Absent | Present (spontaneous fibers contracting) |
| Clonus | Present | Absent |
| Paralysis type | Spastic paralysis | Flaccid paralysis |
| Distribution | Whole limb (pyramidal pattern) | Affected muscle group or distribution of nerve |
| Coordination | Impaired | Normal (unless cerebellar involvement) |
| Examples | Stroke, MS, spinal cord injury, brain tumor | Polio, GBS, peripheral neuropathy, MND (ALS) |
SHORT NOTES - 7×5 = 35 marks
Q11. Trace visual pathway and explain the effect of its lesion at various levels
Visual Pathway:
Retina (Rods + Cones)
    ↓ (bipolar cells → ganglion cells)
Optic Nerve (CN II)
    ↓
Optic Chiasm
    ↓
Optic Tract (nasal fibers cross; temporal fibers stay ipsilateral)
    ↓
Lateral Geniculate Body (LGB) - thalamus
    ↓
Optic Radiation (Geniculocalcarine tract)
    - Upper fibers (parietal lobe) → upper visual field
    - Lower fibers (Meyer's loop, temporal lobe) → lower visual field
    ↓
Primary Visual Cortex (Area 17, striate cortex, calcarine fissure, occipital lobe)
- Nasal retinal fibers cross at chiasm → carry temporal visual field information
- Temporal retinal fibers do NOT cross → carry nasal visual field information
- Each optic tract carries information from the contralateral visual field
Effects of Lesions at Various Levels:
| Site | Lesion | Visual Field Defect |
|---|---|---|
| 1. Optic nerve | E.g., optic neuritis, trauma | Monocular blindness (complete blindness in that eye only) |
| 2. Optic chiasm | E.g., pituitary adenoma compresses chiasm from below | Bitemporal hemianopia (loss of both temporal fields - tunnel vision) |
| 3. Optic tract | E.g., middle cerebral artery territory infarct | Homonymous hemianopia (contralateral) - e.g., left optic tract cut → loss of right visual field in BOTH eyes |
| 4. Upper optic radiation (parietal) | E.g., parietal lobe lesion | Lower quadrantanopia (pie on the floor) contralateral |
| 5. Lower optic radiation (Meyer's loop, temporal) | E.g., temporal lobe lesion | Upper quadrantanopia (pie in the sky) contralateral |
| 6. Visual cortex (occipital) | E.g., posterior cerebral artery infarct | Homonymous hemianopia with MACULAR SPARING (central vision preserved due to dual blood supply of macula) |
Q12. Explain the actions of Parathormone. What is Tetany?
Parathyroid Hormone (PTH):
- Acute (minutes-hours): Activates existing osteoclasts → bone resorption → releases Ca2+ and phosphate into blood
- Chronic: Increases osteoclast number and activity → sustained hypercalcemia
- Note: Intermittent low-dose PTH has anabolic effect on bone (used in osteoporosis treatment)
- Distal tubule: Increases Ca2+ reabsorption → decreases urinary Ca2+ loss
- Proximal tubule: Decreases phosphate reabsorption (phosphaturia) → lowers serum phosphate
- Activates 1-alpha hydroxylase → converts 25-OH-D3 → 1,25-(OH)2-D3 (Calcitriol/active Vit D)
- PTH stimulates active Vit D synthesis → active Vit D increases Ca2+ and phosphate absorption from intestine
TETANY:
- Low ionized Ca2+ → reduces threshold of nerve and muscle membranes → spontaneous depolarization of excitable cells → sustained muscle contractions
- Hypoparathyroidism
- Vitamin D deficiency
- Acute hyperventilation (respiratory alkalosis → reduced ionized Ca2+)
- Severe vomiting (metabolic alkalosis)
- Hypomagnesemia
- Chvostek's sign - tapping facial nerve → facial muscle twitching
- Trousseau's sign - inflating BP cuff on arm → carpal spasm ("main d'accoucheur" - obstetrician's hand)
- Carpopedal spasm - flexion of wrist/MCP joints + extension of IP joints (classic hand posture)
- Laryngospasm - stridor, can be fatal
- Bronchospasm
- Seizures
- Numbness, tingling (perioral + extremities)
Q13. Explain excitation-contraction coupling
In Skeletal Muscle:
- Motor neuron releases ACh → NMJ → muscle fiber action potential
- Action potential propagates along sarcolemma and down T-tubules (transverse tubules) into the fiber interior
- T-tubule action potential activates L-type Ca2+ channels (DHPR - Dihydropyridine receptor) in T-tubule membrane
- DHPR physically contacts and activates Ryanodine receptors (RyR1) on the Sarcoplasmic Reticulum (SR)
- SR releases large amount of Ca2+ into cytoplasm (from terminal cisternae)
- Cytosolic Ca2+ rises from 10-7 M → 10-5 M (100-fold increase)
- Ca2+ binds to Troponin C (on the troponin-tropomyosin complex)
- Conformational change: Tropomyosin shifts → exposes myosin-binding sites on actin
- Myosin heads bind to actin (cross-bridge formation)
- Power stroke: Myosin head bends → pulls actin toward M-line → sarcomere shortens → contraction
- ATP binds → myosin detaches from actin
- ATP hydrolysis → myosin re-cocks
- Cycle repeats as long as Ca2+ is present
- Action potential stops → Ca2+ pumped back into SR by SERCA (Ca2+-ATPase) pump
- Ca2+ leaves troponin → tropomyosin covers actin sites → no cross-bridge → relaxation
In Cardiac Muscle (key difference - CICR):
- DHPR (L-type Ca2+ channel) allows Ca2+ ENTRY from outside (small amount)
- This triggers Ca2+-Induced Ca2+ Release (CICR) from SR via RyR2
- Cardiac E-C coupling depends on extracellular Ca2+ entry; skeletal does not
Q14. Describe the contents and functions of the middle ear
Contents:
- Separates external from middle ear
- Converts sound waves → mechanical vibrations
- Area: ~55 mm2; divided into pars tensa and pars flaccida
| Ossicle | Connection | Function |
|---|---|---|
| Malleus (hammer) | Handle attached to TM | Picks up vibrations from TM |
| Incus (anvil) | Between malleus and stapes | Transmits vibrations |
| Stapes (stirrup) | Footplate in oval window | Delivers vibrations to oval window/perilymph |
- Tensor tympani (attached to malleus; CN V3) → tenses TM → reduces large vibrations
- Stapedius (attached to stapes; CN VII - smallest skeletal muscle in body) → pulls stapes back → protective reflex against loud sounds (acoustic reflex)
- Connects middle ear to nasopharynx
- Normally closed; opens during swallowing/yawning
- Function: Equalizes air pressure between middle ear and atmosphere (prevents TM damage)
- Opens via tensor veli palatini (CN V3)
- Oval window - receives stapes footplate; connected to scala vestibuli of cochlea
- Round window - allows fluid movement in cochlea; opposite phase to oval window
Functions of Middle Ear:
-
Impedance matching (most important): Converts air vibrations to fluid vibrations in the cochlea. Without middle ear, 99.9% of sound energy would be reflected at air-fluid interface. Middle ear provides ~25-30 dB amplification through:
- Area ratio of TM to oval window = 55:3.2 mm2 = 17:1 (hydraulic amplification)
- Lever ratio of ossicles = 1.3:1
- Total amplification = 17 × 1.3 = ~22-fold
-
Protection from loud sounds - acoustic reflex (stapedius + tensor tympani)
-
Pressure equalization - via Eustachian tube
Q15. Describe the actions of Oxytocin
Actions:
- Stimulates smooth muscle of uterus to contract
- Sensitivity of uterus to oxytocin increases dramatically near term (increased oxytocin receptors)
- Positive feedback: Uterine contractions stimulate oxytocin release → more contractions (Ferguson reflex)
- Initiates and sustains labor; expels fetus
- Clinical use: Syntocinon (synthetic oxytocin) to induce or augment labor; prevent/treat postpartum hemorrhage
- Suckling of nipple → neural reflex → hypothalamus → posterior pituitary → oxytocin release
- Oxytocin acts on myoepithelial cells around mammary alveoli → cells contract → milk is squeezed from alveoli into ducts → milk ejected through nipple
- Note: Oxytocin does NOT produce milk (that is prolactin's role); it EJECTS already-produced milk
- Hearing the baby cry or emotional stimulus can also trigger let-down
- Postpartum uterine contractions (after-pains) facilitate return of uterus to pre-pregnant size
- Reduces postpartum bleeding
- Social bonding - maternal bonding (mother-infant), pair bonding between partners
- Trust, empathy - "love hormone" or "bonding hormone"
- Reduces anxiety and stress (anxiolytic effect)
- Sexual behavior - released during orgasm in both sexes; promotes attachment
- Vasodilation (via NO release) at high doses
- Brief hypotension
- Milk production (prolactin does that)
- Ovulation
Q16. Explain the properties of sensory receptors
Properties:
- Each receptor is maximally sensitive to one specific type of stimulus (its "adequate stimulus")
- E.g., photoreceptors respond to light; thermoreceptors to temperature; mechanoreceptors to touch
- Labeled line theory: The quality of sensation depends on which receptor/pathway is activated, not the nature of stimulus (e.g., pressure on eye is perceived as light)
- Conversion of stimulus energy into a generator potential (receptor potential) - a graded, depolarizing potential
- Generator potential is graded (proportional to stimulus intensity)
- When generator potential reaches threshold → triggers action potential in afferent nerve
- Local graded change in membrane potential in the receptor
- NOT an action potential (no threshold, no all-or-none)
- Larger stimulus → larger generator potential → higher frequency of action potentials
- Minimum stimulus intensity required to produce a generator potential large enough to fire an action potential
- Below threshold: no nerve impulse generated
- Decline in the frequency of nerve firing despite constant stimulus
- Two types:
- Rapidly adapting (phasic) receptors: Respond to onset and offset of stimulus; adapt quickly; detect rate of change (e.g., Meissner's corpuscles, Pacinian corpuscles, olfactory receptors)
- Slowly adapting (tonic) receptors: Continue firing as long as stimulus is applied; detect sustained stimulus intensity (e.g., Merkel's discs, Ruffini endings, muscle spindles, baroreceptors initially)
- Intensity coded by: (a) frequency of action potentials (rate coding), (b) number of receptors activated (population coding)
- Area of body surface where stimulation excites a particular receptor
- Smaller receptive field = greater two-point discrimination (fingertip)
- Larger receptive field = less discrimination (back)
- Each receptor type detects a specific modality (touch, pressure, temperature, pain, etc.)
- By stimulus: Mechanoreceptors, thermoreceptors, chemoreceptors, nociceptors, photoreceptors
- By location: Exteroceptors, interoceptors, proprioceptors
- By structure: Free nerve endings, encapsulated (Meissner's, Pacinian, Ruffini, Merkel's)
Q17. Enumerate the rights and responsibilities of a patient
A. RIGHTS OF A PATIENT:
- Receive appropriate, timely medical care without discrimination based on gender, religion, caste, economic status
- Be informed about diagnosis, proposed treatment, alternatives, risks, benefits in understandable language
- Give or withhold consent before any procedure (except emergency)
- Right to refuse treatment
- Know about diagnosis, prognosis, treatment options
- Access to medical records and reports (at a reasonable cost)
- Know the name, designation of treating doctor
- Medical information, diagnosis, and examination must be kept confidential
- Physical privacy during examination and procedures
- Seek consultation from another doctor without coercion
- Be treated with respect, dignity, and compassion at all times
- Freedom from abuse, neglect, or discrimination
- Receive life-saving emergency treatment regardless of ability to pay
- Be protected from harm, medical errors, hospital-acquired infections
- Receive continuous care; not be abandoned mid-treatment
- File complaints, seek redressal from hospital, consumer court, medical council
- Choose treating doctor and healthcare facility
B. RESPONSIBILITIES OF A PATIENT:
- Give complete, honest history (symptoms, previous illnesses, allergies, current medications, lifestyle)
- Comply with medication schedule, investigations, dietary advice
- Treat doctors, nurses, and staff with courtesy and respect
Sources: Ganong's Review of Medical Physiology 26th ed. | Guyton & Hall Textbook of Medical Physiology | Costanzo Physiology 7th ed. | Adams & Victor's Principles of Neurology | Harrison's Principles of Internal Medicine 22nd ed. - All consistent with GK Pal's Textbook of Medical Physiology content for 1st MBBS.