
Teach me ecg
Asking for Preferences
What's your background with ECG? · What do you want to focus on?
Reading File
Now let me search the library for ECG content in parallel.
Finding Sources
Finding Sources
Good - Braunwald's Heart Disease (cardiology) and Rosen's Emergency Medicine have strong ECG sections. Let me pull content from those in parallel.
Reading File
Reading File
Finding Sources
Let me now search for core ECG content - waveforms, intervals, systematic approach.
Finding Sources
Finding Sources
Finding Sources
Finding Sources
Finding Sources
Goldman-Cecil has a "NORMAL INTERVALS" section. Let me pull that and look for ECG images.
Reading File
Reading File
Excellent - I found rich Goldman-Cecil content with diagrams. Let me get more of that core ECG section and fetch the cardiac conduction image.
Reading File
Loading Image
Let me now fetch the normal ECG image and get more content on the systematic reading approach.
Loading Image
Reading File
I now have enough rich, authoritative material from Goldman-Cecil Medicine to build a complete ECG teaching guide. Let me compile the full response.
ECG Interpretation: A Complete Guide for Medical Students
1. Why the ECG Works - The Electrical Foundation
Before reading a strip, you need to understand what is being recorded.
The heart has a dedicated electrical conduction system. Depolarization starts spontaneously at the SA node (high right atrium), spreads through both atria, is briefly delayed at the AV node, then races down the Bundle of His → right and left bundle branches → Purkinje fibers → ventricular muscle.
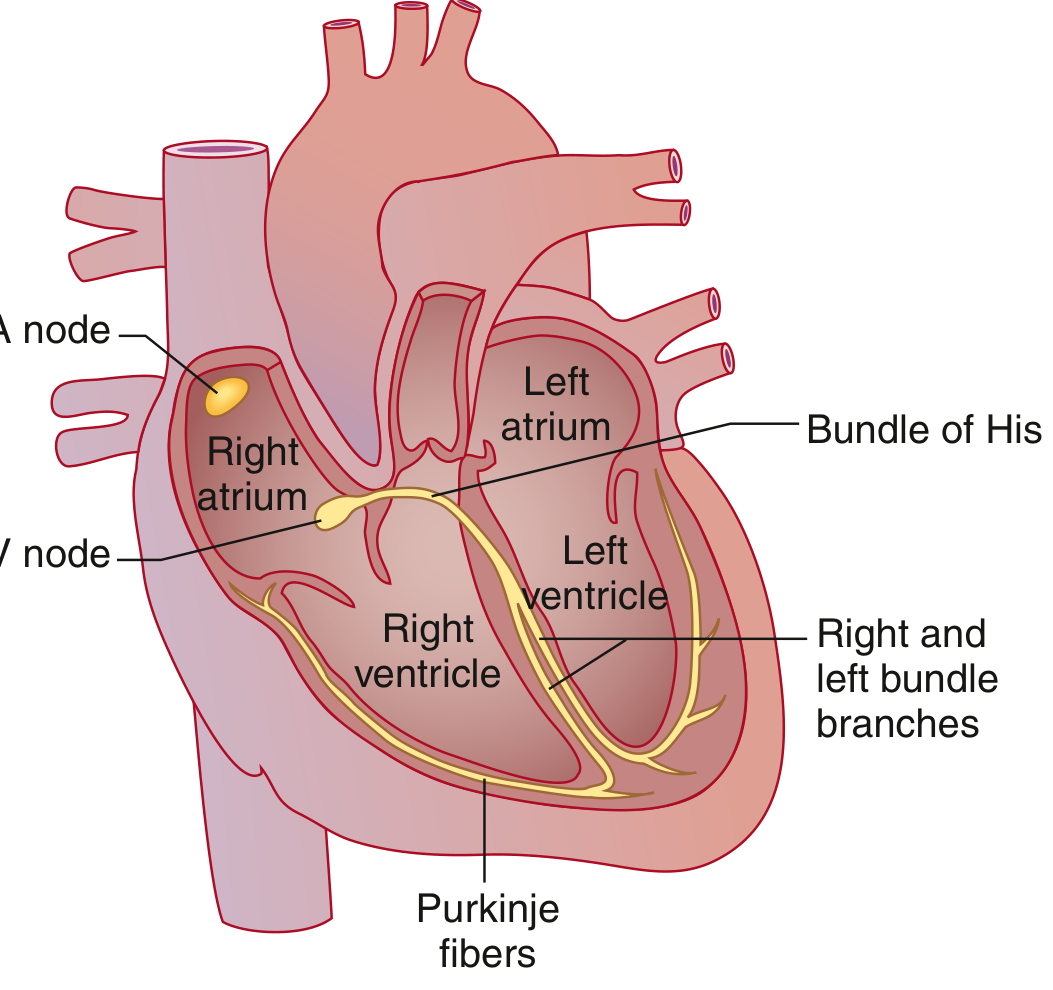
Goldman-Cecil Medicine, cardiac conduction system
Each time a wave of depolarization moves toward a lead, the ECG draws an upward deflection. Movement away from a lead draws a downward deflection.
2. The ECG Paper
The paper runs at 25 mm/second.
| Box | Width (time) | Height (voltage) |
|---|---|---|
| Small box | 0.04 sec (40 ms) | 0.1 mV |
| Large box (5 small) | 0.20 sec (200 ms) | 0.5 mV |
3. The Leads - 12 Viewpoints of the Heart
A 12-lead ECG looks at the heart from 12 different angles simultaneously.
Limb leads (frontal plane):
- I, II, III - standard bipolar
- aVR, aVL, aVF - augmented unipolar
Chest (precordial) leads (horizontal plane):
- V1 - right side of the septum
- V2 - right ventricle
- V3-V4 - anterior wall (transition zone)
- V5-V6 - lateral left ventricle
Regional groupings (critical for MI localization):
| Region | Leads |
|---|---|
| Inferior | II, III, aVF |
| Anterior | V2, V3, V4 |
| Lateral | I, aVL, V5, V6 |
| Septal | V3, V4 |
| Right ventricular | V1 |
4. The Waveforms - What Each One Means
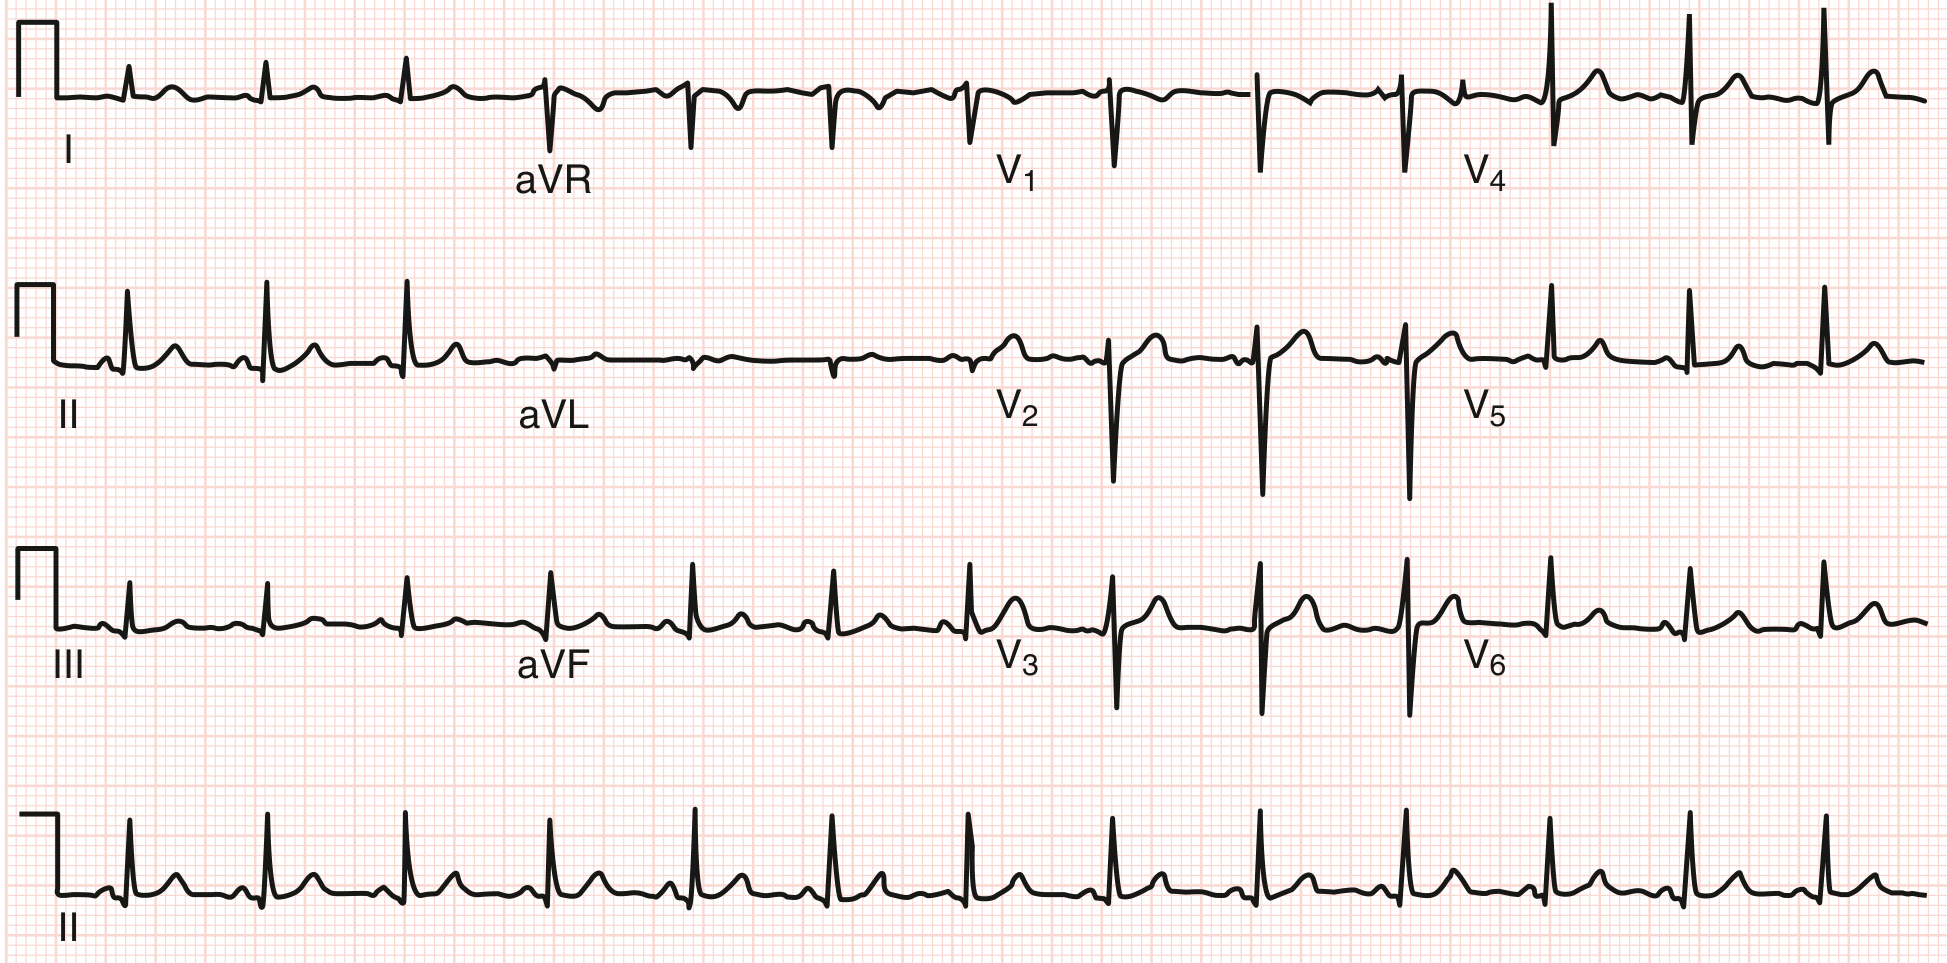
Normal ECG - Goldman-Cecil Medicine. HR ~78 bpm, PR 140 ms, QRS 90 ms, QTc 360 ms
The Waves Explained
| Wave/Segment | What It Represents |
|---|---|
| P wave | Atrial depolarization (atrial contraction) |
| PR interval | AV node delay (conduction from atria to ventricles) |
| QRS complex | Ventricular depolarization (ventricular contraction) |
| ST segment | Early ventricular repolarization (should be on the baseline) |
| T wave | Ventricular repolarization |
| QT interval | Total duration of ventricular electrical activity |
| U wave | Rarely seen; may reflect Purkinje repolarization |
| J point | Junction between end of QRS and start of ST segment |
QRS naming convention:
- Capital letters (Q, R, S) = deflection ≥5 mm (0.5 mV)
- Lowercase (q, r, s) = deflection <5 mm
- First negative deflection = Q/q
- First positive deflection = R/r
- Negative deflection after R = S/s
- All-negative complex = QS
5. Normal Values - Memorize These
From Goldman-Cecil Medicine (the most clinically used reference ranges):
| Parameter | Normal Range |
|---|---|
| Heart rate | 50-100 bpm |
| P wave duration | <120 ms (3 small boxes) |
| PR interval | 90-200 ms (0.09-0.20 sec) |
| QRS duration | 75-110 ms (<3 small boxes) |
| QTc (males) | 390-450 ms |
| QTc (females) | 390-460 ms |
| QRS axis | -30° to +90° |
6. The Systematic Approach - Never Miss Anything
Always read ECGs in the same order, every time. This is the Goldman-Cecil systematic approach:
Step 1: Rate
- Count large boxes between two consecutive R waves
- 1 box = 300 bpm | 2 = 150 | 3 = 100 | 4 = 75 | 5 = 60 | 6 = 50
- For irregular rhythms: count beats in 10 seconds × 6
Step 2: Rhythm
- Is it regular or irregular?
- Is every P wave followed by a QRS?
- Is every QRS preceded by a P wave?
- Normal sinus rhythm: P wave positive in II, negative in aVR, followed by QRS at PR 120-200 ms
Step 3: Axis
- Look at leads I and aVF
- Both positive → Normal axis (0° to +90°)
- I positive, aVF negative → Left axis deviation (LAD, <-30°)
- I negative, aVF positive → Right axis deviation (RAD, >+90°)
- Both negative → Extreme axis ("no man's land")
Step 4: P Wave
- Shape: smooth, rounded, <120 ms, <2.5 mm tall
- Positive in I and II, biphasic in V1 (normal)
- Abnormal: broad/notched (left atrial enlargement), tall/peaked (right atrial enlargement)
Step 5: PR Interval
- Normal: 120-200 ms
- Long PR (>200 ms) = 1st degree AV block
- Short PR (<120 ms) = WPW or junctional rhythm
- Variable PR = Wenckebach (Mobitz I) or complete heart block
Step 6: QRS Complex
- Duration: <110 ms
- Wide QRS (>120 ms) = bundle branch block, ventricular rhythm, or hyperkalemia
- Tall R in V1 = RBBB, RVH, posterior MI, WPW
- R wave should grow V1→V5 ("R wave progression"). Poor progression suggests anterior MI or LBBB.
- Deep Q waves (>40 ms wide or >25% of R wave height) = pathological; suggest prior MI
Step 7: ST Segment
- Should be isoelectric (flat at baseline)
- ST elevation: STEMI, pericarditis (diffuse saddle-shaped), Brugada, early repolarization
- ST depression: NSTEMI/ACS, LVH strain pattern, digoxin effect
Step 8: T Wave
- Normally concordant with QRS (same direction as terminal QRS)
- Inverted T waves: ischemia, LVH, RBBB (V1-V3), PE (V1-V4)
- Tall peaked T waves: hyperkalemia, hyperacute STEMI (very early finding)
Step 9: QT Interval
- Correct for rate using Bazett formula: QTc = QT / √RR
- Long QTc (>450 ms men, >460 ms women): drugs (antiarrhythmics, antipsychotics, antibiotics), hypokalemia, hypomagnesemia → risk of torsades de pointes
7. Key Patterns Every Medical Student Must Know
Sinus Rhythms
| Rhythm | Rate | Features |
|---|---|---|
| Normal sinus | 60-100 | P before every QRS, regular |
| Sinus tachycardia | >100 | Same morphology, fast |
| Sinus bradycardia | <60 | Same morphology, slow |
| Sinus arrhythmia | Varies | Rate varies with breathing - normal! |
Bundle Branch Blocks
- RBBB: Wide QRS + RSR' ("rabbit ears") in V1 + wide S in I and V6
- LBBB: Wide QRS + broad notched R in I, aVL, V5-V6 + QS in V1
- Memory trick: WiLLiaM MaRRoW (W pattern in V1 = LBBB; M in V1 = RBBB)
Hypertrophy
- LVH: S in V1 + R in V5 or V6 > 35 mm (Sokolow-Lyon criteria)
- RVH: Dominant R in V1 + right axis deviation
MI Localization
When you see ST changes, match the leads to the region and the coronary artery:
| Territory | Leads | Artery |
|---|---|---|
| Inferior MI | II, III, aVF | RCA |
| Anterior MI | V2-V4 | LAD |
| Lateral MI | I, aVL, V5-V6 | LCx or LAD diagonal |
| Posterior MI | Tall R + ST depression in V1-V2 | RCA or LCx |
8. The Sequence of Change in STEMI
The ECG evolves over time in acute MI:
- Hyperacute T waves (first minutes) - tall, broad-based, asymmetric T waves
- ST elevation (minutes to hours) - J point elevation with upward sloping ST
- Q wave formation (hours to days) - pathological Q = dead tissue
- T wave inversion (hours to days)
- ST normalization (days to weeks)
- Persistent Q waves (permanent scar)
As Rosen's Emergency Medicine notes, the ST elevation criteria for STEMI are:
- ≥1 mm in ≥2 contiguous leads (most leads)
- ≥1.5 mm in females in V2-V3
- ≥2.5 mm in males <40 years in V2-V3
- ≥2.0 mm in males ≥40 years in V2-V3
9. Practical Tips for Exam Reading
- Always state the rate and rhythm first - it orients everything else
- Never call LBBB "normal" - an isolated new LBBB needs cardiac workup
- Check the calibration box (should be 1 mV = 10 mm tall) - if missing or wrong, voltages are unreliable
- Reciprocal changes confirm MI - ST elevation in inferior leads + ST depression in I/aVL = true inferior STEMI
- Compare to old ECGs when available - "new" changes matter far more than chronic findings
- Axis in lead I and aVF first, then refine - this two-lead trick gets you close enough in seconds
Summary: The One-Page Cheat Sheet
RATE   → Large box method (300/150/100/75/60/50)
RHYTHM → P before QRS? Regular? QRS rate = P rate?
AXIS   → I + aVF: both up = normal; I up/aVF down = LAD; I down/aVF up = RAD
P      → Smooth, <120 ms, positive in II
PR     → 120-200 ms. Long = AV block. Short = WPW/junctional
QRS    → <110 ms. Wide = BBB. Q waves = infarct
ST     → Flat at baseline. Up = STEMI/pericarditis. Down = ischemia/LVH
T      → Concordant with QRS. Inverted = ischemia/RVH. Peaked = hyperK
QT     → QTc < 440-460 ms. Long = drug effect / electrolytes
Sources: Goldman-Cecil Medicine, 26th Ed. | Rosen's Emergency Medicine, 9th Ed. | Braunwald's Heart Disease, 12th Ed.
Want me to go deeper on any section - arrhythmias, bundle branch blocks, ischemia patterns, or axis calculation? I can also walk you through reading actual ECG strips.
Walk me through reading an ECG strip step-by-step
Finding Sources
Finding Sources
Harrison's has the exact 14-step clinical interpretation checklist. Let me pull that section plus get ECG strip images.
Reading File
Finding Sources
Reading File
Reading File
I have everything I need. Let me fetch the key Harrison's images and deliver the full step-by-step walkthrough.
Loading Image
Loading Image
I have everything needed for a thorough, image-rich step-by-step walkthrough. Here it is:
Reading an ECG Strip: Step-by-Step
Think of this as a ritual - same order, every single time. Harrison's describes 14 parameters to check. I've grouped them into 9 logical steps you can memorize and apply in 90 seconds at the bedside.
Before You Start: Check the Calibration
Look at the top-left corner of any ECG. There should be a calibration box - a square pulse that is exactly 1 mV = 10 mm tall and 0.2 sec (1 large box) wide.
If the calibration is set to half (5 mm = 1 mV), all voltages look smaller than they are. If it's double, everything looks larger. Always check this first or you'll misread hypertrophy and low-voltage patterns.
Also verify: are leads labeled? Any artifact or lead reversal obvious?
Step 1: Heart Rate
The large-box method (fast, works for regular rhythms):
Count the number of large boxes between two consecutive R waves (the tallest peaks), then divide:
| Large boxes | Rate (bpm) |
|---|---|
| 1 | 300 |
| 2 | 150 |
| 3 | 100 |
| 4 | 75 |
| 5 | 60 |
| 6 | 50 |
Mnemonic: "300, 150, 100, 75, 60, 50" - learn this sequence cold.
For irregular rhythms (e.g., atrial fibrillation): count all QRS complexes in a 10-second strip and multiply by 6.
Normal rate: 60-100 bpm. <60 = bradycardia. >100 = tachycardia.
Step 2: Rhythm - Is It Regular?
Mark two consecutive R-R intervals with calipers (or a piece of paper). Walk that distance across the whole strip. If every R-R interval is the same → regular. If it varies → irregular.
Now ask three questions:
| Question | What you're testing |
|---|---|
| Is there a P wave before every QRS? | Is atrial activity driving ventricular activity? |
| Is there a QRS after every P wave? | Is every atrial impulse conducted? |
| Do all P waves look the same? | Are they all from the SA node? |
Normal sinus rhythm (NSR) criteria:
- Rate 60-100 bpm
- P wave positive in lead II, negative in aVR (this confirms SA node origin)
- Regular P-P and R-R intervals
- PR interval 120-200 ms, constant
Step 3: Axis - Which Way Is the Heart Pointing?
The QRS axis tells you the mean electrical direction of ventricular depolarization. Look at just two leads: I and aVF.
| Lead I | Lead aVF | Axis | Meaning |
|---|---|---|---|
| Positive (R > S) | Positive (R > S) | Normal (-30° to +90°) | Normal |
| Positive | Negative | Left axis deviation (LAD) | LAFB, LVH, inferior MI |
| Negative | Positive | Right axis deviation (RAD) | RVH, LPFB, lateral MI, PE |
| Negative | Negative | Extreme axis ("northwest") | Ventricular rhythm, severe disease |
A quick memory trick: leads I and aVF are like compass needles - both pointing "in" = normal axis.
Step 4: P Wave
Use lead II (best P wave view) and V1 (shows atrial enlargement patterns).
Ask:
- Shape: smooth and rounded? (normal) or notched/peaked?
- Duration: <120 ms (3 small boxes)?
- Amplitude: <2.5 mm (2.5 small boxes) tall?
- Axis: positive in II, I, aVF? Negative in aVR?
| P wave abnormality | Appearance | Meaning |
|---|---|---|
| Normal | Smooth, <120 ms, positive in II | Sinus rhythm |
| P mitrale | Broad, notched in II; biphasic in V1 | Left atrial enlargement |
| P pulmonale | Tall, peaked (>2.5 mm) in II | Right atrial enlargement |
| Absent P waves | No P waves at all | Atrial fibrillation, junctional rhythm |
| Retrograde P | Negative in II, positive in aVR | Junctional or ventricular origin |
Step 5: PR Interval
Measure from the start of the P wave to the start of the QRS complex in the lead where both are clearly visible (usually II or V1).
Normal: 120-200 ms (3-5 small boxes)
| PR finding | Value | Meaning |
|---|---|---|
| First-degree AV block | >200 ms, constant | Delayed AV node conduction |
| Mobitz I (Wenckebach) | Progressive lengthening then dropped beat | AV node fatigue |
| Mobitz II | Constant PR, then sudden dropped QRS | Infranodal block - dangerous |
| Complete heart block | P and QRS unrelated | Full AV dissociation |
| Short PR | <120 ms | WPW (pre-excitation), junctional rhythm |
Step 6: QRS Complex
This is the most information-dense part of the ECG. Break it into four sub-checks:
6a. Duration
Measure from the start to the end of the QRS. Normal: 75-110 ms (<3 small boxes).
- Wide QRS (≥120 ms) = Bundle branch block, ventricular paced rhythm, ventricular tachycardia, hyperkalemia, Na-channel blocker toxicity
BBB pattern recognition:
| Pattern | V1 shape | Lateral leads (I, aVL, V6) |
|---|---|---|
| RBBB | rSR' ("rabbit ears") | Wide S wave |
| LBBB | QS or rS (all negative) | Tall, broad, notched R wave |
Memory trick: WiLLiaM MaRRoW
- W in V1 + M in V6 = LBBB
- M in V1 + W in V6 = RBBB
6b. Voltage
- LVH (Sokolow-Lyon): S in V1 + R in V5 or V6 ≥ 35 mm
- RVH: Dominant R in V1 (R > S) + right axis deviation
- Low voltage: all QRS amplitudes <5 mm in limb leads OR <10 mm in precordial leads → think effusion, hypothyroidism, infiltrative disease
6c. R-Wave Progression
The diagram below shows why R waves should grow as you move from V1 to V6:
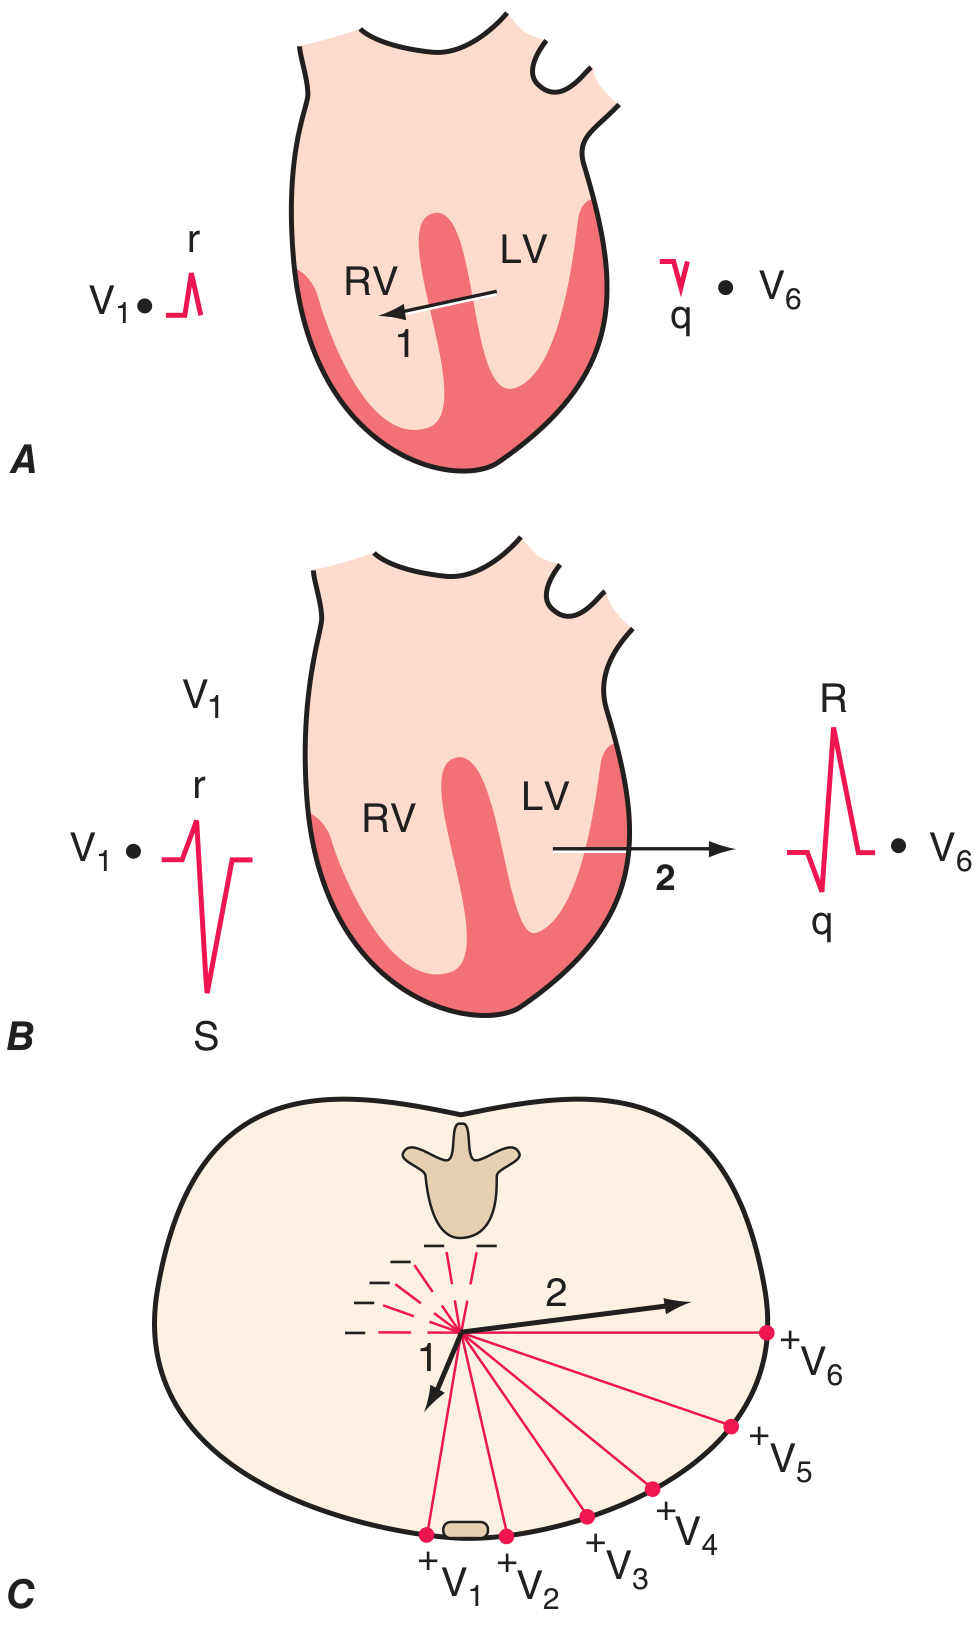
Harrison's, 22nd Ed. - Ventricular depolarization vectors explain R-wave progression
Here's the chest lead placement for reference:
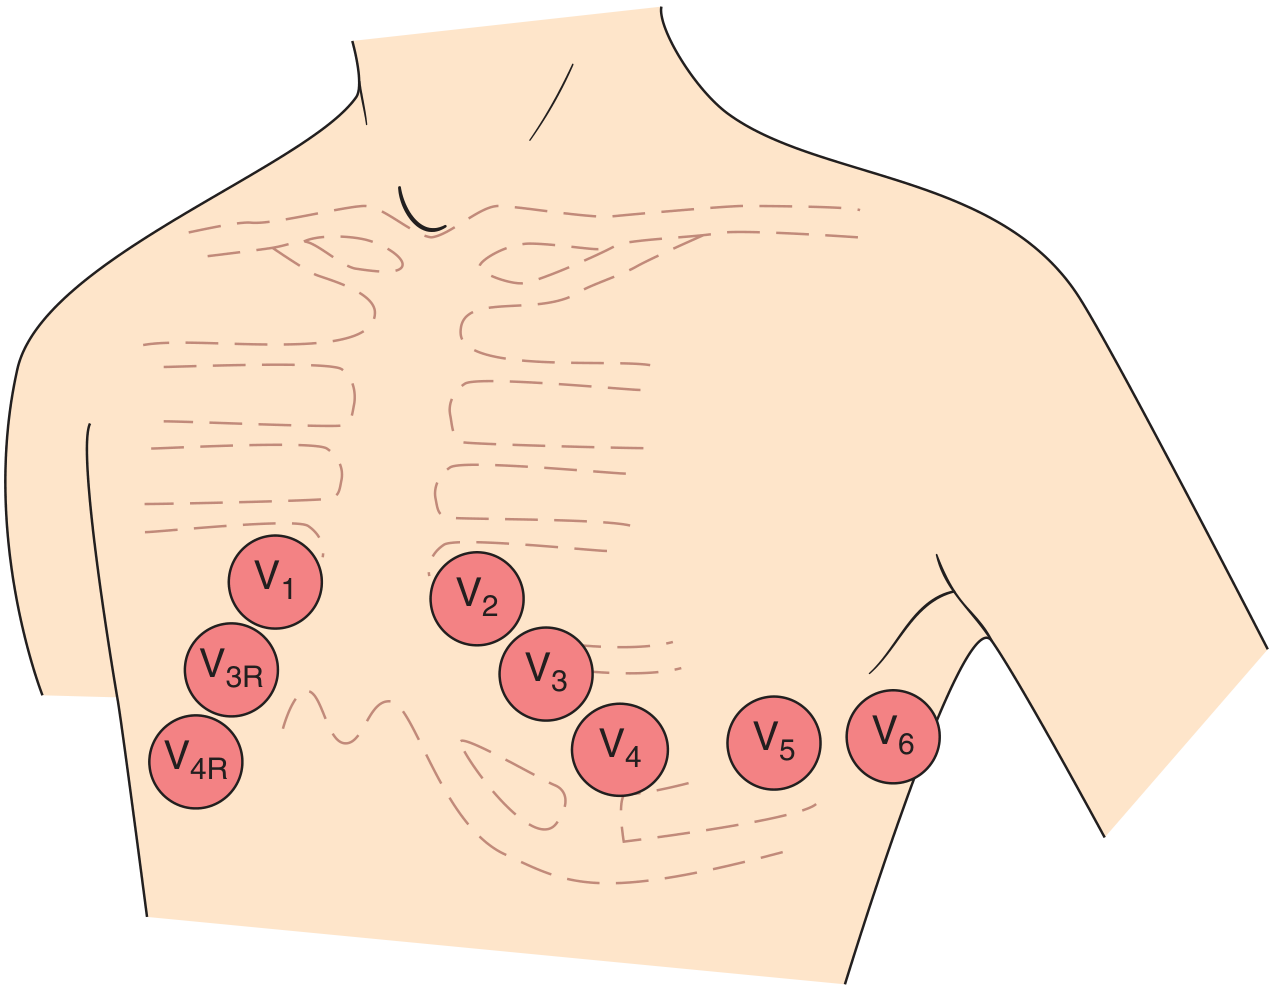
Harrison's, 22nd Ed. - Chest lead electrode positions
- V1: predominantly negative (small r, deep S) - right side of septum
- V3-V4: transition zone where R ≈ S
- V5-V6: predominantly positive (tall R) - lateral LV
Poor R-wave progression (R remains small through V4): anterior MI, LBBB, LVH, misplaced leads
6d. Pathological Q Waves
A Q wave is pathological if:
- Width ≥ 40 ms (1 small box)
- Depth ≥ 25% of the R wave height in the same lead
- Seen in ≥2 contiguous leads
Normal exceptions: Small q waves ("septal q") in I, aVL, V5, V6 are normal. aVR can have a large Q normally.
Pathological Q waves = electrical scar from old infarction. Match the leads to the territory:
| Q waves in... | Territory | Artery |
|---|---|---|
| II, III, aVF | Inferior | RCA |
| V1-V4 | Anterior | LAD |
| I, aVL, V5-V6 | Lateral | LCx |
Step 7: ST Segment
The ST segment connects the end of the QRS (J point) to the start of the T wave. It should be flat at the isoelectric baseline (same level as the PR segment).
Measure elevation or depression at the J point, then 60-80 ms after.
ST Elevation
| Pattern | Appearance | Cause |
|---|---|---|
| STEMI | Convex upward ("tombstone"), in contiguous regional leads | Acute MI - emergent |
| Pericarditis | Diffuse saddle-shaped elevation in most leads + PR depression | Inflammation |
| Early repolarization | Concave upward ("smiley face"), notched J point, V4-V6 | Benign variant (usually) |
| Brugada | Coved ST elevation in V1-V2 + RBBB morphology | Channelopathy, risk of SCD |
| LV aneurysm | Persistent elevation weeks after MI, no dynamic change | Scar |
ST Depression
| Pattern | Leads | Cause |
|---|---|---|
| Horizontal or downsloping | Regional | NSTEMI / active ischemia |
| Upsloping | Regional | Rate-related, less specific |
| "Strain pattern" (downsloping + T inversion) | V5-V6 or I, aVL | LVH strain |
| Reciprocal changes | Opposite to ST elevation leads | Confirms STEMI - look for these |
| Digoxin effect | Any | Classic "scooped" ST depression |
Step 8: T Wave
T waves should be:
- Same direction as the QRS in most leads (concordant)
- Upright in I, II, V3-V6
- Inverted in aVR (normal)
- May be inverted in V1 and III (normal variant)
| T wave change | Leads | Think |
|---|---|---|
| Tall, peaked, symmetric | Any | Hyperkalemia, hyperacute STEMI |
| Deep symmetric inversion | Regional | Ischemia, Wellens syndrome |
| V1-V3 inversion | Right precordial | RBBB (normal), RVH, PE, anterior ischemia |
| Diffuse T inversion | All leads | Myocarditis, raised ICP, CNS event |
| Flat/biphasic T | Regional | Early ischemia, electrolyte abnormality |
Wellens syndrome (a pattern every med student must know): deeply inverted or biphasic T waves in V2-V3 in a pain-free patient = critical LAD stenosis. Do NOT stress test this patient.
Step 9: QT Interval
Measure from start of QRS to end of T wave. Use lead II or V5 where it's clearest.
Always correct for heart rate using Bazett's formula:
QTc = QT (sec) ÷ √RR interval (sec)
Normal QTc:
- Males: 390-450 ms
- Females: 390-460 ms
| QTc | Interpretation |
|---|---|
| <350 ms | Short QT (hypercalcemia, digoxin, genetic) |
| 390-450/460 ms | Normal |
| 450-500 ms | Borderline prolonged |
| >500 ms | Markedly prolonged - high risk of torsades de pointes |
Common causes of long QT: hypokalemia, hypomagnesemia, class Ia/III antiarrhythmics, antipsychotics (haloperidol, quetiapine), macrolides, fluoroquinolones, congenital long QT syndromes.
Putting It All Together: The 90-Second Script
When you pick up an ECG strip, say this out loud (or in your head):
"Rate is ___ bpm. Rhythm is [regular/irregular]. I see [P before every QRS / no P waves / variable PR]. Axis: Lead I is [up/down], aVF is [up/down] → [normal/LAD/RAD]. P waves are [normal/abnormal]. PR is ___ ms - [normal/prolonged/short]. QRS is ___ ms - [narrow/wide]. R-wave progression is [normal/poor]. [No / Pathological] Q waves in [leads]. ST segments are [isoelectric / elevated in ___ / depressed in ___]. T waves are [concordant / inverted in ___]. QTc is ___ ms.""My interpretation is: [Primary diagnosis]. [Secondary findings]."
Quick Reference Card
STEP  | CHECK                    | NORMAL
------|--------------------------|---------------------------
1     | Rate                     | 60-100 bpm
2     | Rhythm                   | Regular, P before every QRS
3     | Axis                     | I ↑ + aVF ↑ = normal
4     | P wave                   | Smooth, <120ms, + in II
5     | PR interval              | 120-200 ms, constant
6a    | QRS duration             | <110 ms
6b    | QRS voltage              | Not too tall, not too small
6c    | R-wave progression       | r small V1 → R tall V5-6
6d    | Q waves                  | No pathological Q waves
7     | ST segment               | Flat at baseline
8     | T wave                   | Concordant, upright in I,II
9     | QTc                      | <450 ms men / <460 ms women
The real skill comes from repetition - reading 10 ECGs a week is worth more than any amount of reading. A great free practice resource is ECG Wave-Maven at BIDMC - hundreds of real strips with expert interpretations, recommended by Harrison's itself.
Want to try working through a specific abnormal pattern next - arrhythmias, bundle branch blocks, or MI localization?
Work through a STEMI ECG example step-by-step
Finding Sources
Finding Sources
Reading File
Finding Sources
Excellent - found a hyperacute T wave ECG image and STEMI evolution content. Let me fetch that ECG image and pull more anatomical localization content in parallel.
Loading Image
Reading File
I have an anterior STEMI ECG image URL and more. Let me fetch the anterior STEMI ECG and the inferior STEMI ECG images simultaneously, and read more of the localization content.
Loading Image
Reading File
I have real ECG images showing anterior STEMI (V1-V4) and the hyperacute T wave progression. Let me fetch the inferior STEMI and posterior MI images too.
Reading File
I now have all the content and images needed. Let me fetch the inferior STEMI ECG image and then deliver the full worked example.
Loading Image
I have enough real ECG images from Rosen's Emergency Medicine to build the full walkthrough. Here it is:
Working Through a STEMI ECG: Step-by-Step
We'll work through two real examples pulled from Rosen's Emergency Medicine - first an Anterior STEMI, then apply the same logic to an Inferior STEMI. Follow each step exactly as you would in a clinical setting.
The Case
Patient: 58-year-old male. 45 minutes of crushing central chest pain radiating to the left arm. Diaphoretic, BP 100/70. This ECG is placed in front of you.
Step 0: Before You Touch the Waveforms
Check two things immediately:
- Calibration box present (1 mV = 10 mm)? ✓
- All 12 leads labeled and present? ✓
Then scan the whole strip in 3 seconds - don't fixate on one area. You're asking: "Is anything obviously dangerous?" Your brain will often spot STEMI before your logical analysis catches up.
Step 1: Rate
Look at the anterior STEMI ECG:
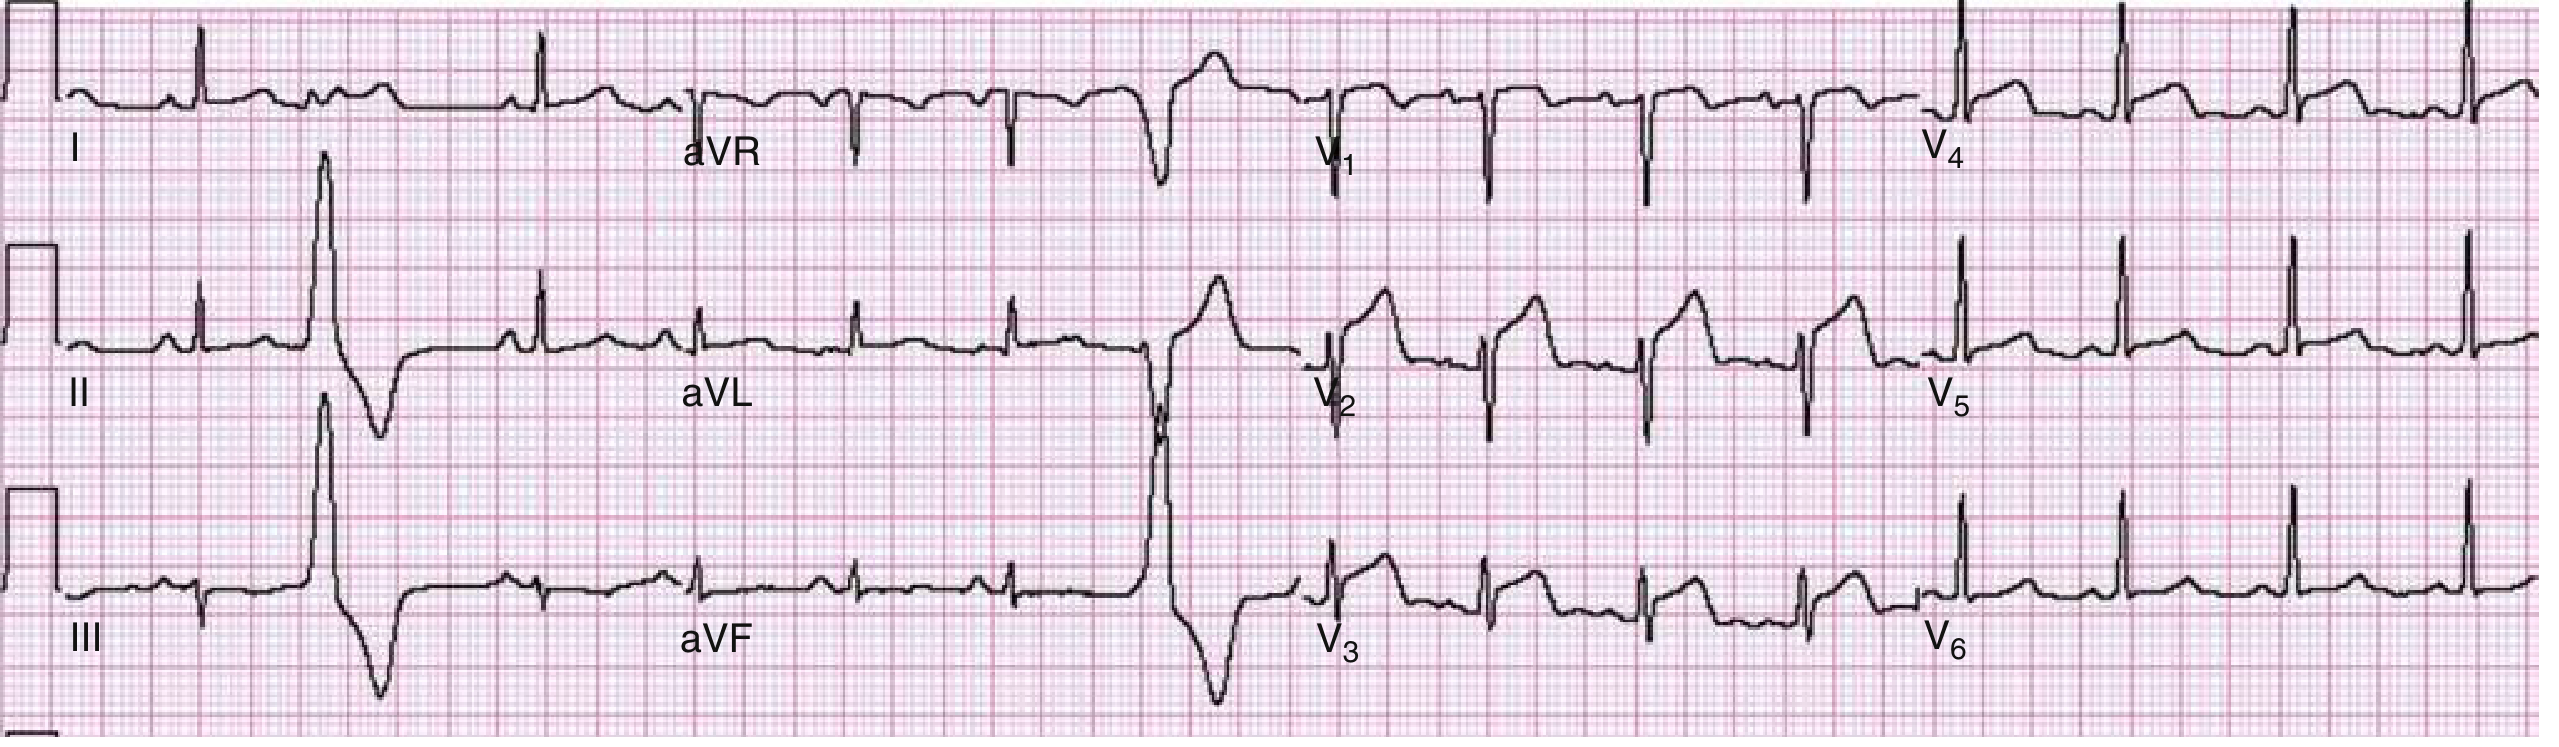
Fig. 64.6, Rosen's Emergency Medicine - Anterior wall STEMI
Count large boxes between two R waves in the rhythm strip (lead II, bottom row).
~4 large boxes between R waves → Rate ≈ 75 bpm
Normal rate. In STEMI, you can see sinus tachycardia (pain/anxiety/sympathetic surge), but also bradycardia in inferior STEMI (RCA supplies AV node).
Step 2: Rhythm
- P wave visible before every QRS? Yes
- Every P followed by QRS? Yes
- All P waves same shape? Yes
- Regular R-R intervals? Yes
→ Normal sinus rhythm
In STEMI, watch for: PVCs (irritable ischemic myocardium), VT/VF (catastrophic), heart block (especially inferior STEMI with RCA involvement).
Step 3: Axis
Look at leads I and aVF:
- Lead I: QRS is positive (R wave dominates)
- Lead aVF: QRS is positive
→ Normal axis (+60° range)
Left axis deviation in an inferior STEMI patient = think left anterior fascicular block or extensive infarct.
Step 4: P Waves
Smooth, upright in lead II, <120 ms. Normal.
No P wave changes in this case. If you saw PR segment depression (the PR dips below baseline), think pericarditis or atrial infarction.
Step 5: PR Interval
Measure from start of P to start of QRS in lead II.
PR ≈ 160 ms → Normal (120-200 ms)
In inferior STEMI: PR prolongation or even Wenckebach (Mobitz I) develops because the RCA supplies the AV node. Always check the PR in inferior MI.
Step 6: QRS Complex
6a. Duration: Narrow, ~80 ms. No bundle branch block.
Wide QRS in STEMI context = either pre-existing BBB, or rate-related aberrancy. A new LBBB with chest pain is a STEMI-equivalent (Sgarbossa criteria apply).
6b. Q waves: Look carefully at V1-V4...
Early in STEMI there may be no Q waves yet - infarction has just begun. Q waves form over hours as myocytes die. Their absence does not rule out STEMI.
6c. R-wave progression: This is where the clue reveals itself. In leads V1-V4, the R waves are smaller than expected and may be absent, replaced by QS complexes. This is the electrical scar forming.
Step 7: ST Segment - THE KEY FINDING
This is where STEMI declares itself. Apply the 4-question ST analysis:
Q1: Is there ST elevation?
Look methodically through all 12 leads:
- V1: ST elevated above baseline? YES - ~1-2 mm
- V2: Elevated? YES - ~2-3 mm
- V3: Elevated? YES - ~3+ mm
- V4: Elevated? YES - ~2 mm
- V5, V6, I, II, III, aVF: Elevated? Less so in this case
- aVL, I: May show ST depression (reciprocal)
→ ST elevation in V1-V4 (≥2 contiguous leads)
Q2: Does it meet diagnostic criteria?
Per the Fourth Universal Definition of MI (as cited in Rosen's):
| Lead group | Threshold for STEMI |
|---|---|
| Most leads | ≥1 mm in ≥2 contiguous leads |
| V2-V3, males ≥40 yr | ≥2 mm |
| V2-V3, males <40 yr | ≥2.5 mm |
| V2-V3, any female | ≥1.5 mm |
This ECG meets criteria.
Q3: What is the ST morphology?
Rosen's describes the spectrum:
| Morphology | Appearance | Significance |
|---|---|---|
| Concave ("smiley face") | Bowl-shaped upward | Less specific; also pericarditis, early repolarization |
| Flat/oblique | Horizontal rise from J point | Common in STEMI |
| Convex ("frowning") | Dome-shaped | More specific for STEMI |
| "Tombstone" | Massive upright arc, obliterates QRS | Large MI, very bad |
Tip: STEMI ST changes are dynamic - repeat the ECG in 15-30 min if you're unsure. Benign early repolarization doesn't evolve; STEMI does.
Q4: Are there reciprocal changes?
This is the confirmation step. True STEMI almost always has reciprocal ST depression in the mirror-image leads:
| STEMI territory | Elevation in | Reciprocal depression in |
|---|---|---|
| Anterior (LAD) | V1-V4 | II, III, aVF (inferior leads) |
| Inferior (RCA) | II, III, aVF | I, aVL |
| Lateral (LCx) | I, aVL, V5-V6 | II, III, aVF |
| Posterior | V7-V9 (posterior leads) | V1-V3 (tall R + ST depression) |
In this ECG: ST elevation in V1-V4 + reciprocal ST depression visible in the inferior leads (II, III, aVF). This reciprocal pattern increases specificity and positive predictive value for true STEMI.
Rosen's notes: "Reciprocal changes in the setting of STEMI increase the specificity and positive predictive value of the ECG in AMI and coincide with larger infarction, greater chance of cardiovascular adverse events."
Step 8: T Waves - Catch the Early Stage
Before full ST elevation develops, the very first ECG sign is the hyperacute T wave. Here is what it looks like - and how it rapidly evolves to classic STEMI:
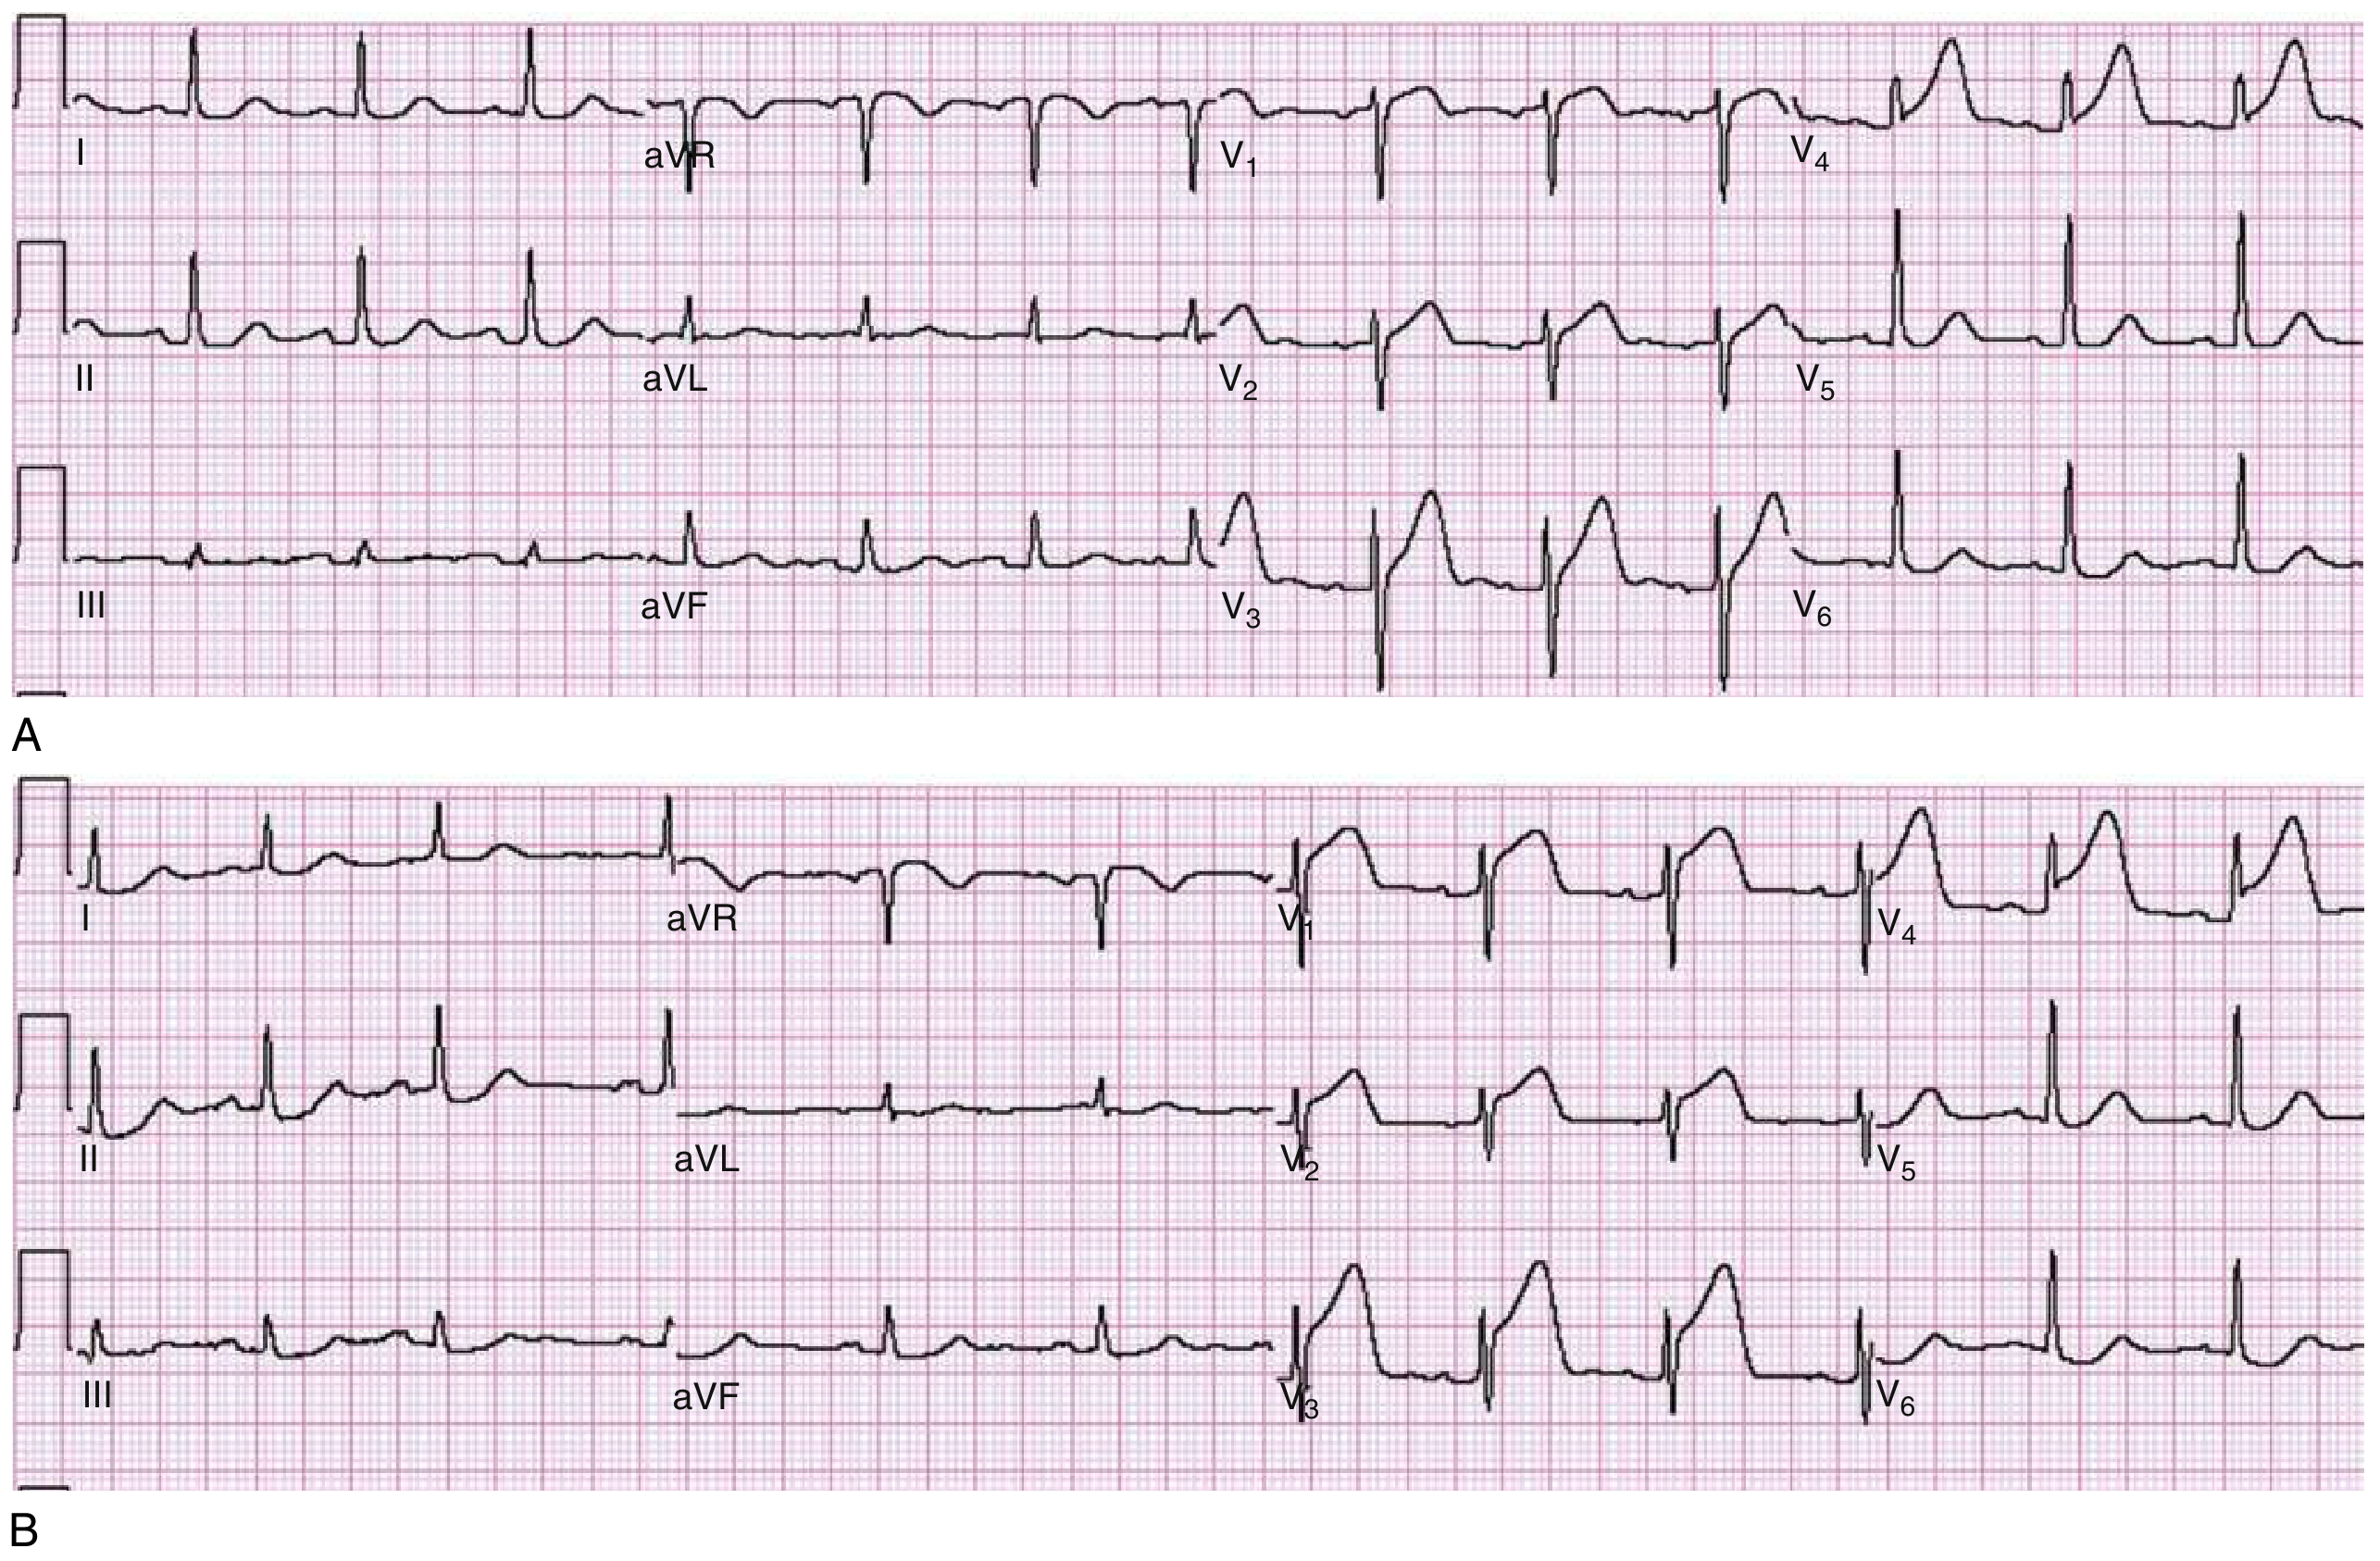
Fig. 64.1, Rosen's Emergency Medicine - ECG A (top): Hyperacute T waves in V3-V4, subtle. ECG B (bottom): Same patient 30 minutes later - frank anterior STEMI.
Hyperacute T wave characteristics:
- Tall, broad-based, asymmetric
- Appears within minutes of occlusion
- ST segment starts to rise at the J point
- Transient - rapidly evolves to ST elevation
- Differential: hyperkalemia (but those T waves are narrow and "tented"), benign early repolarization, LVH
Clinical pearl: If a patient has typical chest pain and hyperacute T waves but no frank ST elevation yet - treat as STEMI-equivalent. Do not wait for ST elevation to appear.
Step 9: QTc
Measured from start of QRS to end of T wave.
In acute STEMI, QT is often at the upper limit of normal or prolonged due to ischemic repolarization changes. No action required at this point, but note it as a baseline.
Final Diagnosis and Localization
ECG Interpretation:
"Sinus rhythm at 75 bpm. Normal axis. Narrow QRS. ST elevation of 2-3 mm in leads V1-V4 with convex morphology, meeting diagnostic criteria. Reciprocal ST depression in II, III, aVF. No established Q waves yet. Findings consistent with acute anterior STEMI."
Culprit artery: Left Anterior Descending (LAD)
The STEMI Localization Map - All Territories
| Territory | ST Elevation | Reciprocal Depression | Culprit Artery |
|---|---|---|---|
| Anterior | V1-V4 | II, III, aVF | LAD (proximal) |
| Anterolateral | V1-V6, I, aVL | II, III, aVF | Proximal LAD |
| Lateral / High lateral | I, aVL (V5-V6) | II, III, aVF, V1 | LCx or Diagonal |
| Inferior | II, III, aVF | I, aVL | RCA (80%) or LCx (20%) |
| Posterior | Tall R + ST depression V1-V3 | (posterior leads V7-V9 elevate) | RCA or LCx |
| RV infarction | V1, V4R | - | Proximal RCA |
| Left main / multivessel | aVR + widespread ST depression | All leads | LM or proximal LAD |
Inferior STEMI clue: If ST elevation is greater in lead III than lead II, it's almost certainly the RCA. If III ≈ II with no aVL depression, think left circumflex.
RV involvement clue: In inferior STEMI, if V1 is also elevated, get right-sided leads (V4R). RV infarction changes management - these patients cannot tolerate nitrates (preload-dependent) and need IV fluids instead.
The Temporal Evolution of STEMI
The ECG changes in STEMI are not static - they evolve in a predictable sequence:
| Timeframe | ECG Change | Clinical Correlate |
|---|---|---|
| Minutes | Hyperacute T waves | Acute occlusion, viable myocardium |
| Minutes-Hours | ST elevation | Active transmural ischemia |
| Hours-Days | Q wave formation | Myocyte death (electrical scar) |
| Hours-Days | T wave inversion | Repolarization abnormality |
| Days-Weeks | ST returns to baseline | Healing phase |
| Permanent | Persistent Q waves | Completed infarct scar |
Important: Successful reperfusion (PCI or thrombolysis) accelerates this sequence and can abort Q wave formation if done early enough.
STEMI Mimics - What Could Fool You
Always consider these before calling STEMI:
| Mimic | Distinguishing Feature |
|---|---|
| Early repolarization | Concave ST ("smiley"), stable across serial ECGs, young male, V4-V6 |
| Pericarditis | Diffuse (all leads except aVR/V1), saddle-shaped, PR depression, no reciprocal changes |
| LBBB | Wide QRS - use Sgarbossa criteria to look for STEMI underneath |
| LVH strain | Downsloping ST depression + T inversion V5-V6, large QRS voltages |
| Brugada | Coved ST elevation only in V1-V2, no chest pain, RBBB morphology |
| Takotsubo | Anterior-pattern changes, but no culprit lesion at cath, usually postmenopausal female after stress |
| Hyperkalemia | Peaked narrow T waves + wide QRS + sinusoidal pattern |
Clinical Action Summary
When you identify STEMI on ECG:
- Activate the cath lab immediately (door-to-balloon time target: <90 min)
- Aspirin 300 mg loading dose
- P2Y12 inhibitor (ticagrelor or clopidogrel)
- Anticoagulation (heparin or fondaparinux)
- Nitrates - but NOT in RV infarction, NOT if systolic BP <90 mmHg
- Serial ECGs every 15-30 min if initial ECG is non-diagnostic
- Check right-sided leads if inferior STEMI
Sources: Rosen's Emergency Medicine, 9th Ed. - Chapter 64 | Goldman-Cecil Medicine, 26th Ed.
Ready to go deeper? I can walk you through inferior STEMI vs. pericarditis differentiation, Sgarbossa criteria for STEMI in LBBB, or posterior MI recognition in detail.
I am starting as a cardiology resident what basicthings i need to know
Asking for Preferences
What would you like to prioritize first?
Finding Sources
Finding Sources
Finding Sources
Searching the Web
cardiology residency first year basics must know 2024
Finding Sources
Finding Sources
Reading Web Page
https://www.acc.org/membership/sections-and-councils/fellows…
Finding Sources
Finding Sources
Finding Sources
Finding Sources
I have enough material from authoritative sources to build a comprehensive orientation. Here it is:
Cardiology Residency: Your Complete First-Year Orientation
Welcome. This is everything you need to orient yourself before your first day - organized by domain, from the most immediate to the most specialized.
Part 1: The Mindset First
The ACC advises incoming fellows: "A good cardiologist starts out as a good internist." Your internal medicine foundation is your greatest asset. The difference now is you go deeper on heart disease and develop procedural skills. Nobody expects you to arrive knowing everything. Cardiology fellowship/residency exists to teach you.
The single best quality you can bring: energy and curiosity to learn.
Part 2: Core Knowledge Domains
Domain 1 - Coronary Artery Disease (CAD) & ACS
This is the bread and butter. You will see this every single day.
Know the ACS spectrum cold:
| Syndrome | Definition | ECG | Troponin | Action |
|---|---|---|---|---|
| Unstable angina | Ischemic symptoms at rest | Normal or ST depression | Negative | Admit, risk-stratify |
| NSTEMI | Subendocardial ischemia | ST depression / T inversion | Positive | Admit, early invasive vs. conservative |
| STEMI | Full-thickness occlusion | ST elevation ≥criteria | Positive | Cath lab NOW |
Key numbers to memorize:
- Door-to-balloon time target: <90 minutes (primary PCI)
- Door-to-needle time (thrombolysis): <30 minutes
- STEMI criteria: ≥1 mm STE in ≥2 contiguous leads; ≥2 mm in V2-V3 males ≥40 yr; ≥2.5 mm males <40 yr; ≥1.5 mm females
- High-sensitivity troponin: initial + 1-3 hour repeat algorithm; 0/1h or 0/3h depending on protocol
Must-know drugs in ACS:
- Dual antiplatelet: Aspirin 300 mg load + Ticagrelor 180 mg (or Clopidogrel 300-600 mg)
- Anticoagulant: UFH (70-100 U/kg bolus), Fondaparinux (NSTEMI), Bivalirudin (PCI)
- Beta-blocker: Start within 24h if hemodynamically stable
- High-intensity statin: Atorvastatin 80 mg or Rosuvastatin 40 mg - same day
- ACE inhibitor/ARB: Start before discharge, especially if EF reduced
- Nitrates: Relief of ischemia - never in RV infarction, never if SBP <90
Domain 2 - Heart Failure (HF)
HF is the other major condition filling every cardiology ward. The classification has changed - know both terms:
The EF-based classification:
| Type | EF | Mechanism | Typical cause |
|---|---|---|---|
| HFrEF (reduced) | <40% | Systolic dysfunction - dilated, weak ventricle | Ischemia, DCM, myocarditis |
| HFmrEF (mildly reduced) | 40-49% | Mixed | Ischemia, treated HFrEF |
| HFpEF (preserved) | ≥50% | Diastolic dysfunction - stiff ventricle | Hypertension, obesity, DM, aging |
Note: most patients have both systolic and diastolic components. HFpEF is now the majority of heart failure cases.
Mortality-reducing drugs in HFrEF (the "Fantastic Four"):
| Drug class | Example | Key trial |
|---|---|---|
| ACEi/ARB or ARNi | Ramipril or Sacubitril/Valsartan | CONSENSUS, PARADIGM-HF |
| Beta-blocker (cardioselective) | Carvedilol, Metoprolol succinate, Bisoprolol | MERIT-HF, COPERNICUS |
| MRA | Spironolactone, Eplerenone | RALES, EPHESUS |
| SGLT2 inhibitor | Dapagliflozin, Empagliflozin | DAPA-HF, EMPEROR-Reduced |
These four classes reduce mortality regardless of symptoms. Get a patient on all four whenever possible, then uptitrate. This is called GDMT (Guideline-Directed Medical Therapy) - you will hear this phrase constantly.
Decompensated HF (acute management):
- Positioning: sit upright
- Diuresis: IV furosemide (at least 1-2× the oral dose IV)
- Monitor urine output, creatinine, potassium daily
- If cardiogenic shock: vasopressors, inotropes, mechanical support (IABP, Impella)
- BNP/NT-proBNP guides diagnosis and monitoring
Domain 3 - Arrhythmias
Atrial Fibrillation - the most common sustained arrhythmia:
Two core decisions when you see AF:
- Rate vs. rhythm control?
- Anticoagulate?
Rate control targets:
- Resting HR <80 bpm (strict) or <110 bpm (lenient - acceptable in most stable patients)
- Drugs: Beta-blockers (first line), non-DHP calcium channel blockers (diltiazem, verapamil), digoxin (add-on for HF)
Rhythm control:
- Cardioversion (electrical or chemical) if <48 hours onset OR properly anticoagulated for ≥3 weeks
- Chemical cardioversion: Flecainide ("pill-in-pocket"), Amiodarone, Ibutilide
- Long-term: Amiodarone, Flecainide, Propafenone, Sotalol, Dronedarone
- Catheter ablation: increasingly first-line for paroxysmal AF, especially younger patients
Anticoagulation - CHA₂DS₂-VASc score:
| Factor | Points |
|---|---|
| Congestive HF | 1 |
| Hypertension | 1 |
| Age ≥75 | 2 |
| Diabetes | 1 |
| Stroke/TIA | 2 |
| Vascular disease | 1 |
| Age 65-74 | 1 |
| Sex (female) | 1 |
- Men score ≥1, women score ≥2: anticoagulate
- DOACs (apixaban, rivaroxaban, dabigatran, edoxaban) preferred over warfarin except in valvular AF (mechanical valves, mitral stenosis) - use warfarin there
Ventricular arrhythmias:
- VT: wide complex tachycardia, ≥3 consecutive beats at >120 bpm. Sustained (>30s) is dangerous.
- VF: chaotic, no organized beats - immediate defibrillation
- Monomorphic VT in hemodynamically stable patient: Amiodarone IV or synchronized cardioversion
- Polymorphic VT (torsades): Mg²⁺ sulfate 2g IV, correct QTc, stop offending drugs
- Hemodynamic compromise = immediate unsynchronized defibrillation (200J biphasic)
AV blocks:
| Block | PR interval | Dropped beats | Action |
|---|---|---|---|
| 1st degree | Prolonged (>200ms), constant | None | Observe |
| Mobitz I (Wenckebach) | Progressive lengthening | Periodic | Usually observe; AV node level |
| Mobitz II | Constant, then sudden drop | Intermittent | Pacemaker needed - infranodal |
| Complete (3rd degree) | P and QRS unrelated | All P waves blocked | Pacemaker urgently |
Domain 4 - Valvular Heart Disease
The four valves, four problems:
The main lesions you will manage:
| Valve | Stenosis | Regurgitation |
|---|---|---|
| Aortic | AS - obstruction to LV outflow | AR - volume overload on LV |
| Mitral | MS - obstruction to LV filling | MR - volume overload on LV and LA |
| Tricuspid | Less common, often in RHD | TR - volume overload on RV |
| Pulmonary | Rare, usually congenital | Rare |
Aortic Stenosis (AS) - the most important valve disease:
- Severe AS: valve area <1.0 cm², mean gradient >40 mmHg, peak velocity >4 m/s
- The symptomatic triad: Angina (5yr survival), Syncope (3yr), Heart failure (1-2yr) - survival worsens in that order
- Treatment: TAVR or SAVR - no medical therapy alters progression
- Know: Low-flow, low-gradient AS (EF <50%, MPG <40) - dobutamine stress echo to distinguish true severe AS
Mitral Stenosis:
- Usually rheumatic in origin
- Severe: MVA <1.5 cm², pressure half-time >150 ms
- Complication: AF (very common), pulmonary HTN, embolic stroke
- Treatment: PTMC (percutaneous mitral commissurotomy) if suitable anatomy; surgical if not
Auscultation - what you must hear:
| Murmur | Location | Radiation | Character |
|---|---|---|---|
| AS | RUSB (2nd right ICS) | Carotids | Systolic ejection, crescendo-decrescendo |
| MR | Apex | Axilla | Holosystolic, blowing |
| MS | Apex | None | Mid-diastolic rumble, opening snap |
| AR | LUSB/LLSB | None | Early diastolic, blowing, decrescendo |
| TR | LLSB | None | Holosystolic, increases with inspiration (Carvallo's sign) |
| VSD | LLSB | None | Holosystolic, harsh |
Dynamic auscultation - Valsalva and positional changes help distinguish murmurs:
- Valsalva (reduces venous return): most murmurs decrease except HOCM and MVP (increase)
- Standing: similar effect to Valsalva
- Squatting / leg raise: increases venous return, increases most murmurs, decreases HOCM/MVP
Domain 5 - Echocardiography
You will be reading echoes from day one. Start here:
The four standard views:
- Parasternal long axis (PLAX) - LV dimensions, aortic/mitral valves, pericardium
- Parasternal short axis (PSAX) - LV wall motion, papillary muscles, aortic valve (fish-mouth)
- Apical 4-chamber (A4C) - all four chambers, mitral/tricuspid valves, EF
- Subcostal - RV, pericardial effusion, IVC (volume status)
What every echo report tells you - key numbers:
| Parameter | Normal | Abnormal |
|---|---|---|
| LV ejection fraction (LVEF) | 55-70% | Reduced <50%; severely reduced <30% |
| LV end-diastolic diameter | <5.5 cm | Dilated if >5.5 cm |
| IVSd (septal thickness) | <1.2 cm | Hypertrophied if ≥1.2 cm |
| LA volume index | <34 mL/m² | Elevated suggests diastolic dysfunction |
| RVSP (estimated) | <35 mmHg | Pulmonary HTN if >40 mmHg |
| Aortic root | <3.7 cm | Dilated if >4.0 cm; surgery at ≥5.5 cm |
| E/A ratio (mitral inflow) | 1-2 | E/A <1 = impaired relaxation; >2 = restrictive |
Diastolic dysfunction grading:
- Grade I: Impaired relaxation (E/A <1, E/e' <8)
- Grade II: Pseudonormal (E/A 1-2, E/e' 9-14)
- Grade III: Restrictive (E/A >2, E/e' >14) - elevated filling pressures
Pericardial effusion on echo:
- Look at the pericardial space in PLAX and subcostal
- Small: <10 mm; moderate: 10-20 mm; large: >20 mm
- Tamponade signs: RV collapse in early diastole, RA collapse, IVC plethora (dilated, non-collapsing), respiratory variation in mitral/tricuspid inflow >25%
Domain 6 - Cardiac Catheterization
As a cardiology resident, you will be in the cath lab regularly. Understand what you're doing and why.
What a diagnostic cath tells you:
- Coronary anatomy: stenosis location, severity, lesion characteristics
- Hemodynamics: pressures in chambers and great vessels (right heart cath)
- Ventriculography: LV function, mitral regurgitation severity
The coronary arteries - anatomy you must know:
- Left main (LM): short, bifurcates into LAD and LCx. LM disease = highest risk
- LAD: anterior wall, septum, apex. Wraps around apex = "dominant LAD"
- LCx: lateral wall, posterior wall (if left-dominant)
- RCA: inferior wall, RV, AV node (80% of patients). Gives PDA in right-dominant system
Right vs. left dominance:
- Right dominant (80-85%): RCA gives posterior descending artery (PDA)
- Left dominant (10-15%): LCx gives PDA
- Codominant (~5%)
Stenosis grading (visual estimate):
- <50%: non-obstructive
- 50-70%: intermediate - use FFR (fractional flow reserve) to assess significance
- ≥70%: significant, consider PCI
- ≥90%: near-total
- 100%: chronic total occlusion (CTO)
Right heart catheterization (Swan-Ganz) - normal pressures:
| Location | Normal pressure |
|---|---|
| RA | 0-8 mmHg |
| RV | 15-30 / 0-8 mmHg |
| PA | 15-30 / 8-12 mmHg |
| PCWP (wedge) | 6-12 mmHg |
| CO (Fick or thermodilution) | 4-8 L/min |
- PCWP >18 mmHg = elevated filling pressures (cardiogenic pulmonary edema)
- Low CO + high PCWP = cardiogenic shock
- Low CO + normal PCWP = distributive/obstructive shock
Domain 7 - Hypertension, Lipids & Prevention
BP targets (2023 ACC/AHA):
- General population with CVD or high risk: <130/80 mmHg
- Very elderly (≥80 yr), frail: individualize to ~<150/80
Antihypertensive drug classes - when to choose what:
| Situation | First-line agent |
|---|---|
| HFrEF | ACEi/ARB + beta-blocker |
| Post-MI | Beta-blocker + ACEi |
| CKD with proteinuria | ACEi or ARB |
| Diabetes | ACEi/ARB (or SGLT2i for CV protection) |
| Isolated systolic HTN, elderly | Thiazide or CCB |
| Pregnancy | Labetalol, methyldopa, nifedipine |
| Hypertensive emergency | IV labetalol, nicardipine, sodium nitroprusside |
Lipids - LDL targets:
| Risk group | LDL target |
|---|---|
| Very high (ASCVD, DM + RF) | <55 mg/dL (1.4 mmol/L) - ESC; <70 mg/dL - ACC |
| High risk | <70 mg/dL |
| Moderate risk | <100 mg/dL |
- High-intensity statin first (atorvastatin 40-80 mg, rosuvastatin 20-40 mg)
- Add ezetimibe if LDL not at goal on max statin
- Add PCSK9 inhibitor (evolocumab, alirocumab) for very high-risk patients not at goal
Domain 8 - Devices
Pacemakers - the basics:
The NBG pacing code (first 3 letters matter most):
- 1st letter: chamber paced (A=atrium, V=ventricle, D=dual)
- 2nd letter: chamber sensed (A, V, D, O=none)
- 3rd letter: response to sensing (I=inhibited, T=triggered, D=dual, O=none)
Common modes:
- VVI: single lead, paces ventricle, inhibited by native ventricular activity - basic backup, AF
- DDD: dual chamber, paces and senses both - normal sinus node function preserved
- AAI: paces atrium only - SND with intact AV conduction
ICD (implantable cardioverter-defibrillator) - when does a patient need one?
Primary prevention ICD criteria (simplified):
- HFrEF with EF ≤35% + NYHA Class II-III despite ≥3 months of GDMT
- EF ≤30% with mild symptoms (NYHA I) - also qualifies per most guidelines
Secondary prevention:
- Survived VF or hemodynamically unstable VT (not reversible cause)
- Sustained VT with structural heart disease
CRT (Cardiac Resynchronization Therapy):
- Biventricular pacing to correct dyssynchrony in LBBB
- Criteria: EF ≤35% + QRS ≥150 ms + LBBB morphology + NYHA II-IV on GDMT
- Improves symptoms, reverse remodels, reduces mortality
Domain 9 - Pulmonary Hypertension
A common consult and a field of its own. Know the Dana Point/WHO classification:
| Group | Cause |
|---|---|
| 1 | Pulmonary arterial hypertension (PAH) - idiopathic, heritable, connective tissue disease |
| 2 | Left heart disease (most common cause overall) |
| 3 | Lung disease / hypoxia |
| 4 | Chronic thromboembolic disease (CTEPH - potentially curable!) |
| 5 | Unclear or multifactorial |
- Diagnosis: mean PA pressure >20 mmHg at rest on right heart cath (updated 2022 ESC/ERS)
- Group 2 (left heart disease) is treated by fixing the left heart - do not use PAH drugs in Group 2 PH
- CTEPH (Group 4): consider pulmonary endarterectomy (PEA surgery) - can be curative
Domain 10 - Cardiogenic Shock
A patient you will be called about at 2 AM:
Definition: Sustained hypotension (SBP <90 for >30 min OR requiring vasopressors) + evidence of hypoperfusion (cold extremities, oliguria, altered mentation, lactate ≥2 mmol/L)
SCAI shock classification (A-E):
- A: At risk
- B: Beginning shock
- C: Classic shock
- D: Deteriorating
- E: Extremis
Management:
- Identify and treat the cause (most often acute MI → urgent revascularization)
- Vasopressors: norepinephrine first-line (not dopamine - more arrhythmogenic)
- Inotrope if low CO: dobutamine (or milrinone in beta-blocker toxicity)
- Mechanical support: IABP (simple, commonplace), Impella (higher support, increasingly first-line in CS with PCI), ECMO (for refractory shock)
- Avoid diuretics aggressively - these patients are often not volume overloaded
Part 3: Clinical Skills to Build Immediately
ECG Reading
Read 10 ECGs every day. Use them as a ritual, not a chore. Focus on:
- Week 1-2: Rate, rhythm, axis mastery
- Week 3-4: Bundle branch blocks, hypertrophy
- Month 2: Ischemia patterns, STEMI territories
- Month 3+: Complex arrhythmias, pacemaker rhythms
Free resource: ECG Wave-Maven (BIDMC) - hundreds of real strips with expert interpretation.
Echo Interpretation
- Learn the 4 standard views in your first 2 weeks
- Ask the echo technologist to walk you through each scan
- Start by estimating EF visually ("eyeballing") - with practice, visual EF correlates well with measured EF
- Read the [Textbook of Clinical Echocardiography (Otto)] alongside clinical cases
Hemodynamic Assessment (Bedside)
Before ordering any test, assess these clinically:
- Volume status: JVP, peripheral edema, pulmonary crackles, IVC on bedside echo
- Perfusion: capillary refill, skin temperature, urine output, lactate
- The Forrester classification (warm/cold × wet/dry) guides HF management at the bedside:
- Warm + Wet: diurese
- Cold + Wet: inotrope + diurese
- Cold + Dry: fluid challenge
- Warm + Dry: optimize outpatient regimen
Part 4: Procedures You Will Learn
| Procedure | What to know first |
|---|---|
| Coronary angiography | Femoral vs. radial access; contrast volume monitoring; AKI prevention |
| PCI | Guidewires, balloons, stents; DES vs. BMS; DAPT duration |
| Transesophageal echo (TEE) | Probe manipulation, key views, endocarditis / AF/LAAO workup |
| Pericardiocentesis | Echo-guided, subxiphoid approach, drain placement |
| Temporary pacing | Transvenous pacing via femoral or subclavian; threshold testing |
| Right heart cath | Wedge tracing interpretation, thermodilution CO, Fick calculation |
| Cardioversion | Synchronized vs. unsynchronized; energy selection; procedural sedation |
Part 5: Key Guidelines to Download and Keep
These are the documents that govern what you prescribe:
| Organization | Key guideline |
|---|---|
| ACC/AHA | Heart Failure (2022), ACS/STEMI, AF (2023 focused update) |
| ESC | AF (2020), Heart Failure (2021), Valvular HD (2021) |
| ACC/AHA | Hypertension (2017), Cholesterol (2018) |
| AHA | Resuscitation (ACLS 2020) - keep this current |
Free access: ACC Clinical Guidelines | ESC Guidelines
Part 6: The "Night Call Survival" List
Things to know reflexively for night calls:
| Situation | Immediate action |
|---|---|
| STEMI on ECG | Activate cath lab; aspirin + P2Y12 + heparin |
| VF / pulseless VT | CPR + defibrillate 200J immediately |
| Hemodynamically unstable VT | Synchronized cardioversion 100J; consider amiodarone |
| Bradycardia with hypotension | Atropine 0.5 mg IV; transcutaneous pacing if no response |
| Flash pulmonary edema | Sit upright; IV furosemide 80-120 mg; IV nitrates; NIV (BiPAP) |
| Cardiac tamponade | Fluid resuscitation; avoid vasodilators; urgent pericardiocentesis |
| Hypertensive emergency (MAP >180 or end-organ damage) | IV labetalol or nicardipine; reduce MAP by 25% in first hour |
| AF with rapid ventricular response (unstable) | Synchronized cardioversion |
| AF with RVR (stable) | IV metoprolol or diltiazem for rate control |
| Torsades de pointes | Mg²⁺ 2g IV; overdrive pacing; correct QTc; remove offending drugs |
Part 7: Resources to Build Your Learning System
For ECG: Goldberger's Clinical Electrocardiography (10th ed) - the gold standard primer
For echo: Otto's Textbook of Clinical Echocardiography
For general cardiology: Braunwald's Heart Disease (12th ed) - your bible; use for reference, not cover-to-cover
For quick review: Cardiology Secrets (Question-based format, great for rounds prep)
Podcasts: CardioNerd, ACC CardiaCast, ESC 365 (free)
Apps: Epocrates, MDCalc (CHA₂DS₂-VASc, TIMI, GRACE scores), ECG Pocket Brain
The One-Page Summary
CAD/ACS      → ECG + troponin + cath. DAPT + statin + BB + ACEi. Time = muscle.
Heart Failure → EF? HFrEF = Fantastic Four (ACEi/ARNi + BB + MRA + SGLT2i). GDMT.
AF           → CHA₂DS₂-VASc → anticoagulate. Rate vs. rhythm. DOAC preferred.
Arrhythmias  → Stable? → Antiarrhythmic. Unstable? → Cardiovert/defibrillate.
Valves       → Symptoms = surgery window. Know severe thresholds. Echo is your tool.
Echo         → LVEF, LV dimensions, diastolic grading, valves, pericardium.
Cath         → Coronary anatomy, dominance, FFR, hemodynamics.
Devices      → EF ≤35% = ICD. EF ≤35% + LBBB + QRS ≥150 = CRT.
Shock        → Identify + treat cause. NE first. Consider Impella early.
Prevention   → LDL targets. BP <130/80. Statin + ACEi + aspirin in high-risk.
You don't need to know all of this on day one. You need to know that these are the areas and return to each one systematically as cases come through. The best cardiology residents learn from every patient in front of them.
Good luck - you're going to be excellent.
This is a shared conversation. Sign in to Orris to start your own chat.