
Short note on dark adaptation
dark adaptation curve rhodopsin regeneration rod cone
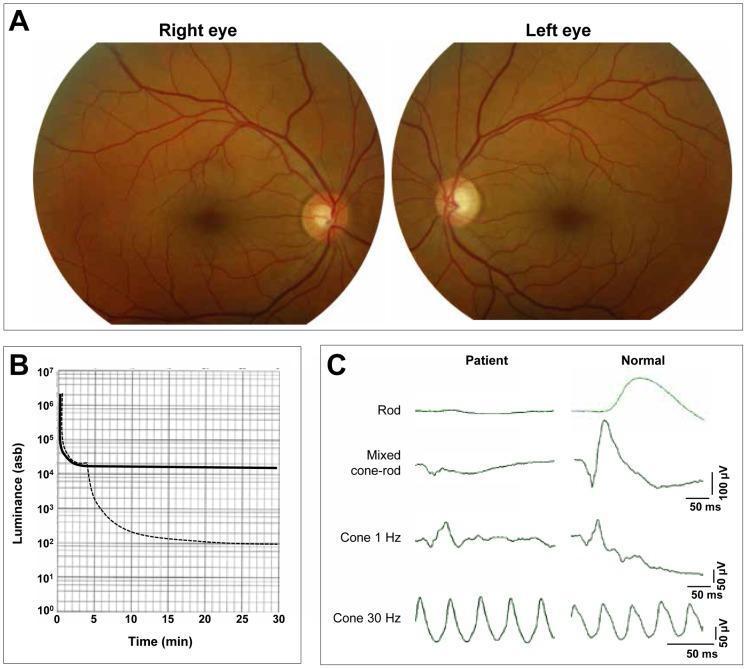
Educational panel of clinical ophthalmological investigations for congenital stationary night blindness (CSNB). Section A displays bilateral color fundus photographs showing a normal appearance of the posterior pole, macula, and optic discs with non-attenuated retinal vessels. Section B presents a dark-adaptation curve (luminance vs. time); the patient's curve (solid line) shows a normal initial cone adaptation but a total absence of the rod-adaptation phase, resulting in a threshold significantly higher than the control (hatched line). Section C shows full-field electroretinogram (ERG) recordings. Compared to the normal control, the patient demonstrates an absence of scotopic rod responses and a characteristic 'electronegative' mixed cone-rod response, where the a-wave is present but the b-wave is severely reduced or absent. Photopic cone responses (1 Hz and 30 Hz flicker) remain relatively normal. These findings are diagnostic of the Schubert-Bornschein type of CSNB, specifically illustrating the physiological deficit in signal transmission from photoreceptors to bipolar cells despite a clinically normal-appearing fundus.
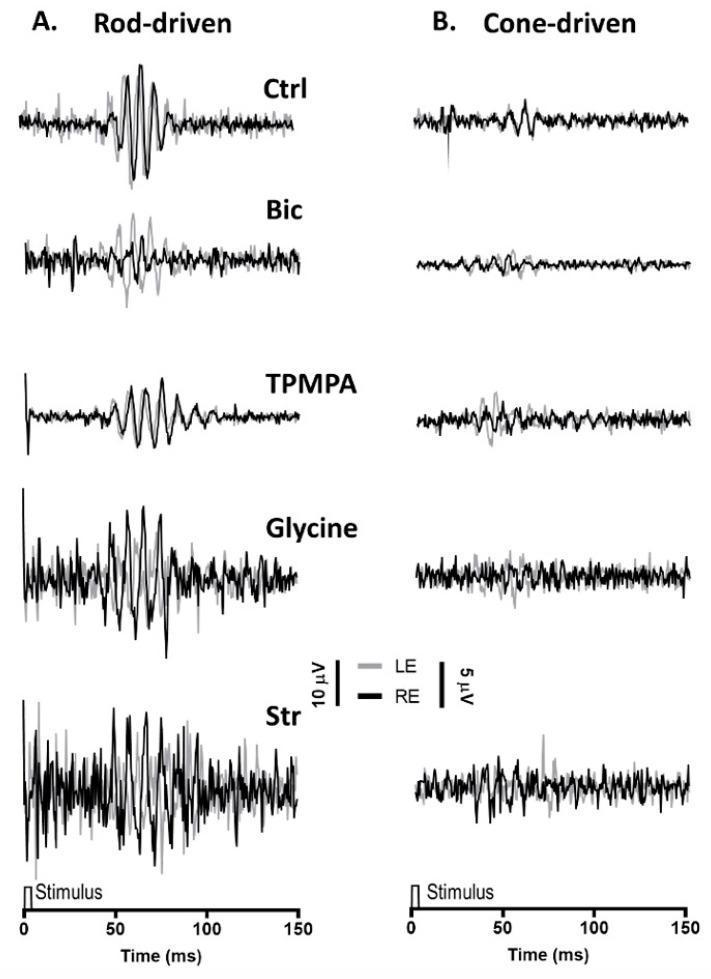
This diagnostic comparison chart displays representative electroretinogram (ERG) recordings of oscillatory potentials (OPs) under two physiological conditions: (A) Rod-driven OPs under dark adaptation (scotopic) and (B) Cone-driven OPs under light adaptation (photopic). The figure illustrates the effects of different pharmacological agents injected into the right eye (RE, black trace) compared to a control phosphate-buffered saline injection in the left eye (LE, grey trace). Conditions include Control (Ctrl), Bicuculline (GABAA antagonist), TPMPA (GABAC antagonist), Glycine, and Strychnine (glycine antagonist). In the rod-driven series (A), control traces show high-amplitude, regular rhythmic oscillations. Bicuculline reduces amplitude while preserving periodicity, TPMPA shows negligible effect, and both Glycine and Strychnine significantly disrupt the regularity and amplitude of the waveform. The cone-driven series (B) demonstrates much lower baseline amplitude and less distinct oscillatory components, with pharmacological intervention resulting in waveforms that are nearly indistinguishable from noise. Scales indicate 10 µV for rod-driven and 5 µV for cone-driven traces over a 150 ms time course. This visualization demonstrates the role of inhibitory neurotransmitters in the genesis of retinal oscillatory potentials.
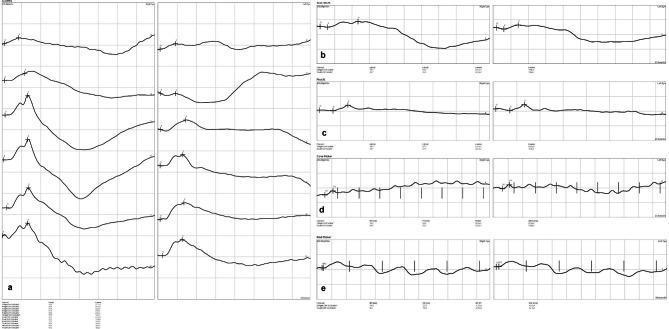
This diagnostic image displays structured electroretinography (ERG) recordings illustrating various retinal responses categorized into five sections (a-e). Section (a) shows the dark adaptation response with multiple serial waveforms demonstrating changes in retinal sensitivity over time under scotopic conditions. Section (b) displays the mixed rod-cone response, characterized by well-defined a-waves (initial negative deflection) and b-waves (positive deflection). Section (c) represents the photopic response, showing single-flash waveforms under light-adapted conditions. Sections (d) and (e) illustrate the cone flicker and rod flicker responses, respectively, featuring rhythmic oscillatory patterns in response to repetitive light stimuli. Key clinical markers are annotated throughout, including flash onset (N), a-wave (a), b-wave (b), and oscillatory potential (P) latencies. The graphs provide a bilateral comparison between left and right eye function, serving as an educational resource for assessing retinal electrophysiology, photoreceptor health, and the diagnostic differentiation of rod and cone system pathologies.
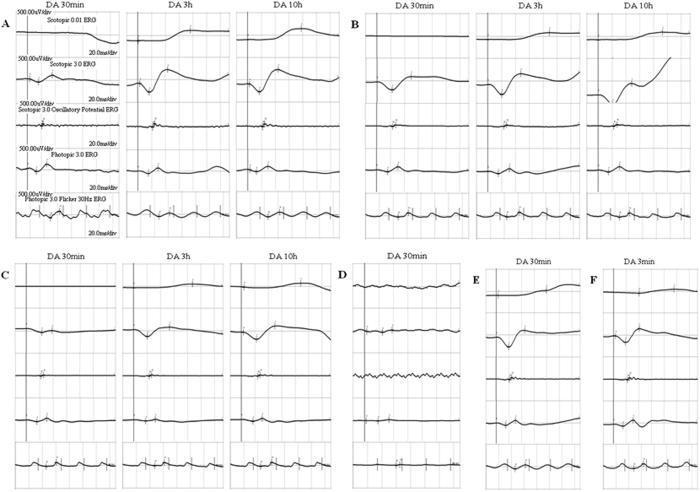
A multi-panel figure displaying diagnostic full-field electroretinography (ffERG) waveforms to evaluate retinal function. Panels A-D show results from four different patients with suspected retinal disorders, while Panels E and F provide normal controls. Each patient's panel (A, B, C) demonstrates traces at three dark adaptation (DA) intervals: 30 minutes, 3 hours, and 10 hours. The standard ISCEV protocol components shown include Scotopic 0.01 (rod response), Scotopic 3.0 (combined rod-cone response), Scotopic 3.0 Oscillatory Potentials, Photopic 3.0 (cone response), and 30Hz Flicker. The educational focus is on the delayed recovery of rod responses; at 30 minutes of DA, patients show nearly absent or severely attenuated scotopic b-waves compared to controls. After prolonged dark adaptation (3h and 10h), there is a significant progressive increase in b-wave amplitudes and normalization of waveform morphology, a characteristic finding in conditions like Fundus Albipunctatus (RDH5 mutations) or RPE65-related retinopathies.
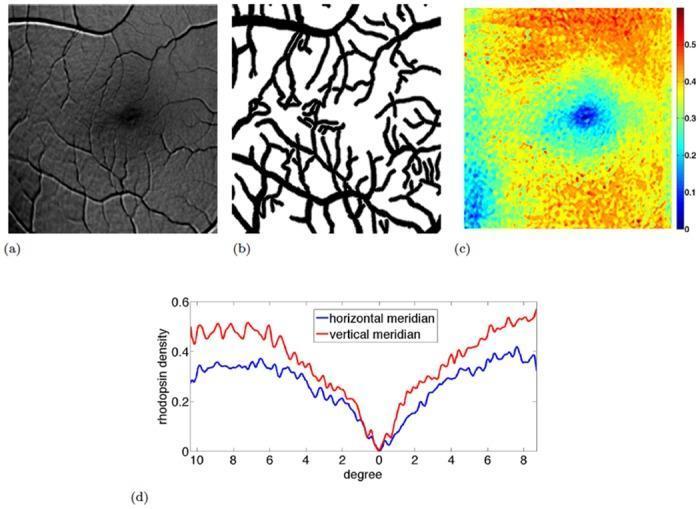
This composite image illustrates the spatial quantification and mapping of rod rhodopsin density in the human retina. Panel (a) shows an initial grayscale rhodopsin map derived from multispectral autofluorescence imaging, where retinal vasculature is visible as dark branching structures. Panel (b) displays a smooth vessel mask used for image inpainting. Panel (c) is the final heat map representing the distribution of rhodopsin optical density (absorbance at 488nm). The central fovea is shown in dark blue, indicating a physiological absence of rhodopsin. Moving eccentrically, the density increases toward the periphery, with the highest concentrations (red/orange) observed in the superior retina. Panel (d) provides a line graph of rhodopsin density profiles along the horizontal (blue) and vertical (red) meridians. Both profiles show a minimum at 0 degrees (fovea) and an increase with eccentricity. The vertical meridian demonstrates a more rapid rate of increase in rhodopsin density compared to the horizontal meridian, reflecting the anatomical distribution of rod photoreceptors.
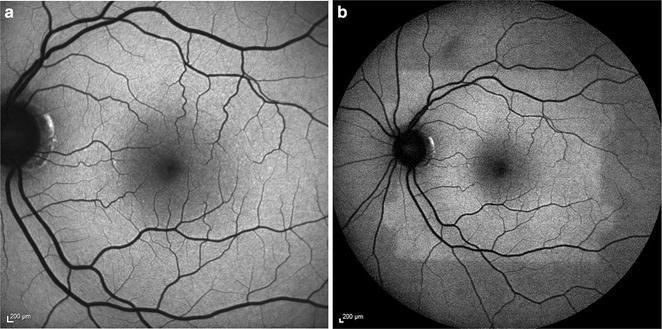
This diagnostic image set consists of two grayscale fundus autofluorescence (FAF) images of a human retina, demonstrating the 'bleaching effect' of rhodopsin. Image (a) is a standard 30-degree field of view FAF showing normal background autofluorescence, the optic disc (nasal dark circle), and retinal vasculature (dark branching lines). Image (b) is a subsequent 50-degree field of view FAF captured immediately after (a). The 50-degree image reveals a central, rectangular, discrete area of relative hyper-autofluorescence. This brighter region corresponds precisely to the 30-degree area previously exposed to the excitation beam in image (a). The phenomenon occurs because the blue light excitation in the first image bleaches the rhodopsin in the rod photoreceptors, reducing its absorptive capacity and thereby increasing the detectable autofluorescence signal from the underlying retinal pigment epithelium (RPE) in the second image. This visual demonstrates the dynamic nature of retinal fluorophores and the importance of light adaptation and sequence in ophthalmic imaging. It is a key educational concept for ophthalmology trainees and retina specialists.
Dark Adaptation
Definition
- Ganong's Review of Medical Physiology, 26th Ed.
- Guyton and Hall Textbook of Medical Physiology
The Dark Adaptation Curve
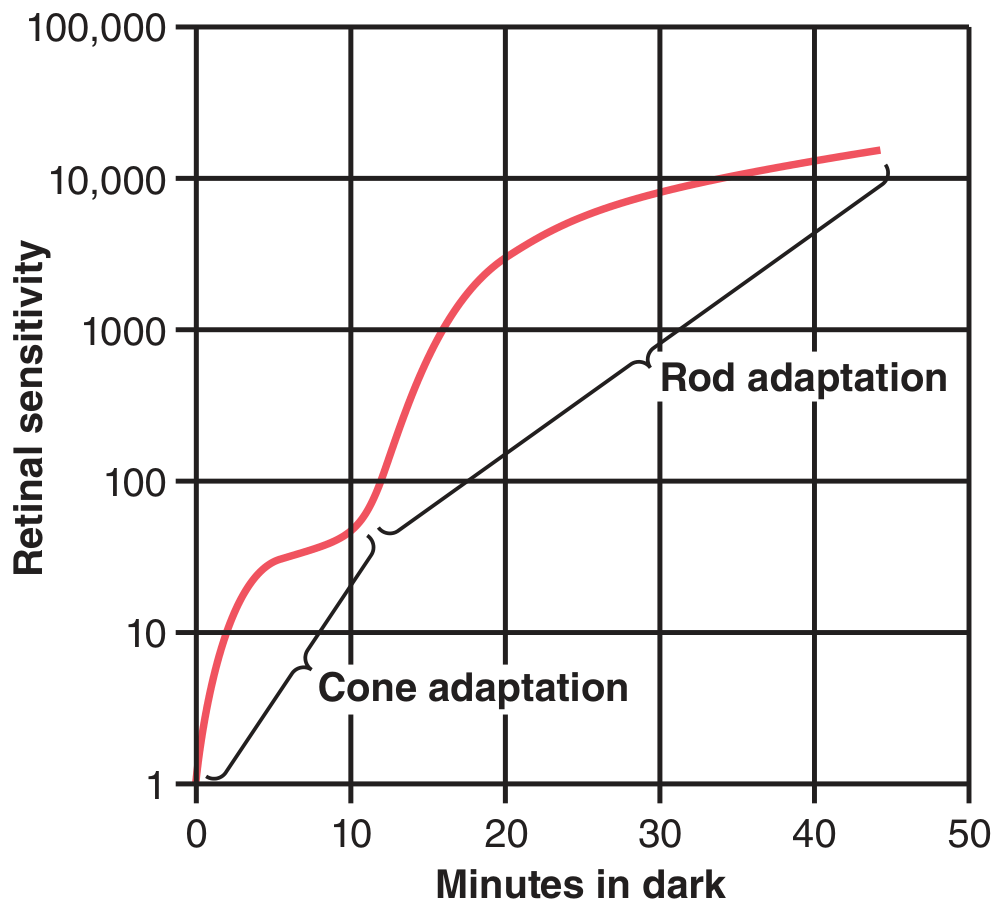
- Rapid but small in magnitude
- Cones adapt about 4x faster than rods
- Cone adaptation plateaus relatively early; cones achieve modest sensitivity gain
- Corresponds to regeneration of cone photopigments (iodopsin/photopsins)
-
Slower but far greater in magnitude
-
Rods continue adapting for many minutes to hours
-
Dominated by regeneration of rhodopsin (rod visual pigment)
-
Additionally amplified by neural convergence: ~100 rods synapse onto a single ganglion cell, summating their signals
-
Total sensitivity change: ~25,000-fold increase by 40 minutes (from 6,000-fold at 20 min)
-
Guyton and Hall Textbook of Medical Physiology
Mechanisms of Dark Adaptation
1. Photopigment Regeneration (Primary mechanism)
- Rhodopsin (rods) and cone photopigments are split into retinal + opsin
- Retinal is further converted to vitamin A (stored in RPE)
- Vitamin A is reconverted to retinal
- Retinal recombines with opsin to regenerate light-sensitive rhodopsin
- The rate-limiting step is the availability of opsin and retinal
- The Vitamin A cycle depends on the retinal pigment epithelium (RPE)
2. Pupillary Dilation
- Pupil enlarges from ~2 mm (bright light) to ~8 mm (dark)
- This accounts for only ~10-fold increase in light reaching the retina (a minor component of total adaptation)
3. Neural Convergence (Rod summation)
- In the peripheral retina, 100+ rods converge onto a single ganglion cell
- This spatial summation greatly amplifies weak signals, increasing sensitivity
4. Calcium-mediated mechanism in cones
-
In bright light, cGMP-gated channels close, reducing Ca²+ influx into cones
-
Reduced intracellular Ca²+ disinhibits guanylyl cyclase (which synthesizes cGMP)
-
More cGMP reopens cGMP-gated channels, allowing gradual cone depolarization even under sustained light
-
This ensures cones can continue to register relative changes in brightness rather than saturating
-
Neuroscience: Exploring the Brain, 5th Ed.
Photopic vs. Scotopic Vision
| Feature | Cones (Photopic) | Rods (Scotopic) |
|---|---|---|
| Vision type | Daytime/color | Nighttime/dim light |
| Adaptation speed | Fast (~4x faster) | Slow |
| Sensitivity gain | Modest | Enormous (~25,000x) |
| Distribution | Fovea-rich | Peripheral retina |
| Photopigment | Iodopsin (3 types) | Rhodopsin |
Practical Applications
-
Red goggles technique: Radiologists, pilots, and night-duty personnel can wear red goggles in bright light. Red wavelengths stimulate rods minimally while allowing cone function. When red goggles are removed in the dark, the rods are already dark-adapted - saving the 20-minute wait.
-
Night blindness (Nyctalopia): Failure of dark adaptation due to rhodopsin deficiency; causes include Vitamin A deficiency (most common globally), retinitis pigmentosa, or RPE65 mutations. These conditions manifest as inability to see in dim light.
-
Clinical testing: Dark adaptometry measures the dark adaptation curve and is used to diagnose early AMD (age-related macular degeneration), as rod adaptation is slowed before visual acuity changes occur.
Summary
Explain the calcium mediated part in easy way
The Calcium Story in Simple Terms
Background: How cones "see" light
- Let Na⁺ (sodium) in → keeps the cell depolarized (electrically "on")
- Let Ca²⁺ (calcium) in → as a bonus passenger through the same channel
- More cGMP → channels open
- Less cGMP → channels close
What happens when you step into BRIGHT light?
Bright light hits the cone
        ↓
Rhodopsin activates → activates phosphodiesterase (PDE)
        ↓
PDE breaks down cGMP → cGMP levels drop
        ↓
cGMP-gated channels CLOSE
        ↓
Cell hyperpolarizes → sends "I see light!" signal
Here's where calcium saves the day
- High Ca²⁺ → guanylyl cyclase is suppressed → cGMP stays moderate
Now, in bright light (channels close):
| Step | What happens | Why it matters |
|---|---|---|
| Channels close | Ca²⁺ entry stops | Ca²⁺ level inside the cone starts falling |
| Ca²⁺ drops | Guanylyl cyclase is no longer inhibited | It becomes active again |
| GC active | Starts making more cGMP | cGMP levels rise |
| cGMP rises | Channels start reopening | Cell slowly depolarizes back toward resting |
| Cell re-sensitized | Can now detect further changes | You can see in bright light again |
The Analogy
- Dark → Ca²⁺ high → foot pressing the brake → cGMP production is slow → channels moderately open
- Bright light → channels close → Ca²⁺ falls → foot lifts off the brake → cGMP production speeds up → channels reopen → cone recovers sensitivity
The Key Takeaway
Calcium acts as a negative feedback sensor inside the cone. When light closes channels and Ca²⁺ drops, it signals the cell to "ramp up cGMP production and reopen channels." This prevents the cone from staying saturated in bright light, allowing you to see a full range of brightness instead of just a flash of white.