
Explain in depth about ECG
Reading File
Now let me search the medical library for comprehensive ECG content in parallel.
Finding Sources
Finding Sources
Excellent findings. Let me now read the key ECG sections from Ganong's Physiology and Miller's Anesthesia in parallel.
Reading File
Reading File
Excellent. Now let me get more detailed ECG content - waves, intervals, leads, and clinical interpretation - in parallel.
Reading File
Finding Sources
Good - now let me fetch the key ECG diagram images and read more content about clinical ECG interpretation.
Loading Image
Loading Image
Reading File
Now let me get more clinical ECG content - the axis, arrhythmias, MI patterns - and fetch the cardiac cycle diagram.
Reading File
Loading Image
Loading Image
Excellent content gathered. Now let me get the clinical interpretation section and arrhythmias from the textbook.
Reading File
Finding Sources
I now have rich, comprehensive content from authoritative textbooks. Let me compile the full in-depth explanation.
Electrocardiogram (ECG) - In-Depth Guide
1. What is an ECG?
An ECG (electrocardiogram, also written EKG from the German Elektrokardiogramm) is a graphical recording of the electrical potential differences generated by the heart, captured at the body surface. Because body fluids are good conductors (the body acts as a volume conductor), the algebraic sum of action potentials from millions of myocardial cells can be detected by surface electrodes. The result is a time-voltage tracing that reflects the sequence of electrical activation and recovery across the heart with each beat.
- Ganong's Review of Medical Physiology, 26th Ed.
2. The Cardiac Conduction System (Basis of the ECG)
Before the ECG waveform makes sense, you must understand the electrical highway it reflects:
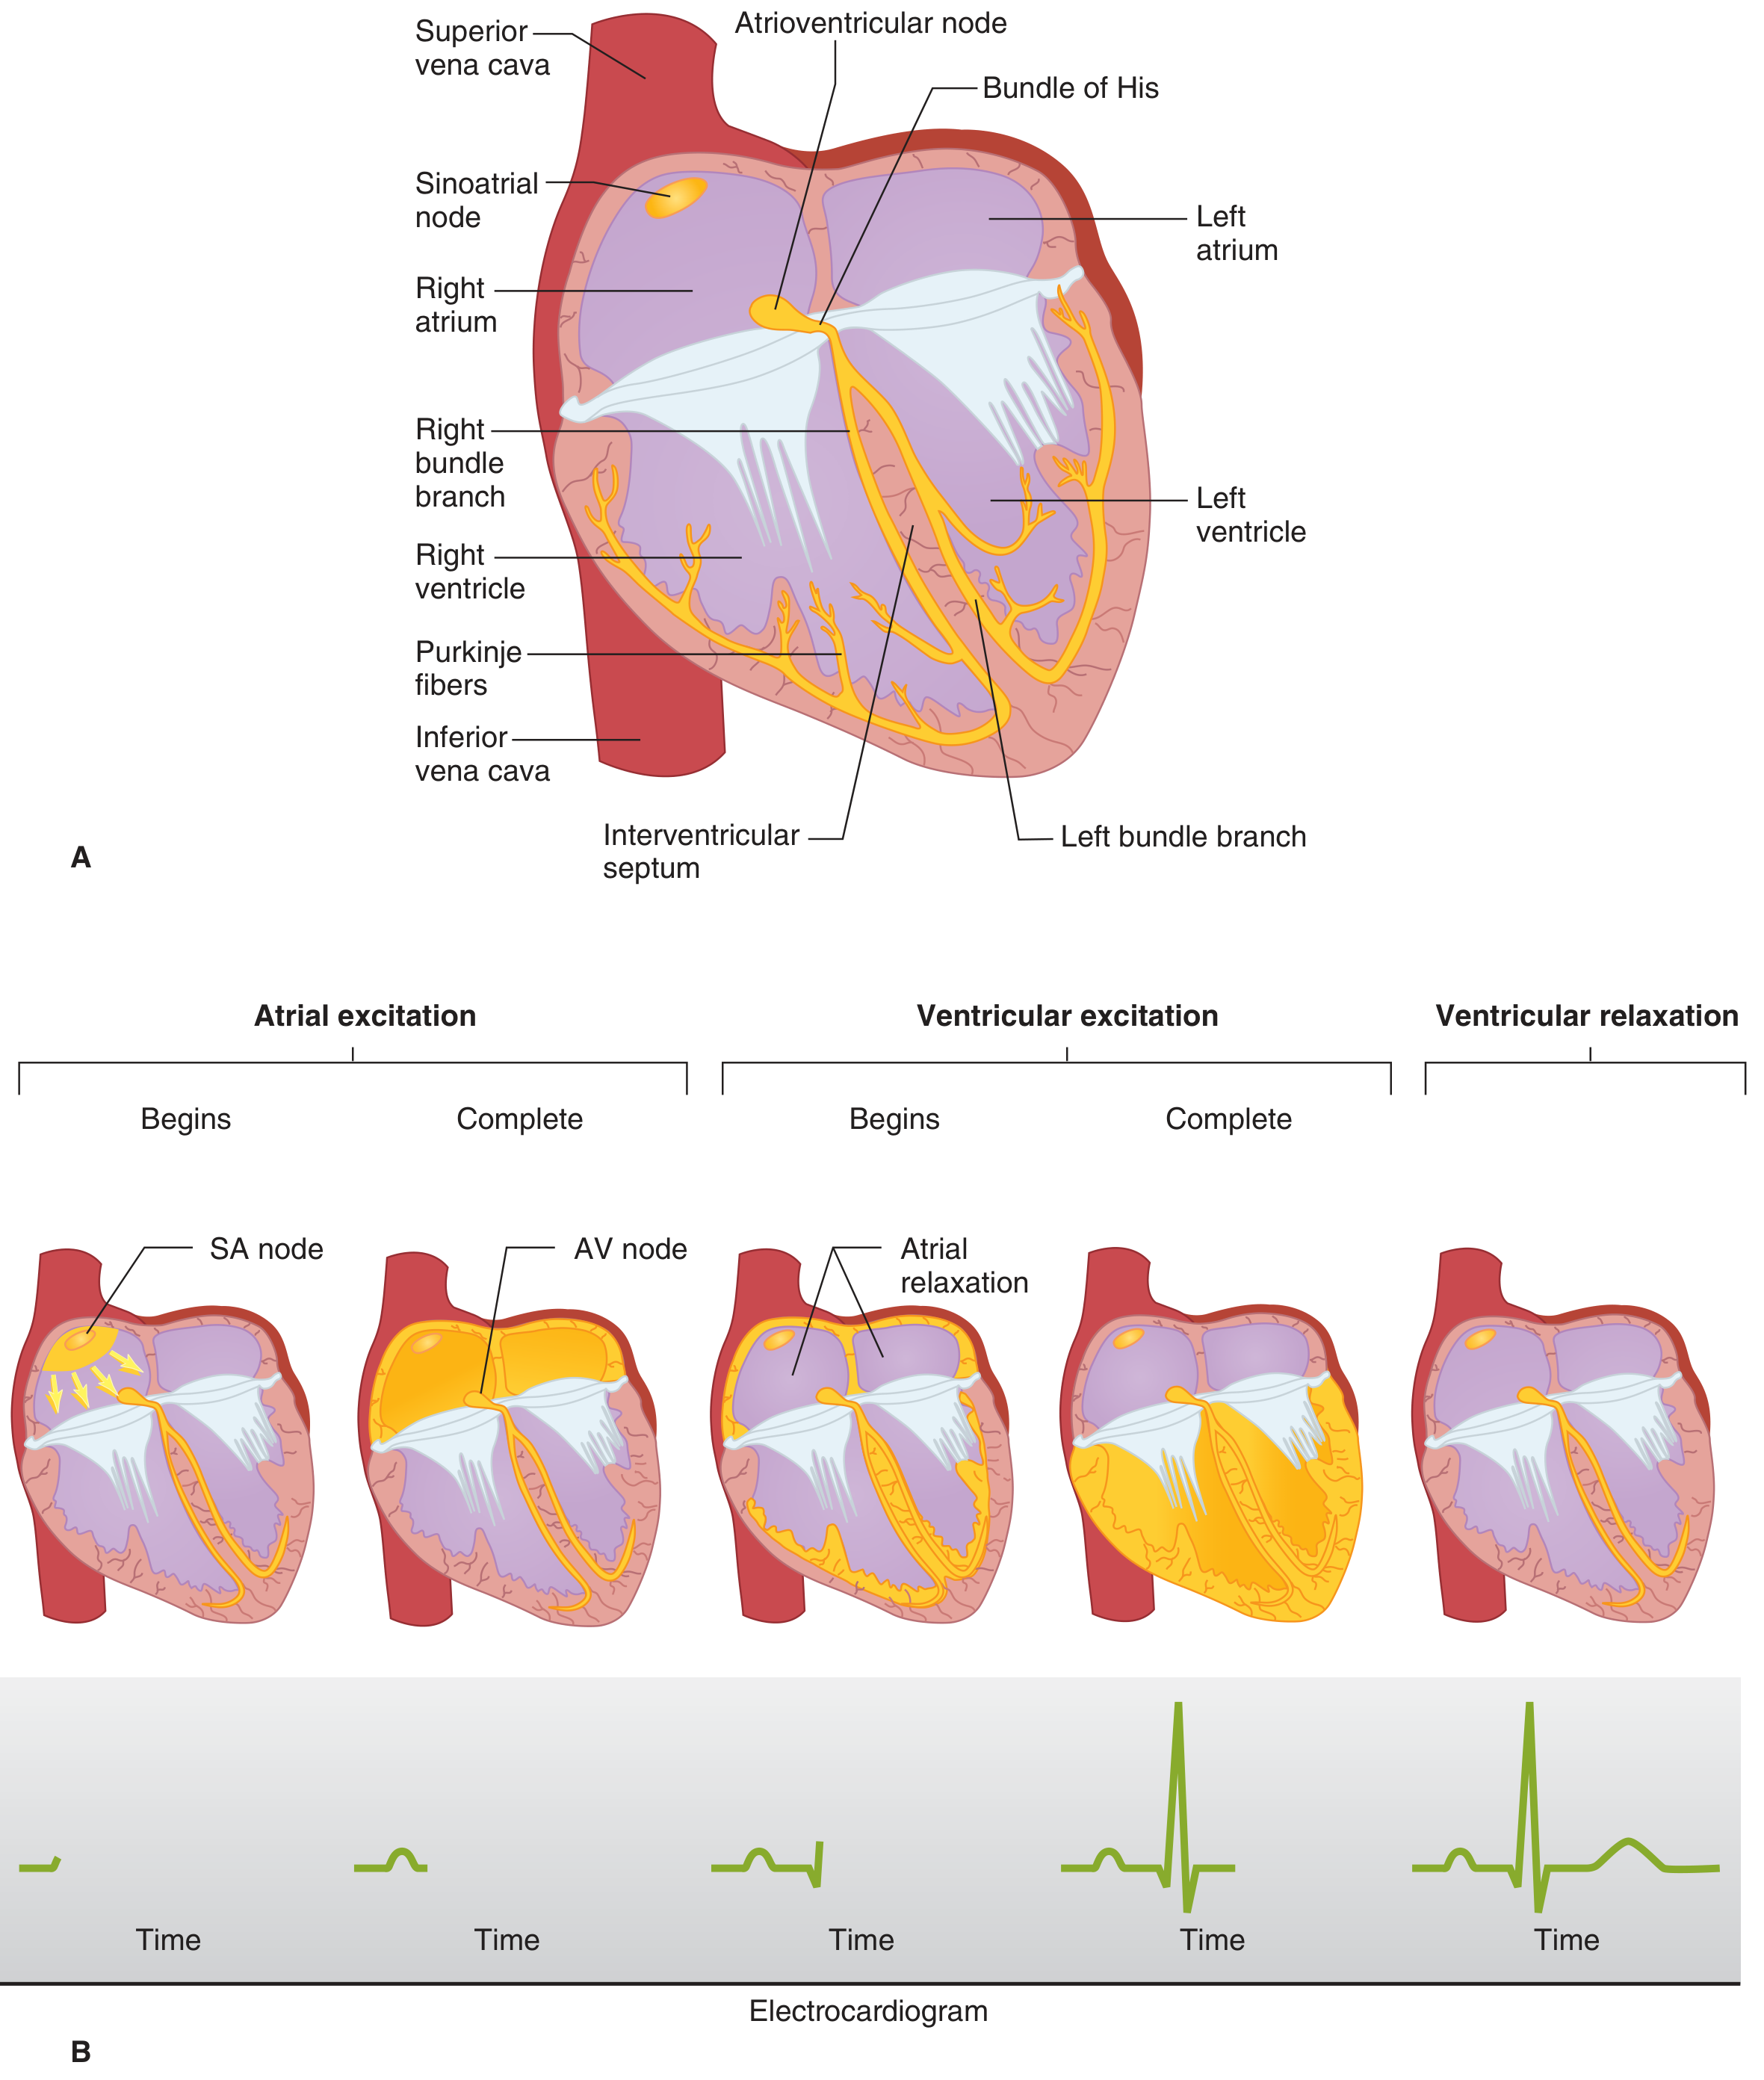
Figure: Cardiac conduction system (A) and sequence of electrical activation with corresponding ECG waveforms (B). From Ganong's Review of Medical Physiology.
| Structure | Function | Normal Conduction Velocity |
|---|---|---|
| SA node | Primary pacemaker; intrinsic rate 60-100/min | Slow (~0.05 m/s) |
| Internodal pathways | Spread depolarization through atria | Moderate |
| AV node | Gatekeeper; delays impulse ~0.1 s | Very slow (~0.05 m/s) - this delay is the PR interval |
| Bundle of His | Connects AV node to bundle branches | Fast |
| Left & right bundle branches | Transmit impulse rapidly to ventricles | Very fast (~2 m/s) |
| Purkinje fibers | Terminal network; depolarizes all ventricular myocytes in 0.08-0.1 s | Fastest (~4 m/s) |
The AV nodal delay is modulated by the autonomic nervous system: sympathetic stimulation shortens it (speeds HR), vagal stimulation lengthens it (slows HR). Ventricular depolarization begins at the left side of the interventricular septum, sweeps across the mid-septum to the right, then down the septum to the apex, then back up the ventricular walls from endocardium to epicardium. The last regions to depolarize are the posterobasal left ventricle, pulmonary conus, and upper septum.
3. ECG Waveforms, Segments, and Intervals
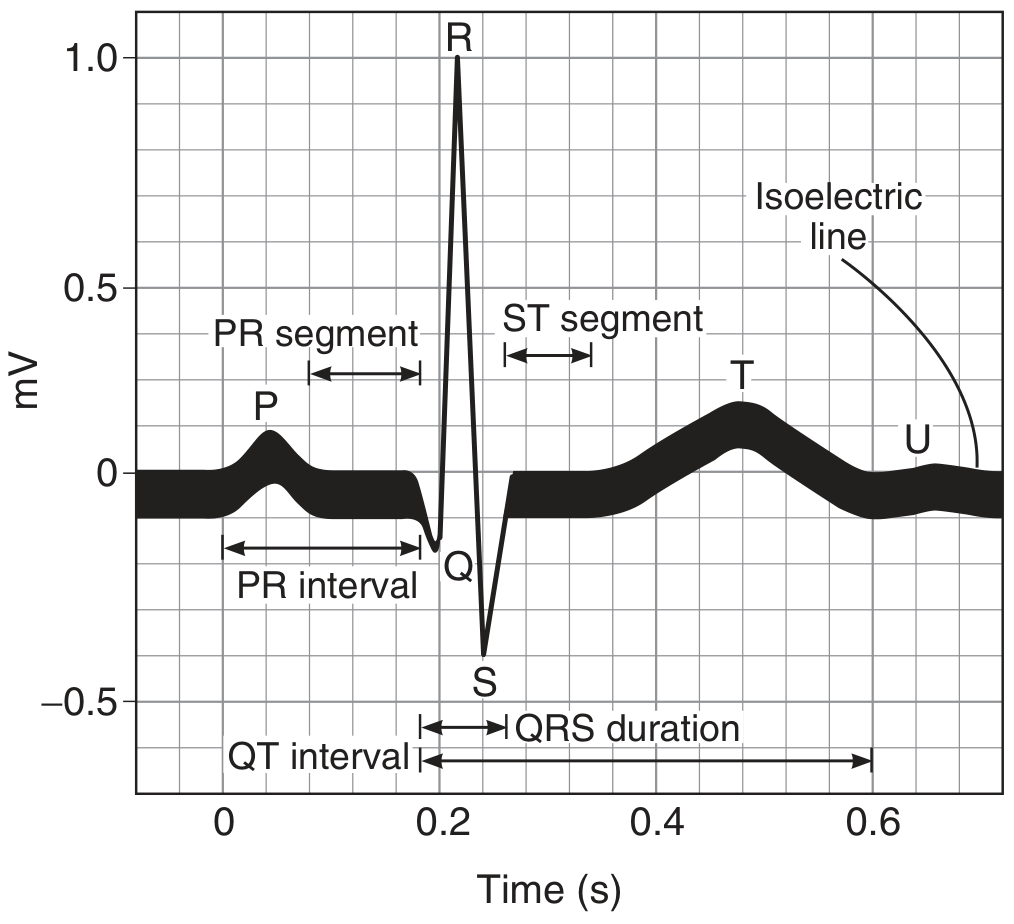
Figure: Standard ECG waveform with all named components. From Ganong's Review of Medical Physiology, 26th Ed.
Waves
| Wave | Represents | Normal Duration/Amplitude |
|---|---|---|
| P wave | Atrial depolarization (SA node → both atria) | Duration < 0.12 s; amplitude < 2.5 mm |
| Q wave | Initial septal depolarization (left→right) | Small, < 1/4 of R-wave height; < 0.04 s |
| R wave | Main ventricular depolarization (downward sweep) | Largest positive deflection |
| S wave | Terminal ventricular depolarization (base of heart) | Small negative deflection |
| T wave | Ventricular repolarization | Broad, upright; direction normally same as QRS |
| U wave | Inconstant; possibly ventricular myocytes with long action potentials | Small positive deflection after T wave |
Why is there no "atrial repolarization wave"? Atrial repolarization is buried within the much larger QRS complex.
Intervals and Segments
| Interval | Normal Value | Represents |
|---|---|---|
| PR interval | 0.12-0.20 s (average 0.18 s) | AV conduction time (atria → ventricles through AV node) |
| QRS duration | < 0.10 s (average 0.08 s) | Ventricular depolarization |
| ST segment | Isoelectric (at baseline) | Period between ventricular depolarization and repolarization - all cells equally depolarized |
| QT interval | Up to 0.43 s (rate-corrected QTc < 0.44 s) | Duration of ventricular action potential (depol + repol) |
| PR segment | Isoelectric | Conduction through AV node + His-Purkinje |
The isoelectric line (baseline) represents the period when no net electrical activity is detectable.
4. ECG and the Cardiac Cycle
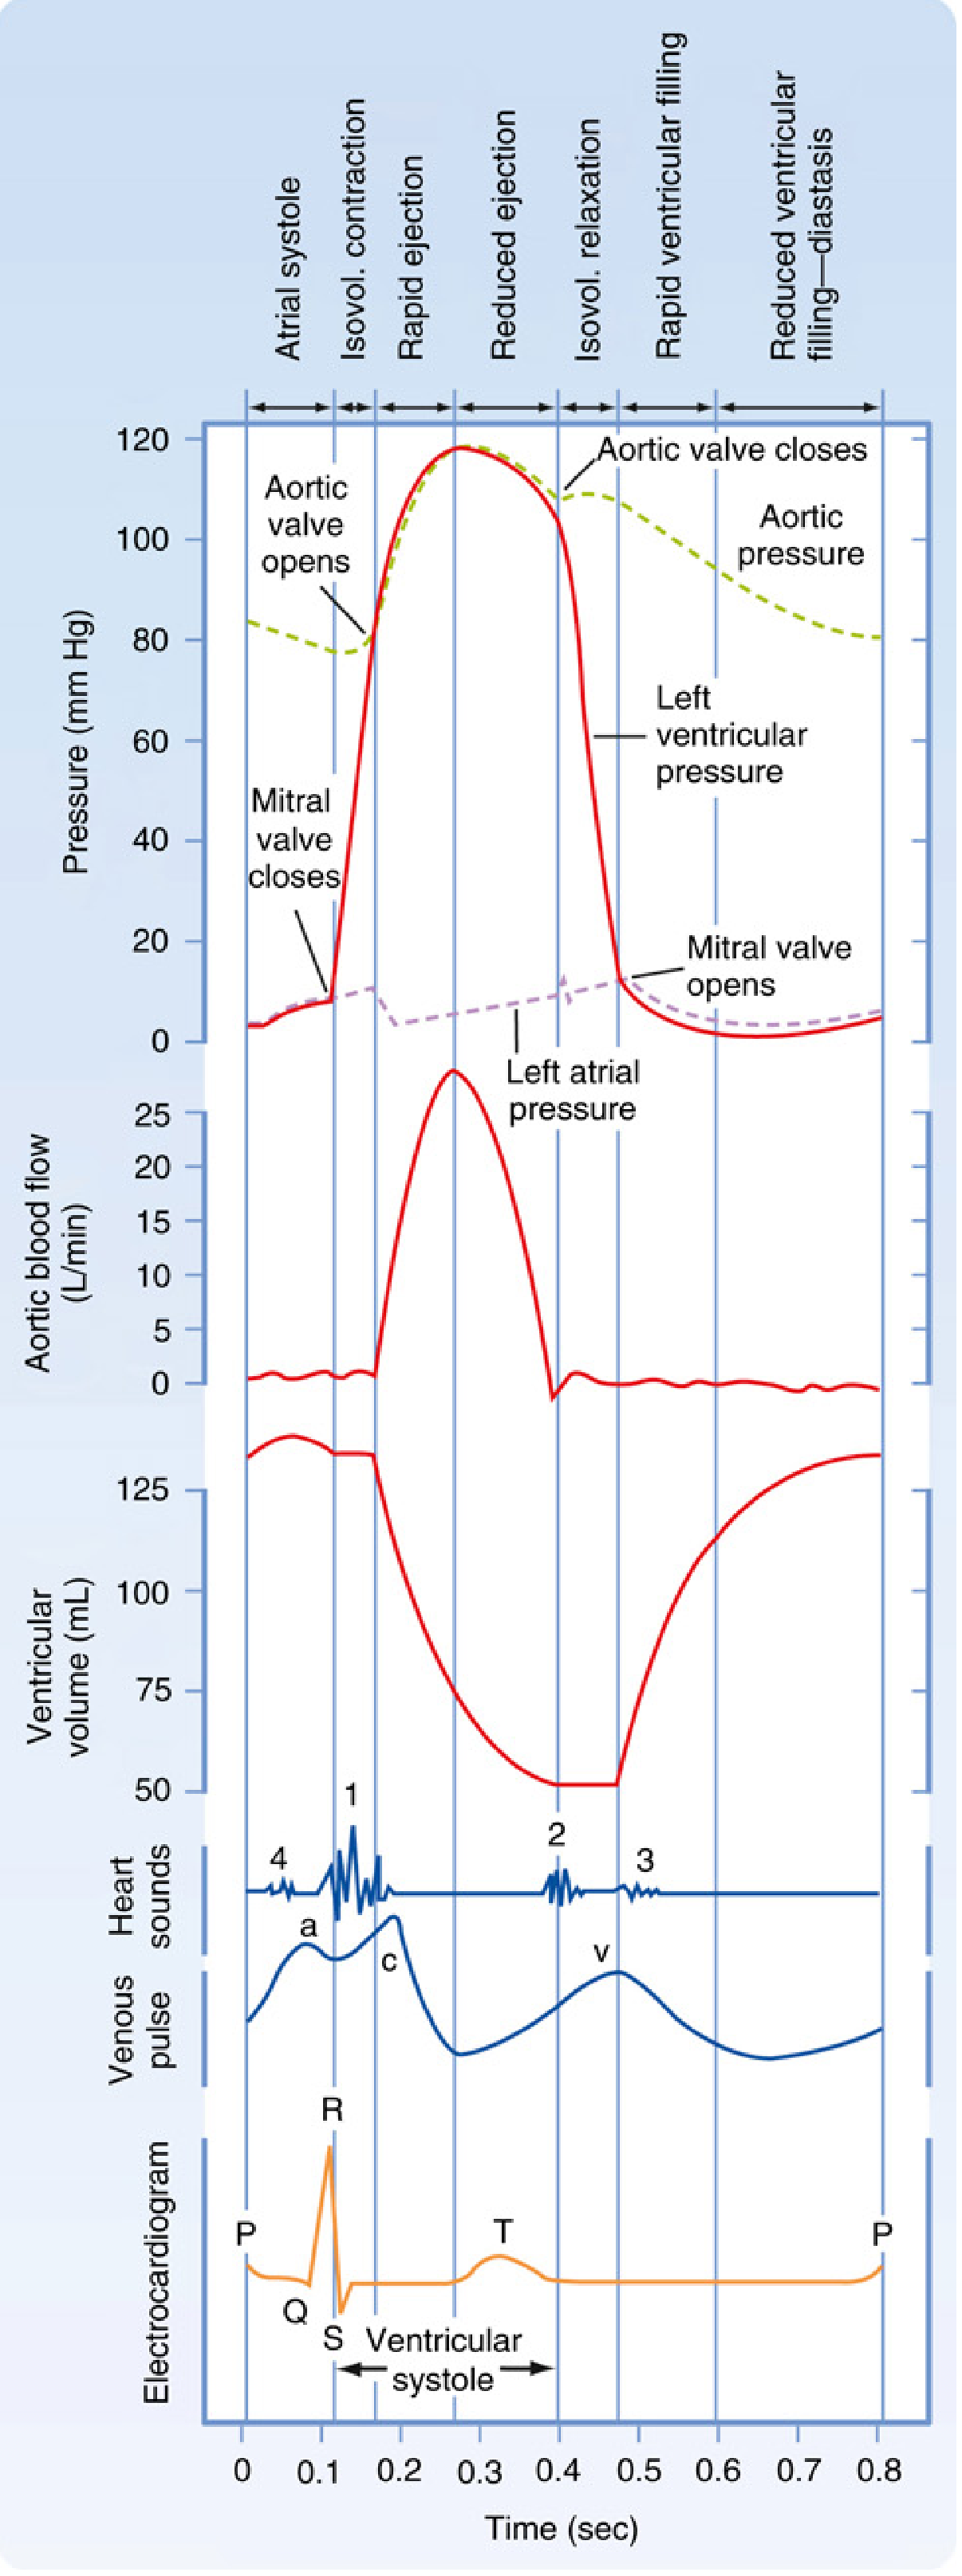
Figure: Electrical and mechanical events during a single cardiac cycle correlated with the ECG. From Miller's Anesthesia, 10th Ed.
The ECG correlates precisely with the mechanical cardiac cycle:
-
P wave → onset of atrial systole (atrial "kick")
-
End of R wave (QRS) → mitral/tricuspid valves close; ventricular systole begins
-
QRS complex → isovolumetric contraction → ventricular ejection (aortic/pulmonic valves open)
-
T wave → isovolumetric relaxation; ventricular repolarization
-
After T wave → rapid ventricular filling begins
-
Miller's Anesthesia, 10th Ed.
5. ECG Leads: How the 12-Lead ECG is Built
The standard 12-lead ECG uses 10 electrodes to generate 12 views of cardiac electrical activity.
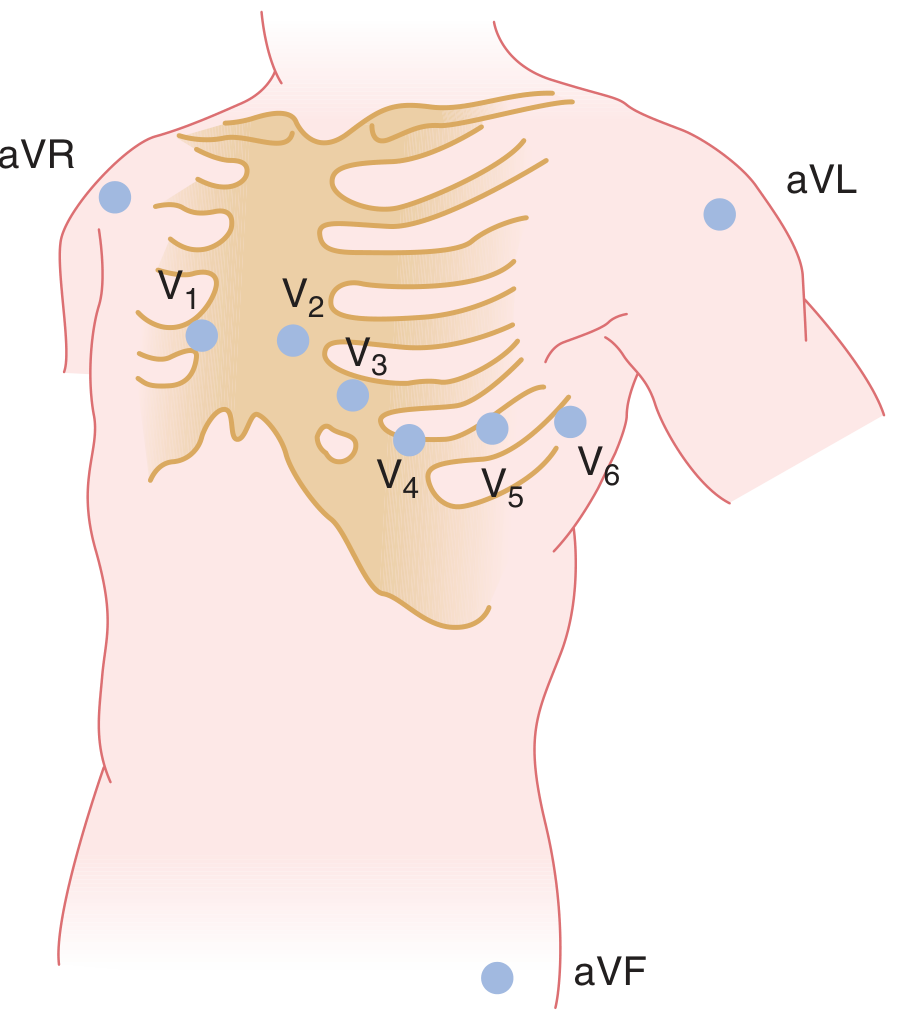
Figure: Electrode placement for unipolar leads (precordial V1-V6 and augmented limb leads aVR, aVL, aVF). From Ganong's Review of Medical Physiology, 26th Ed.
Bipolar Limb Leads (Einthoven's Triangle)
These record the potential difference between two limb electrodes:
| Lead | Positive electrode | Negative electrode | View |
|---|---|---|---|
| I | Left arm (LA) | Right arm (RA) | Lateral |
| II | Left leg (LL) | Right arm (RA) | Inferior |
| III | Left leg (LL) | Left arm (LA) | Inferior |
Einthoven's law: Lead II = Lead I + Lead III at any instant.
Augmented Unipolar Limb Leads
These record potential at a single limb against the average of the other two:
| Lead | Electrode | View |
|---|---|---|
| aVR | Right arm | Looks into the cavities of ventricles; all major deflections normally negative |
| aVL | Left arm | High lateral wall |
| aVF | Left foot | Inferior wall |
Precordial (Chest) Leads V1-V6
Six electrodes placed on the anterior chest wall:
| Lead | Position | Anatomic Region |
|---|---|---|
| V1 | 4th intercostal space, right sternal border | Septal/RV |
| V2 | 4th intercostal space, left sternal border | Septal/RV |
| V3 | Between V2 and V4 | Anterior |
| V4 | 5th intercostal space, midclavicular line | Anterior/apex |
| V5 | Anterior axillary line | Lateral |
| V6 | Midaxillary line | Lateral |
R-wave progression: In normal hearts, the R wave grows progressively from V1 (small or absent) to V5/V6 (large), reflecting the transition from right-sided to left-sided dominance.
- Ganong's Review of Medical Physiology, 26th Ed.
6. The Electrical Axis
The mean QRS axis is the average direction of ventricular depolarization in the frontal plane, estimated from the limb leads using the Einthoven triangle.
- Normal axis: -30° to +110°
- Left axis deviation (LAD): < -30° → suggests left ventricular hypertrophy, left anterior fascicular block
- Right axis deviation (RAD): > +110° → suggests right ventricular hypertrophy, left posterior fascicular block, pulmonary embolism
A quick clinical trick: if the QRS is positive in Lead I and positive in aVF, the axis is normal.
7. Systematic ECG Interpretation - Step-by-Step Approach
A structured approach prevents missing findings:
-
Rate - Count R-R intervals. At 25 mm/s paper speed: Rate = 300 ÷ number of large boxes between R waves
- Normal: 60-100/min
- Bradycardia: < 60/min
- Tachycardia: > 100/min
-
Rhythm - Is it regular? Is there a P wave before every QRS? Is every P followed by a QRS?
-
Axis - Normal, LAD, or RAD?
-
P wave - Morphology, duration, axis (should be upright in I and II)
-
PR interval - Normal 0.12-0.20 s
-
QRS complex - Width (< 0.10 s = narrow = supraventricular origin; > 0.12 s = wide = bundle branch block or ventricular origin), morphology
-
ST segment - Elevation or depression from baseline?
-
T wave - Upright, inverted, peaked?
-
QT interval - Corrected QTc = QT ÷ √(RR interval in seconds) [Bazett formula]
8. Key Pathological Patterns
Myocardial Infarction
The ECG evolves through stages in STEMI:
| Stage | ECG Finding |
|---|---|
| Hyperacute (minutes) | Tall, peaked T waves (hyperacute T waves) |
| Acute (hours) | ST-segment elevation (tombstone pattern in severe cases) |
| Hours-days | Q waves develop; T waves invert |
| Weeks-months | Q waves persist; ST returns to baseline |
Localizing the infarct by leads:
| Territory | Leads with changes | Artery |
|---|---|---|
| Anterior | V1-V4 | LAD |
| Inferior | II, III, aVF | RCA (or LCx) |
| Lateral | I, aVL, V5-V6 | LCx |
| Posterior | Tall R in V1, ST depression V1-V2 | RCA/LCx |
| Right ventricular | ST elevation in V1, V4R | RCA |
NSTEMI/UA: ST depression and/or T-wave inversions without ST elevation.
Heart Block (AV Conduction Disorders)
| Type | ECG Feature |
|---|---|
| 1st degree | PR interval > 0.20 s; all P waves conduct |
| 2nd degree Mobitz I (Wenckebach) | Progressive PR lengthening until a P wave is not conducted; pattern repeats |
| 2nd degree Mobitz II | Fixed PR interval with sudden non-conducted P waves; high risk of progression |
| 3rd degree (complete) | P waves and QRS complexes are completely dissociated; ventricular rate 35-45/min (Stokes-Adams syndrome with syncope) |
Bundle Branch Blocks
- RBBB: Wide QRS > 0.12 s, RSR' ("rabbit ears") in V1, slurred S in I, V5, V6
- LBBB: Wide QRS > 0.12 s, broad R in I, V5, V6 with no septal Q; discordant ST/T changes
Atrial Fibrillation
- Absent P waves; replaced by chaotic fibrillatory baseline
- Irregularly irregular RR intervals
- Narrow QRS (unless aberrant conduction)
Atrial Flutter
- Sawtooth flutter waves at 250-350/min in inferior leads (II, III, aVF)
- Regular ventricular response at 2:1, 3:1, or 4:1 block
Ventricular Tachycardia
- Wide QRS (> 0.12 s), rate 100-250/min, AV dissociation
- Capture beats and fusion beats are pathognomonic
Long QT Syndrome
- QTc > 0.44 s (men) / 0.46 s (women)
- Risk of Torsades de Pointes
- Causes: congenital (LQT1-LQT8), drugs (antiarrhythmics, macrolides, antipsychotics), hypokalemia, hypomagnesemia
9. His Bundle Electrogram (HBE)
In complex conduction disorders, an invasive catheter-mounted electrode near the tricuspid valve records the His bundle electrogram, showing:
- A deflection: AV nodal activation
- H spike: His bundle conduction
- V deflection: Ventricular depolarization
Normal intervals: PA ~27 ms, AH ~92 ms, HV ~43 ms. The AH interval reflects AV nodal conduction time; prolongation indicates AV nodal disease.
10. ECG Monitoring Modalities
| Type | Use |
|---|---|
| Standard 12-lead ECG | Snapshot diagnosis - arrhythmia, ischemia, blocks |
| Holter monitor (24-48 h) | Ambulatory continuous recording; detects paroxysmal arrhythmias, sick sinus syndrome |
| Event monitor / loop recorder | Patient-activated; weeks to months; for infrequent palpitations/syncope |
| Exercise stress ECG | Provokes ischemia (ST changes) under controlled exertion; sensitivity ~70%, specificity ~75% for CAD |
| ICU/telemetry monitoring | Continuous rhythm monitoring with alarm systems |
| Implantable loop recorder | Subcutaneous device; up to 3 years; for unexplained syncope |
11. Clinical Applications Summary
| Indication | What the ECG Shows |
|---|---|
| Chest pain | ST elevation/depression, T-wave changes - rule in/out ACS |
| Palpitations | Arrhythmia type, rate, regularity |
| Syncope | Arrhythmia, block, long QT, Brugada pattern |
| Shortness of breath | RV strain (PE), LVH, atrial fibrillation |
| Electrolyte disturbances | Hyperkalemia (peaked T, wide QRS, sine wave), hypokalemia (flat T, U waves, ST depression) |
| Drug toxicity | QT prolongation, digoxin toxicity (scooped ST, bidirectional VT) |
| Pre-operative assessment | Baseline rhythm, LVH, old infarcts, conduction disease |
Key references:
- Ganong's Review of Medical Physiology, 26th Ed. - Chapter 29, "The Electrocardiogram"
- Miller's Anesthesia, 10th Ed. - Chapter 13, "Electrical Events and the ECG"
- Tintinalli's Emergency Medicine - ECG in ACS
- Goldman-Cecil Medicine - Coronary artery disease and ECG patterns
This is a shared conversation. Sign in to Orris to start your own chat.