
How to explain wht is LDH to patient and raise in it causes
LDH lactate dehydrogenase elevated causes patient explanation
LDH lactate dehydrogenase enzyme diagram isoenzymes
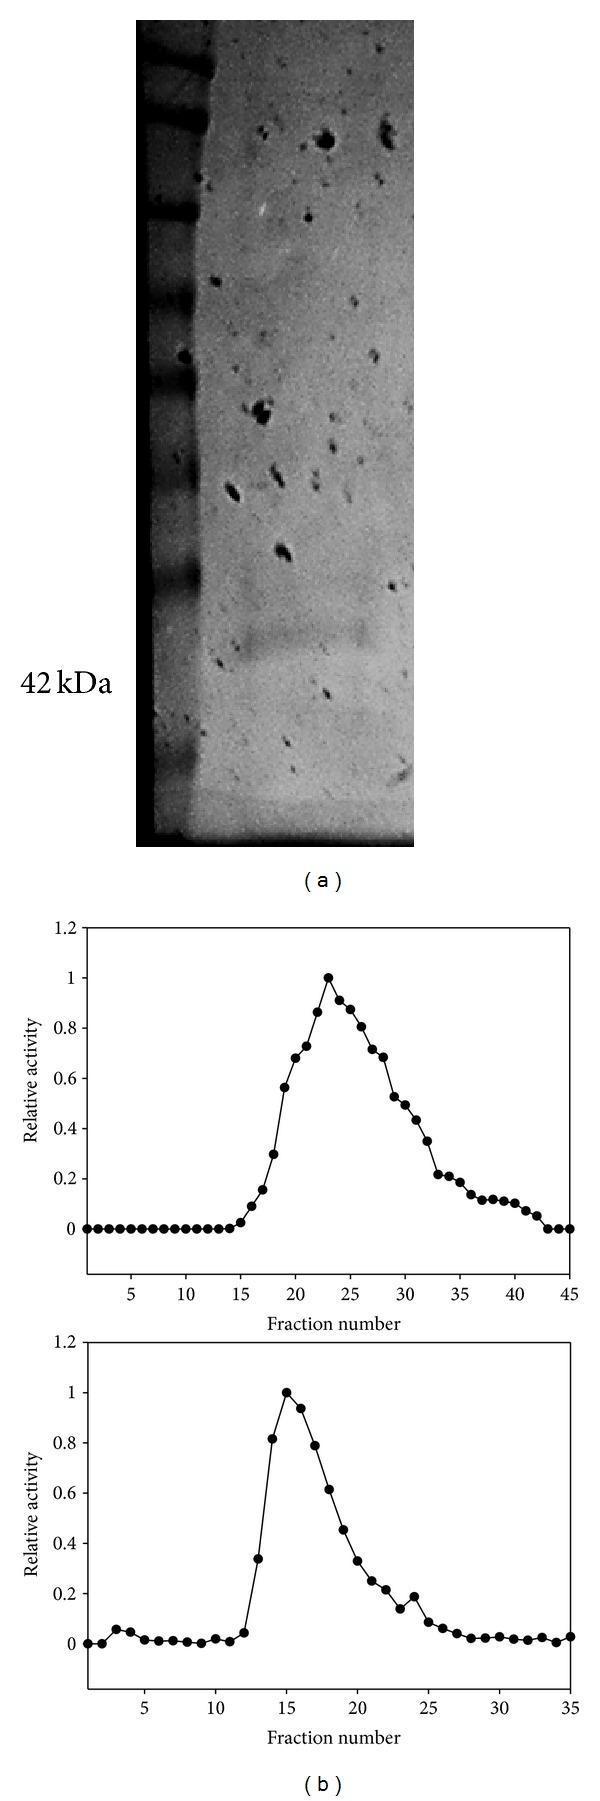
Educational scientific figure illustrating protein purification and characterization techniques, specifically for Lactate Dehydrogenase (LDH). Figure (a) displays a Diagnostic Image of a silver-stained polyacrylamide gel electrophoresis (PAGE) used for assessing electrophoretic homogeneity. The left lane contains a protein molecular weight ladder with a visible reference band labeled at 42 kDa. The adjacent lane demonstrates a single distinct band representing purified LDH, indicating successful isolation. Figure (b) presents two Comparison Charts showing elution profiles of LDH activity. The top graph depicts purification using a blue agarose affinity column, characterized by a broad elution peak ranging from fraction 15 to 40, peaking at fraction 25. The bottom graph shows purification using an oxamate affinity column, displaying a significantly sharper and narrower elution peak between fractions 10 and 25, peaking at fraction 15. This comparison demonstrates the higher specificity and resolving power of the oxamate column for attaining highly purified enzyme samples. These visuals are essential for understanding biochemical laboratory techniques and metabolic enzyme regulation.
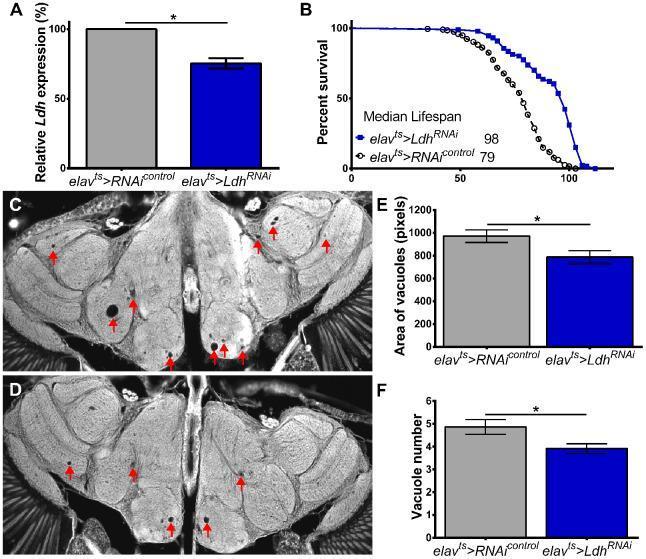
A multi-panel figure illustrating the neuroprotective effects of neuronal Lactate Dehydrogenase (Ldh) knockdown in an aging model. Panel A: A bar graph shows reduced relative Ldh expression in elavts>LdhRNAi specimens compared to controls. Panel B: A Kaplan-Meier survival curve demonstrates significant lifespan extension in the Ldh knockdown group (median 98 days) versus control (median 79 days). Panels C and D: Grayscale diagnostic-style images of brain sections from 75-day-old specimens. Panel C (control) exhibits numerous large, dark, circular vacuoles (indicated by red arrows) throughout the neuropil, characteristic of age-related neurodegeneration. Panel D (LdhRNAi) shows a marked reduction in both the size and frequency of these vacuoles. Panels E and F: Quantitative comparison charts confirm that neuronal Ldh knockdown significantly decreases both the average total area of vacuoles (in pixels) and the absolute vacuole number. Statistical significance is indicated by asterisks and bars representing standard error of the mean (SEM), highlighting the role of Ldh modulation in delaying neuropathological progression.
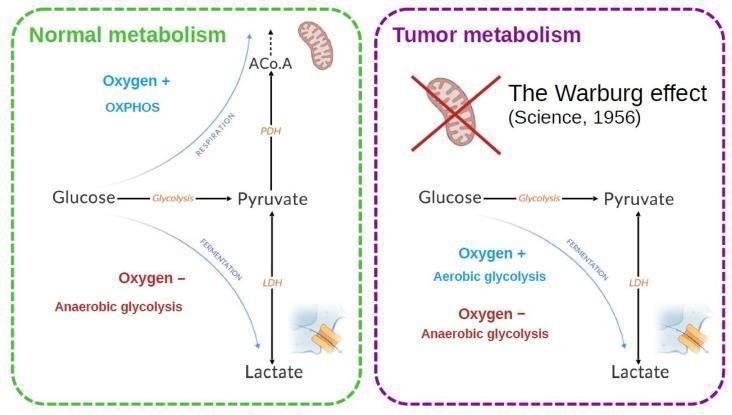
A pathophysiology diagram comparing cellular energy metabolism in normal versus tumor cells. The 'Normal metabolism' panel illustrates that glucose is converted to pyruvate via glycolysis. In the presence of oxygen (Oxygen + OXPHOS), pyruvate is converted to Acetyl-CoA (ACo.A) via Pyruvate Dehydrogenase (PDH) for mitochondrial respiration. In the absence of oxygen (Oxygen - Anaerobic glycolysis), pyruvate is converted to lactate via Lactate Dehydrogenase (LDH) through fermentation. In contrast, the 'Tumor metabolism' panel highlights the 'Warburg effect,' visually depicted by a red 'X' over the mitochondrion. Here, tumor cells predominantly utilize aerobic glycolysis even in the presence of oxygen, resulting in an increased flux from glucose to pyruvate and subsequently to lactate via fermentation. Key enzymes depicted include PDH and LDH, and a membrane-bound transporter (likely MCT) is shown facilitating lactate efflux. The diagram uses dashed borders (green for normal, purple for tumor) and specific color-coded text to differentiate between physiological respiration and pathological aerobic glycolysis.
LDH (Lactate Dehydrogenase) - Patient Explanation & Causes of Elevation
How to Explain LDH to a Patient (Plain Language)
"Think of LDH as an alarm enzyme that lives inside your cells. Every cell in your body - your heart, liver, muscles, kidneys, red blood cells - contains LDH. Normally, a small amount is present in your blood. But when cells are damaged or destroyed for any reason, they burst open and release LDH into the bloodstream. So when we see a high LDH on your blood test, it's your body's way of telling us that somewhere, cells are being damaged. LDH itself is not a disease - it's a signal that something is happening. We then need to figure out WHERE the damage is coming from."
Key points to communicate:
- LDH is a natural enzyme - everyone has it; some in the blood is normal
- A high LDH = cell damage somewhere in the body - it is not specific to one organ
- LDH levels rise quickly after injury, peak, then gradually fall as healing occurs (e.g., after a heart attack, LDH peaks at 2-3 days and normalises in 10-14 days)
- LDH alone cannot tell us the diagnosis - doctors use it alongside other tests to narrow down the cause
- Normal range in adults: approximately 122-222 U/L (may vary by lab)
What Is LDH (For Clinicians)?
L-Lactate + NAD⁺ ⇌ Pyruvate + NADH + H⁺
| Isoenzyme | Subunits | Main Location |
|---|---|---|
| LDH-1 | H4 | Heart, red blood cells, kidney cortex |
| LDH-2 | H3M | Heart, red blood cells |
| LDH-3 | H2M2 | Lungs, spleen, lymph nodes |
| LDH-4 | HM3 | Liver, skeletal muscle |
| LDH-5 | M4 | Liver, skeletal muscle |
Causes of Elevated LDH
1. Hematological Causes (Often Very High - Up to 50x Normal)
- Megaloblastic anemia (B12/folate deficiency) - most dramatic rises (up to 50x URL) due to ineffective erythropoiesis releasing massive amounts of LDH-1 and LDH-2 in the bone marrow
- Hemolytic anemia - LDH-1 dominates; used alongside haptoglobin (which falls) to confirm intravascular hemolysis
- Pernicious anemia - marked elevation
- Sickle cell disease - chronic hemolysis raises LDH persistently
2. Cardiac Causes
- Myocardial infarction - LDH-1 and LDH-2 rise, with a characteristic "flip" pattern (LDH-1 > LDH-2) appearing 12-24 hours after infarction and lasting 10-14 days. Historically used before troponin became standard.
- Cardiac surgery / myocarditis
3. Malignancy (Important Prognostic Marker)
- Lymphomas (Hodgkin's and Non-Hodgkin's) - LDH used to predict survival and monitor disease activity
- Leukemia - elevated LDH correlates with disease activity
- Multiple myeloma - elevated LDH signals aggressive disease biology (incorporated into the Revised International Staging System)
- Germ cell tumors (seminoma, testicular teratoma, dysgerminoma) - notably elevated LDH-1 in ~60% of cases; used as a tumor marker
- Metastatic cancer - up to 70% of patients with liver metastases and 20-60% with non-hepatic metastases (lymph nodes) have raised LDH
- Melanoma, renal cell carcinoma, lung cancer, osteosarcoma, prostate cancer - elevated LDH predicts poorer outcomes
"A raised LDH in a cancer patient is often a sign of aggressive or widespread disease."
4. Liver Disease
- Hepatitis (viral, alcoholic, drug-induced)
- Cirrhosis
- Liver congestion or infarction
- LDH-4 and LDH-5 dominate - but elevation is typically less dramatic than with AST/ALT, limiting its standalone utility in liver disease
5. Pulmonary Causes
- Pulmonary embolism - LDH may be the only abnormal lab finding
- Pneumonia - especially severe infections
- Pulmonary infarction
- Pleural effusion - serum LDH (with pleural fluid LDH) used in Light's Criteria to distinguish exudates from transudates
6. Renal Disease
- Tubular necrosis (acute kidney injury)
- Pyelonephritis
- Raised in ~1/3 of kidney disease patients, but does not correlate well with proteinuria
7. Muscle Disease / Trauma
- Rhabdomyolysis (muscle breakdown from crush injury, intense exercise, drugs like statins)
- Muscular dystrophies (e.g., Duchenne) - especially early and middle stages
- Fractures, major trauma, surgery
8. Infections & Inflammatory Conditions
- Infectious mononucleosis (Epstein-Barr virus)
- HIV - used as a marker in monitoring
- Severe malaria
- Encephalitis, meningitis
- Sepsis / severe systemic infection
9. Neurological Causes
- Intracranial hemorrhage - marked elevation
- CNS lymphoma, leukemia, or metastatic carcinoma - >40 U/L above normal in CSF/serum is characteristic
10. Other / Miscellaneous
- Hypoxia / severe shock - any cause of widespread tissue ischemia
- Anorexia nervosa - skeletal muscle breakdown
- Macro-LDH - a rare benign condition (autoantibody-enzyme complex) causing persistent elevation up to 8x without actual disease; important to exclude to avoid unnecessary investigations
Causes of LOW LDH
- High-dose Vitamin C or Vitamin E intake (analytical interference)
- LDH gene deficiency - rare inherited disorder
Quick Clinical Memory Aid
| Level of Elevation | Think of... |
|---|---|
| Very high (>10x) | Megaloblastic anemia, severe hemolysis, leukemia |
| Moderately high (2-10x) | MI, lymphoma, liver disease, muscle damage |
| Mildly high (1-2x) | Pneumonia, PE, renal disease, early malignancy |