
Iron Deficiency Anemia & Nutritional Anemia: Causes, clinical features, laboratory workup/investigations (including peripheral smear findings and RBC indices), and treatment (including oral iron therapy in a 2-year-old child).
iron deficiency anemia peripheral blood smear hypochromic microcytic red cells
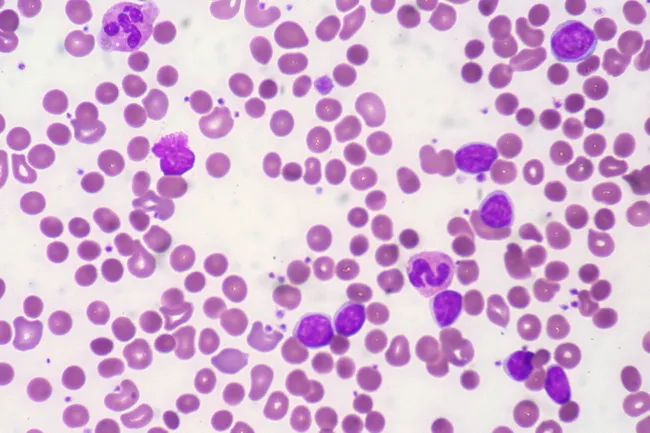
Peripheral blood smear from a patient with known chronic lymphocytic leukemia (CLL) showing autoimmune hemolytic anemia (AIHA). Brightfield microscopy of Wright-Giemsa stained smear at 1000x (oil immersion) reveals two dominant cell populations: numerous small mature lymphocytes typical of CLL and red blood cells showing spherocytic deformation. A smudge cell is evident just left of center, a classical clue for CLL. Red cells display reduced central pallor consistent with spherocytes, indicating intravascular or extravascular hemolysis driven by autoantibodies. The background shows mild polychromasia and rare nucleated RBCs, consistent with a robust reticulocyte response; the corrected reticulocyte count in this case is markedly elevated (>7%). Platelets are not significantly abnormal. These features collectively support autoimmune destruction of erythrocytes in the setting of CLL. Diagnostic significance lies in recognizing AIHA as a common autoimmune complication in CLL, with a clinical picture of sudden Hb decline and compensatory erythropoiesis. Differential considerations include drug-induced hemolysis, other causes of hemolytic anemia, or marrow infiltration by CLL. Clinical correlation includes therapy implications (steroids, rituximab) and close monitoring of hemolysis markers. This image is a valuable teaching resource for hematology morphology, AIHA in CLL, and differential diagnosis in anemia.
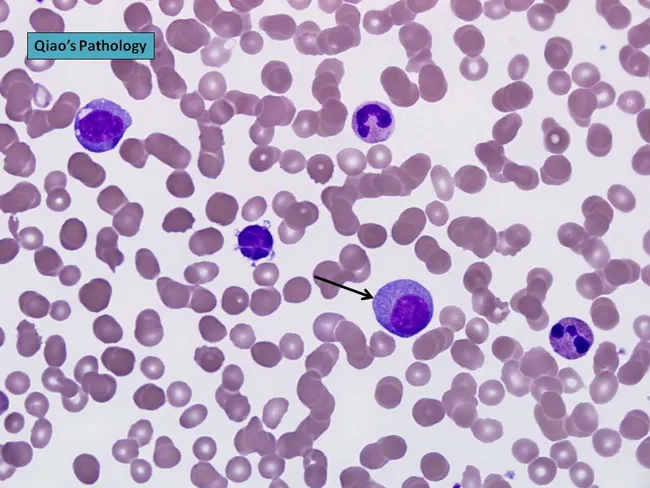
Peripheral blood smear prepared with Wright-Giemsa stain and examined under brightfield illumination using a 100× oil immersion objective reveals a single large plasma cell among a field of mature erythrocytes. The plasma cell displays features typical of clonal plasma cells: basophilic cytoplasm, an eccentrically placed round nucleus, and a conspicuous perinuclear hof; background shows rouleaux formation of red cells. This image exemplifies hematologic involvement by a plasma cell dyscrasia. In plasma cell leukemia, circulating plasma cells constitute more than 20% of leukocytes, a hallmark distinguishing it from conventional multiple myeloma, although both conditions share monoclonal plasma cell proliferation. The presence of circulating plasma cells is associated with younger patient age, higher incidence of anemia, thrombocytopenia, organomegaly, and possible lymphadenopathy; however lytic bone lesions may be less common. Immunophenotypic patterns often include lack of CD56 expression relative to myeloma. Clinically, this morphological finding warrants confirmation with complete blood count, peripheral smear review, quantitative plasma cell percentage, serum protein electrophoresis, and immunofixation to identify monoclonal immunoglobulin isotype (IgD/IgE or light-chain predominance). Early detection of circulating plasma cells supports prognosis assessment and guides therapy decisions in plasma cell dyscrasia management and monitoring, including risk stratification and treatment response evaluation for practice in clinics.
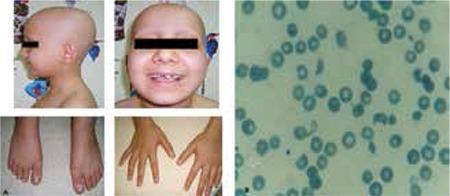
This composite image consists of clinical photographs and a diagnostic peripheral blood smear. Figure 1a (left) shows a pediatric patient with clinical signs including total alopecia (complete absence of scalp hair) and nail pitting affecting both hands and feet, characterized by small punctate depressions on the nail plates. Figure 1b (right) is a microscopic view of a peripheral blood smear demonstrating microangiopathic hemolytic anemia. Visible are numerous schistocytes—fragmented, irregular red blood cells including helmet cells and triangular forms—alongside some normal erythrocytes showing central pallor. The educational focus is on the multi-systemic manifestations of a medical condition, likely a microangiopathic process such as Hemolytic Uremic Syndrome (HUS) or similar systemic pathology, illustrating the correlation between dermatological signs (hair and nail changes) and hematological abnormalities (hemolysis and schistocytosis).
iron deficiency anemia microcytic hypochromic RBC pencil cells target cells
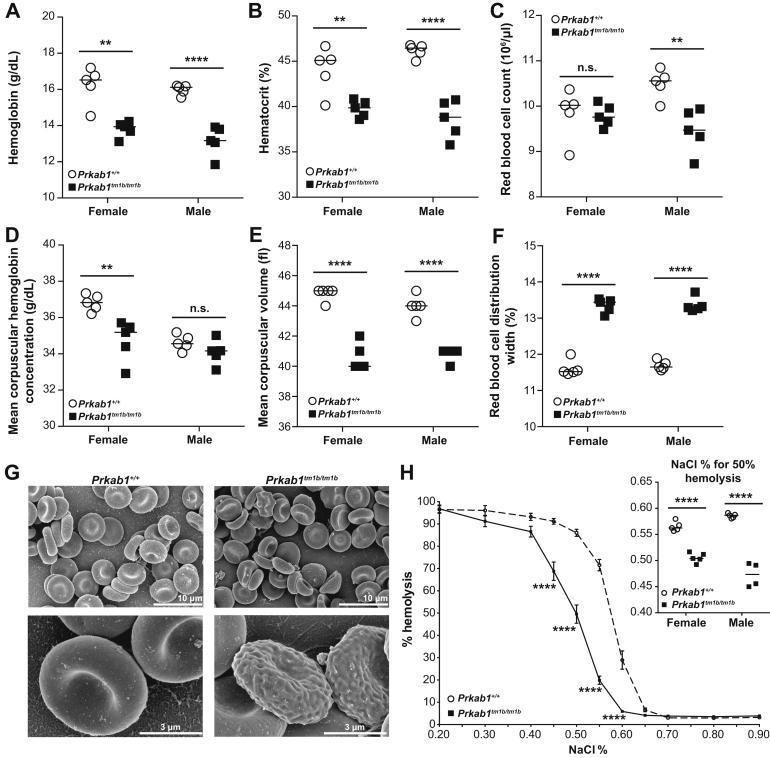
Educational figure illustrating hematological abnormalities in a murine model of Prkab1 deficiency, serving as a surrogate for studying human hemolytic anemia and microcytosis. Panels A-F present dot plots of hematological indices for wild-type (Prkab1+/+) and deficient (Prkab1tm1b/tm1b) mice, showing significant reductions in hemoglobin (A), hematocrit (B), and mean corpuscular volume (E), with a concomitant increase in red blood cell distribution width (F), indicating microcytic anemia with anisocytosis. Panel G contains high-resolution Scanning Electron Microscopy (SEM) images comparing erythrocyte morphology; wild-type cells show standard biconcave discocyte morphology, whereas Prkab1-deficient cells exhibit poikilocytosis with numerous abnormal forms, including acanthocytes, schistocytes, and echinocytes with irregular surface protrusions. Panel H displays an osmotic resistance curve, where Prkab1-deficient erythrocytes demonstrate a left-ward shift, signifying increased osmotic resistance (delayed hemolysis) compared to wild-type controls. The inset confirms a lower NaCl percentage required for 50% hemolysis in deficient cells, indicating altered membrane stability.
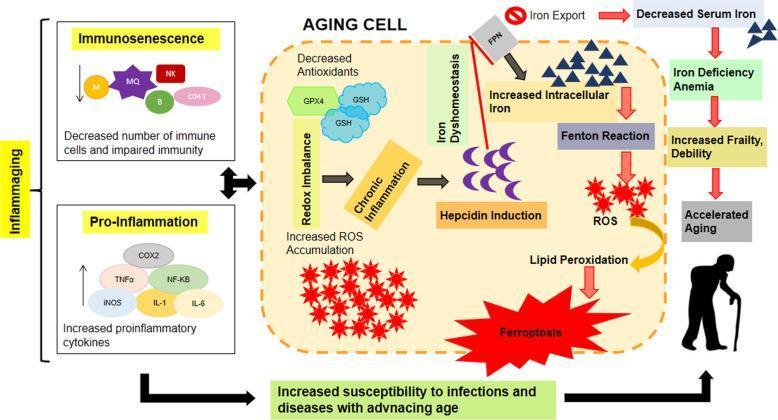
A pathophysiology diagram illustrating the 'Inflammaging' concept and its relationship with iron dyshomeostasis and ferroptosis in an aging cell. The diagram is divided into three functional areas: 1) Inflammaging (left), composed of Immunosenescence (reduced M, MQ, NK, B, and CD4+ T cells) and Pro-Inflammation (upregulation of TNF-α, IL-1, IL-6, COX2, iNOS, and NF-κB). 2) Intracellular Aging Cell environment (center), showing a redox imbalance characterized by decreased antioxidants (GPX4, GSH) and increased Reactive Oxygen Species (ROS) accumulation. This environment triggers Hepcidin induction, which inhibits iron export via Ferroportin (FPN). 3) Systematic Consequences (right), where increased intracellular iron facilitates the Fenton reaction and lipid peroxidation, leading to ferroptosis. This cycle results in decreased serum iron (iron deficiency anemia), increased frailty, debility, and accelerated aging. The diagram uses flow arrows to link cellular mechanisms to systemic clinical outcomes, highlighting the synergistic role of chronic inflammation and impaired iron metabolism in aging pathology.
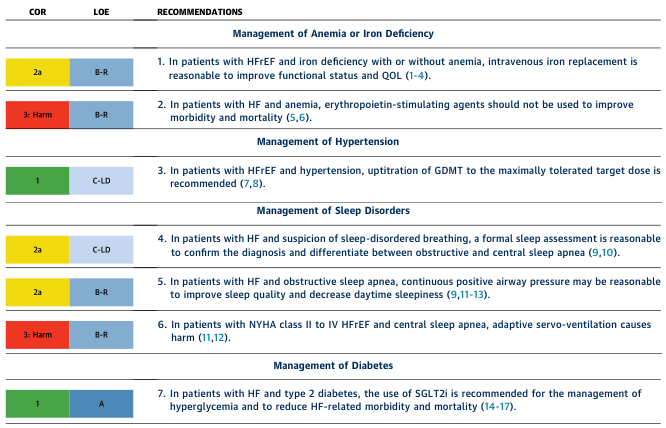
<table><thead><tr><th>COR</th><th>LOE</th><th>RECOMMENDATIONS</th></tr></thead><tbody><tr><td colspan="3">Management of Anemia or Iron Deficiency</td></tr><tr><td>2a</td><td>B-R</td><td>1. In patients with HFrEF and iron deficiency with or without anemia, intravenous iron replacement is reasonable to improve functional status and QOL (1-4).</td></tr><tr><td>3: Harm</td><td>B-R</td><td>2. In patients with HF and anemia, erythropoietin-stimulating agents should not be used to improve morbidity and mortality (5,6).</td></tr><tr><td colspan="3">Management of Hypertension</td></tr><tr><td>1</td><td>C-LD</td><td>3. In patients with HFrEF and hypertension, uptitration of GDMT to the maximally tolerated target dose is recommended (7,8).</td></tr><tr><td colspan="3">Management of Sleep Disorders</td></tr><tr><td>2a</td><td>C-LD</td><td>4. In patients with HF and suspicion of sleep-disordered breathing, a formal sleep assessment is reasonable to confirm the diagnosis and differentiate between obstructive and central sleep apnea (9,10).</td></tr><tr><td>2a</td><td>B-R</td><td>5. In patients with HF and obstructive sleep apnea, continuous positive airway pressure may be reasonable to improve sleep quality and decrease daytime sleepiness (9,11-13).</td></tr><tr><td>3: Harm</td><td>B-R</td><td>6. In patients with NYHA class II to IV HFrEF and central sleep apnea, adaptive servo-ventilation causes harm (11,12).</td></tr><tr><td colspan="3">Management of Diabetes</td></tr><tr><td>1</td><td>A</td><td>7. In patients with HF and type 2 diabetes, the use of SGLT2i is recommended for the management of hyperglycemia and to reduce HF-related morbidity and mortality (14-17).</td></tr></tbody></table>
Iron Deficiency Anemia & Nutritional Anemia
Overview
1. CAUSES / ETIOLOGY
1. Dietary Lack
- Most common cause in low-resource countries where dietary iron is predominantly inorganic (plant-based, poorly absorbed)
- At-risk groups in high-resource countries:
- Infants/toddlers - highest risk group; breast milk provides only ~0.3 mg/L iron; cow's milk has poor bioavailability and can cause occult GI bleeding
- Adolescent girls - rapid growth + menstrual losses
- Females of childbearing age - menstrual losses + increased demands in pregnancy
- The elderly - restricted diets with limited meat
- Poverty - suboptimal diet at any age
2. Impaired Absorption
- Celiac disease (duodenal villous atrophy - this is where iron is absorbed)
- Post-gastrectomy / bariatric surgery
- Achlorhydria (acid needed to keep iron in ferrous Fe²⁺ form)
- Helicobacter pylori infection (decreases absorption + microerosions)
- Inflammatory bowel disease
- Dietary inhibitors: tannins (tea), carbonates, oxalates, phosphates
- Dietary enhancers (when absent): ascorbic acid, citric acid, amino acids, sugars
3. Increased Requirements
- Pregnancy - increased demands (accounts for lower total body iron in young women: ~2.5 g vs ~3.5 g in males)
- Infancy and early childhood - rapid growth demands
- Prematurity - limited iron stores at birth
4. Chronic Blood Loss (most common cause in adults in high-resource countries)
- GI bleeding - peptic ulcer disease, colorectal carcinoma, polyps, angiodysplasia, hookworm infestation (major cause in tropical countries), NSAIDs-induced gastropathy
- Menorrhagia / gynecological causes
- Hematuria - renal or bladder lesions
- Repeated blood donations
- Occult blood loss - celiac-associated intestinal bleeding
Clinical Rule: In adult males and postmenopausal women, iron deficiency anemia = GI malignancy until proven otherwise, warranting colonoscopy.
2. IRON METABOLISM (Context for Pathogenesis)
| Iron Pool | Males (mg) | Females (mg) |
|---|---|---|
| Total | 3,450 | 2,450 |
| Hemoglobin | 2,100 | 1,750 |
| Myoglobin | 300 | 250 |
| Enzymes | 50 | 50 |
| Ferritin/Hemosiderin (storage) | 1,000 | 400 |
- Daily iron loss: 1-2 mg/day via shed mucosal and skin cells (no regulated excretion pathway)
- Dietary intake: 10-20 mg/day; ~20% of heme iron and only 1-2% of non-heme iron is absorbed
- Absorption regulated in the proximal duodenum via DMT-1 (apical uptake) and ferroportin (basolateral export)
- Hepcidin (hepatic peptide hormone): the master regulator - inhibits ferroportin, reducing both duodenal absorption and macrophage iron release. Falls in iron deficiency, rises in chronic inflammation (explaining anemia of chronic disease)
- Transferrin: transport protein; normally ~33% saturated; serum iron ~120 µg/dL (males), ~100 µg/dL (females); TIBC ~300-350 µg/dL
Stages of Iron Deficiency (Sequential Depletion)
| Stage | Description | Lab Change |
|---|---|---|
| Stage 1 - Storage depletion | Iron stores (ferritin/bone marrow) fall | ↓ Serum ferritin, absent marrow iron |
| Stage 2 - Transport depletion | Insufficient iron for erythropoiesis | ↓ Serum iron, ↑ TIBC, ↓ transferrin saturation, ↑ free erythrocyte protoporphyrin |
| Stage 3 - Frank IDA | Anemia with morphologic changes | ↓ Hb/Hct, microcytosis, hypochromia |
3. CLINICAL FEATURES
General Anemia Symptoms
- Pallor (conjunctival, palmar, nail bed, mucosal)
- Fatigue, weakness, lethargy
- Exertional dyspnea
- Palpitations, tachycardia
- Headache, dizziness, poor concentration
- Poor exercise tolerance
IDA-Specific Features (from iron-enzyme depletion in tissues)
- Koilonychia (spoon-shaped nails) - brittle, concave
- Angular stomatitis (cheilosis) - fissuring at corners of mouth
- Atrophic glossitis - smooth, sore tongue with loss of papillae
- Pica - craving for non-food substances (clay, soil) or unusual foods
- Pagophagia - craving for ice (highly specific for IDA)
- Alopecia - diffuse hair thinning
- Atrophic gastritis - reduced gastric acid
- Plummer-Vinson (Patterson-Kelly) Syndrome - triad of post-cricoid dysphagia, iron deficiency anemia, and atrophic glossitis (esophageal web)
- Blue sclerae
- CNS effects - restless legs syndrome, impaired cognitive development in children (critical concern in toddlers)
In Children (2-year-old)
- Irritability, decreased attention span
- Developmental delay / poor school performance
- Growth retardation
- Increased susceptibility to infections
- Pica is particularly prominent
- Pallor is often the most visible sign
4. LABORATORY WORKUP / INVESTIGATIONS
A. Complete Blood Count (CBC) + RBC Indices
| Parameter | IDA Finding | Normal |
|---|---|---|
| Hemoglobin | Decreased | M: 13.5-17.5 g/dL; F: 12-16 g/dL; Child 2yr: ~11.5 g/dL |
| Hematocrit (PCV) | Decreased | ~36-52% |
| MCV (Mean Corpuscular Volume) | Decreased (<80 fL) - MICROCYTIC | 80-100 fL |
| MCH (Mean Corpuscular Hemoglobin) | Decreased (<27 pg) - HYPOCHROMIC | 27-33 pg |
| MCHC (Mean Corpuscular Hgb Conc) | Decreased (<32 g/dL) | 32-36 g/dL |
| RDW (Red Cell Distribution Width) | Increased (>14.5%) - anisocytosis | 11.5-14.5% |
| Reticulocyte count | Normal or decreased (in uncomplicated IDA) | 0.5-1.5% |
| Platelet count | Often increased (reactive thrombocytosis, especially in bleeding-related IDA) | 150,000-400,000/µL |
| WBC | Usually normal | - |
B. Iron Studies (the diagnostic cornerstone)
| Test | IDA Result | Anemia of Chronic Inflammation | Normal |
|---|---|---|---|
| Serum iron | ↓ (<60 µg/dL) | ↓ | 60-170 µg/dL |
| TIBC (Total Iron Binding Capacity) | ↑ (>400 µg/dL) | ↓ or Normal | 250-370 µg/dL |
| Transferrin saturation | ↓ (<15%) | ↓ (<15%) | 20-50% |
| Serum ferritin | ↓ (<12 µg/L) - most sensitive/specific | ↑ or Normal (key differentiator!) | 12-300 ng/mL |
| Hepcidin | ↓ (falls as iron depletes) | ↑ | - |
Key distinguishing feature: In IDA, ferritin is LOW and TIBC is HIGH. In anemia of chronic disease, ferritin is NORMAL/HIGH and TIBC is LOW/NORMAL.
C. Peripheral Blood Smear Findings
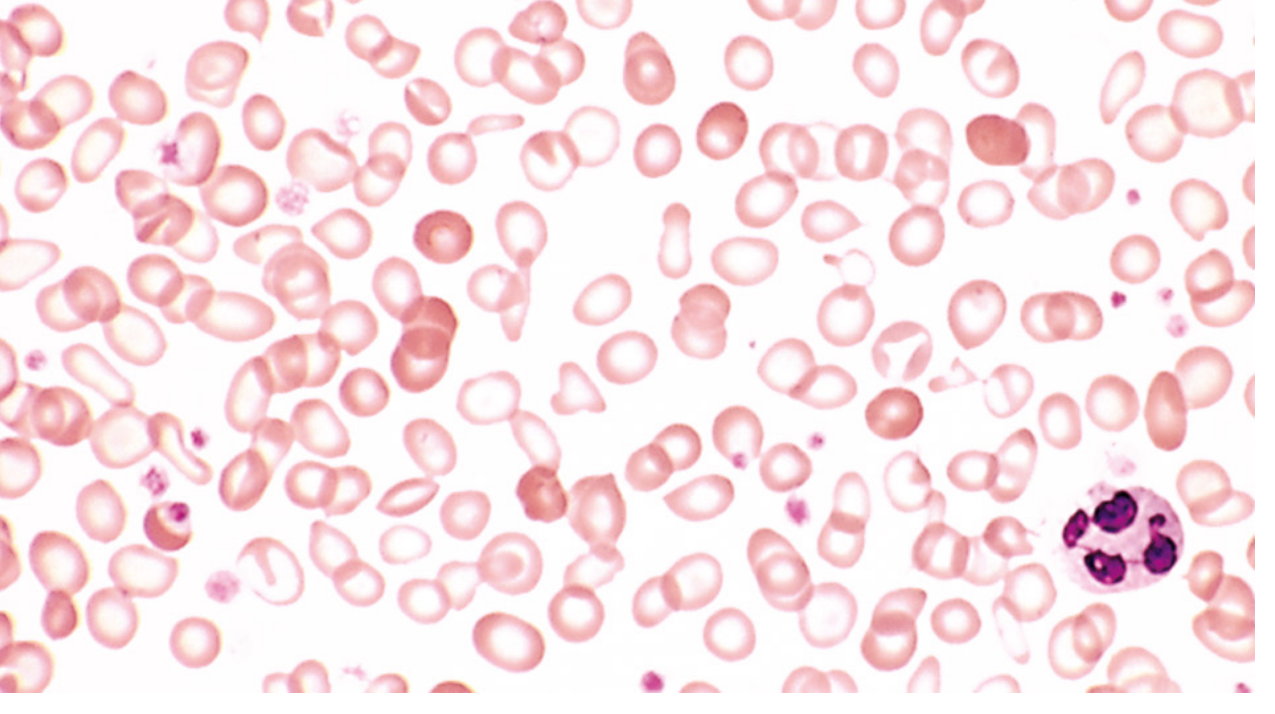
- Hypochromia - enlarged area of central pallor (>1/3 of cell diameter); cells appear "washed out"
- Microcytosis - small red cells (MCV <80 fL)
- Anisocytosis - variation in cell size (elevated RDW)
- Poikilocytosis - variation in cell shape
- Pencil cells (elliptocytes/cigar cells) - elongated hypochromic cells, characteristic of IDA
- Target cells - less common than in thalassemia but may be present
- Occasional fragments/schistocytes in severe cases
D. Additional / Confirmatory Tests
- Bone marrow iron stain (Prussian blue) - absent stainable iron is the gold standard for depleted stores, but invasive and rarely needed
- Free erythrocyte protoporphyrin (FEP) - elevated (iron unavailable for heme synthesis)
- Soluble transferrin receptor (sTfR) - elevated in IDA; useful when ferritin is unreliable (e.g., in concurrent inflammation)
- Reticulocyte hemoglobin content (CHr) - early indicator of iron-restricted erythropoiesis
- Hepcidin level - low in IDA
- Stool for occult blood (to identify GI blood loss source)
- Urinalysis
- In children: consider dietary history, growth charts
5. TREATMENT
A. Treat the Underlying Cause
- Stop ongoing blood loss (manage menorrhagia, treat H. pylori, investigate GI bleeding source)
- Improve dietary iron intake
- Treat malabsorption (e.g., gluten-free diet for celiac disease)
B. Oral Iron Therapy
| Formulation | Elemental Iron % |
|---|---|
| Ferrous gluconate | 12% |
| Ferrous fumarate | 33% |
| Ferrous sulfate, anhydrous (Slow-Fe) | 30% (extended-release) |
| Carbonyl iron | 100% (slower absorption, safer in OD) |
| Polysaccharide-iron complex | 100% |
Oral Iron Dosing in a 2-Year-Old Child
Iron deficiency anemia treatment: Child: 3-6 mg elemental iron/kg/day ÷ BID-TID orally
- Dose: 3-6 mg elemental Fe/kg/day × 12 kg = 36-72 mg elemental iron/day
- Divided into 2-3 doses
- Using ferrous sulfate drops (Fer-In-Sol: 15 mg elemental Fe/mL):
- ~2.5-5 mL/day divided (e.g., 1.2-2.5 mL twice daily)
- Continue treatment for 3 months after Hb normalizes to replenish stores
- Reticulocytosis appears in 5-7 days (earliest marker of response)
- Hb should rise ~1-2 g/dL per week; normalization in 4-8 weeks
- Iron stores take 2-3 additional months to replenish after Hb normalization
- Give on empty stomach (or 1 hour before meals) for best absorption
- If GI side effects occur (nausea, constipation, dark stools), give with small amount of food
- Co-administer with vitamin C (ascorbic acid) to enhance absorption
- Avoid giving with milk, antacids, tetracyclines (reduce absorption)
- Iron and tetracycline inhibit each other's absorption
- Premature infant: 2 mg elemental Fe/kg/day (max 15 mg/day)
- Full-term infant: 1-2 mg elemental Fe/kg/day (max 15 mg/day)
- Child 2-12 years: 2 mg elemental Fe/kg/day (max 30 mg/day)
C. Parenteral Iron
- Inability to tolerate oral iron (severe GI side effects)
- Malabsorption (post-gastrectomy, active IBD, celiac unresponsive to GFD)
- Non-compliance with oral therapy
- Need for rapid replenishment (e.g., pre-surgery)
- Chronic kidney disease on erythropoietin therapy
- IV iron dextran requires a test dose (risk of anaphylaxis)
- Newer agents (ferric carboxymaltose, ferumoxytol) have better safety profiles
D. Blood Transfusion
- Reserved for severe symptomatic anemia (Hb <7 g/dL) with cardiovascular compromise
- Not routinely used for iron deficiency alone
E. Dietary Counseling
- Increase heme iron sources: red meat, poultry, fish
- Include vitamin C-rich foods with iron-rich meals
- Avoid tea/coffee with meals
- In toddlers: limit cow's milk to <500 mL/day (displaces iron-rich foods and may cause occult GI bleeding)
Summary Table: Key Lab Findings
| Test | IDA | Thalassemia Trait | Anemia of Chronic Disease | Sideroblastic Anemia |
|---|---|---|---|---|
| MCV | ↓↓ | ↓↓↓ (very low) | Normal or ↓ | ↓ or normal |
| RDW | ↑ | Normal | Normal | ↑ |
| Serum Iron | ↓ | Normal | ↓ | ↑ |
| Ferritin | ↓ | Normal | ↑ | ↑ |
| TIBC | ↑ | Normal | ↓ | ↓ |
| Transferrin Sat. | ↓ (<15%) | Normal | ↓ | ↑ |
| Marrow iron | Absent | Normal | Increased | Ring sideroblasts |