
Explain simple English endocrine disorders . 1. Definition 2. Pathophysiology (step-by-step →) 3. Risk Factors 4. Signs & Symptoms 5. Complications 6. Disease pattern in 7. Medical Management 8. Nursing Diagnosis (Top 3) 9. Nursing Interventions
Which endocrine disorder(s) would you like explained? (You can select multiple)
diabetes mellitus pathophysiology diagram insulin
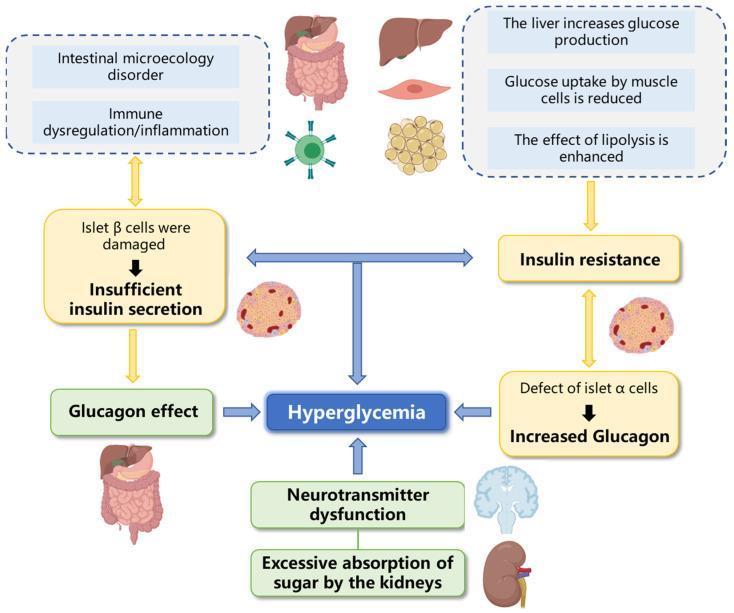
A pathophysiology diagram illustrating the multi-factorial mechanisms leading to hyperglycemia, particularly in the context of Type 2 Diabetes Mellitus. The diagram features a central blue box labeled 'Hyperglycemia' with various upstream contributing pathways. On the left, a pathway originates from 'Intestinal microecology disorder' and 'Immune dysregulation/inflammation,' leading to damage of pancreatic islet β-cells and subsequent 'Insufficient insulin secretion.' On the right, a multi-organ pathway involving the liver (increased glucose production), muscle (reduced glucose uptake), and adipose tissue (enhanced lipolysis) leads to 'Insulin resistance.' Additionally, a 'Defect of islet α-cells' is shown resulting in 'Increased Glucagon.' The bottom of the diagram includes 'Neurotransmitter dysfunction' (represented by a brain icon) and 'Excessive absorption of sugar by the kidneys' (represented by a kidney icon) as further contributing factors. Arrows indicate the flow of physiological dysfunctions that converge to elevate blood glucose levels. The diagram is designed as an educational tool for understanding the metabolic and endocrine drivers of diabetes.
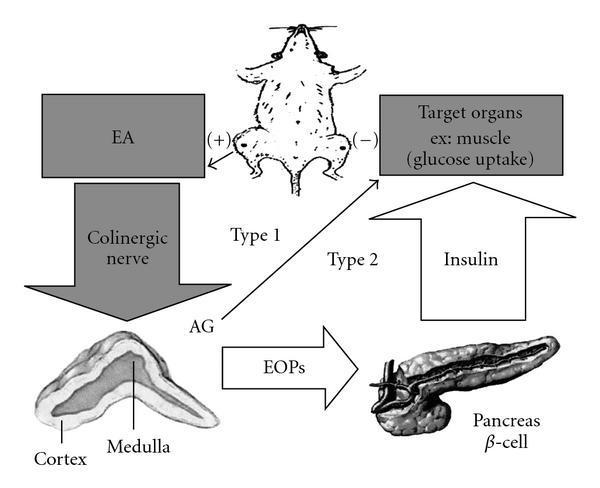
This pathophysiology diagram illustrates the hypothetical mechanism for the hypoglycemic effect of Electroacupuncture (EA) in different types of Diabetes Mellitus (DM), utilizing a rat model for preclinical context. The central pathway shows EA (applied at ST-36 acupoints) stimulating the cholinergic nerve, which targets the adrenal gland (AG), specifically highlighting the cortex and medulla. In Type 1 (insulin-dependent) DM, a direct signaling pathway from the adrenal gland to target organs (e.g., muscle) facilitates glucose uptake. In Type 2 (non-insulin-dependent) DM, the adrenal gland triggers the release of endogenous opioid peptides (EOPs), which stimulate the pancreas ̠-cells to secrete insulin, subsequently enhancing glucose uptake in target organs. The diagram serves to differentiate between insulin-dependent and insulin-independent mechanisms of EA, highlighting the roles of the parasympathetic nervous system, the adrenal-pancreatic axis, and metabolic signaling in glucose regulation. Key anatomical structures depicted include the adrenal gland, pancreas, and representative target musculature.
thyroid disorders hypothyroidism hyperthyroidism

Addison disease hyperpigmentation adrenal insufficiency
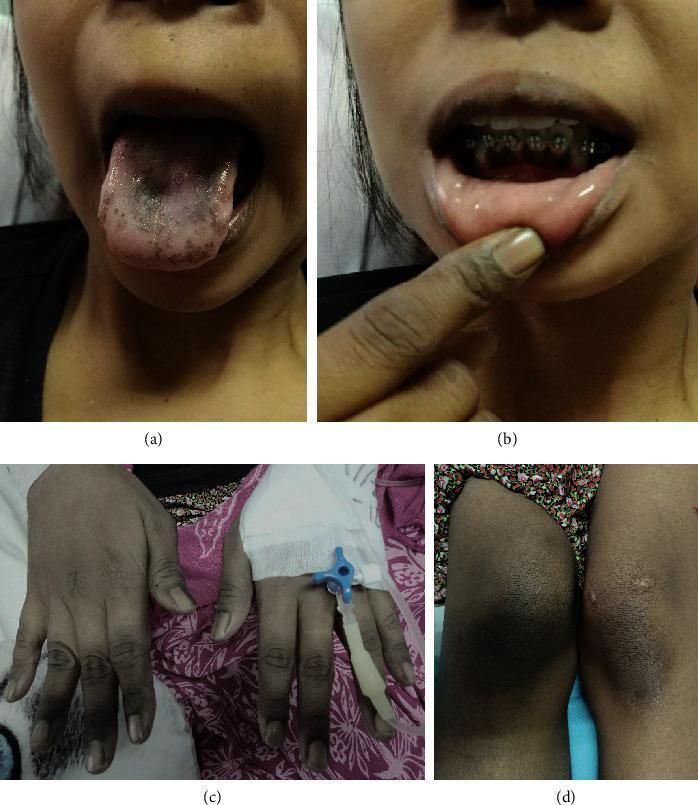
This set of clinical photographs illustrates the hallmark signs of primary adrenal insufficiency (Addison's disease), characterized by generalized mucocutaneous hyperpigmentation. Panel (a) shows significant hyperpigmentation of the tongue, presenting as dark, irregular macules and diffuse speckling primarily on the dorsal surface, accompanied by a faint whitish plaque. Panel (b) depicts mucosal hyperpigmentation of the gingiva and inner lip. Panel (c) demonstrates diffuse hyperpigmentation of the hands, with notable darkening over the extensor surfaces of the interphalangeal joints (knuckle hyperpigmentation), while the nail beds appear spared. Panel (d) shows similar localized hyperpigmentation over the knees. These visual findings result from increased levels of adrenocorticotropic hormone (ACTH) and its precursor, pro-opiomelanocortin, which stimulate melanocytes via alpha-melanocyte-stimulating hormone receptors. This presentation is essential for the clinical diagnosis of chronic adrenal cortical failure and differentiates primary from secondary adrenal insufficiency.
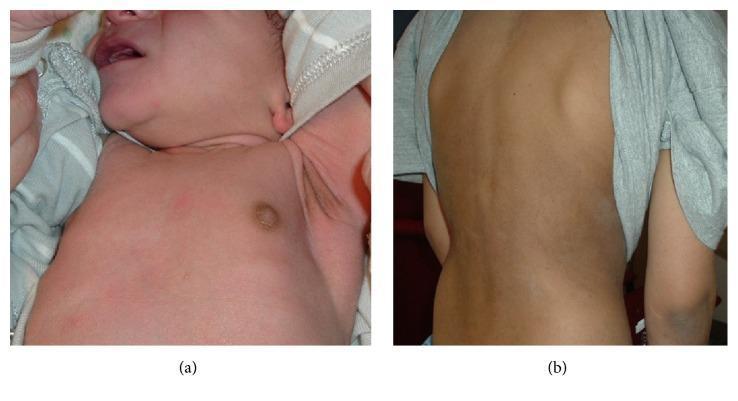
Two-panel clinical photograph demonstrating cutaneous hyperpigmentation associated with pediatric adrenal insufficiency. Panel (a) shows the anterior chest and axilla of a 10-day-old male infant. Notable findings include marked hyperpigmentation of the nipple and areola, as well as the axillary vault, contrasting with the lighter surrounding skin. This presentation is characteristic of salt-wasting congenital adrenal hyperplasia (CAH) due to 21-hydroxylase deficiency. Panel (b) displays the posterior torso of a 9-year-old male with Addison's disease, showing diffuse, generalized bronzing of the skin with subtle mottling. Pathophysiologically, these skin changes result from elevated levels of adrenocorticotropic hormone (ACTH) and melanocyte-stimulating hormone (MSH) due to lack of cortisol negative feedback. The images highlight key diagnostic dermatologic signs of primary adrenal insufficiency in different pediatric age groups, emphasizing the importance of examining skin creases and pigmented areas for early clinical recognition of endocrinological disorders.