
heart sounds
heart sounds S1 S2 S3 S4 cardiac auscultation diagram
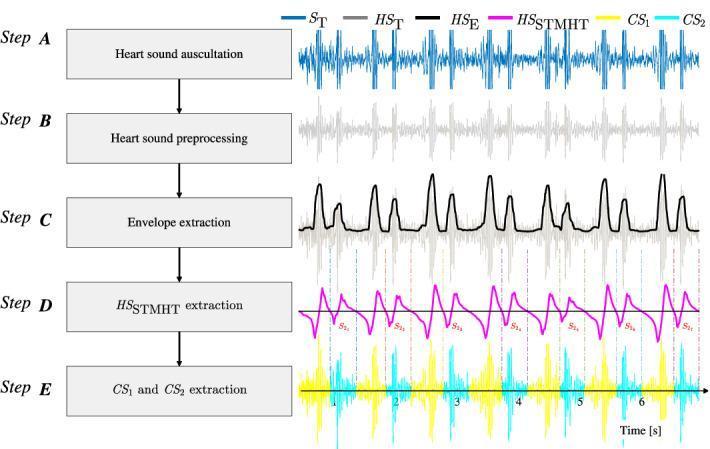
This flowchart illustrates the signal processing methodology for the automated segmentation and extraction of heart sound components, specifically the first (S1) and second (S2) heart sounds, denoted as CS1 and CS2. The process is divided into five sequential stages (Step A through Step E): 1. Step A (Heart Sound Auscultation): Shows the raw digital phonocardiogram signal (ST) as a blue oscillatory waveform. 2. Step B (Heart Sound Preprocessing): Displays a filtered and normalized version of the signal (HST) in gray, reducing noise and baseline drift. 3. Step C (Envelope Extraction): Features a black waveform representing the extracted Viola integral-based envelope (HSE) that traces the signal peaks. 4. Step D (HS STMHT Extraction): Shows a magenta waveform (HS_STMHT) using the Short-Time Modified Hilbert Transform, with marked negative-to-positive points used to identify S1 and S2 centroids. 5. Step E (CS1 and CS2 Extraction): Demonstrates the final segmented cardiac cycle components, with CS1 segments in yellow and CS2 segments in cyan, separated by vertical hashed lines. This educational diagram represents an advanced diagnostic algorithm for cardiovascular signal processing, aimed at enhancing automated cardiac auscultation.
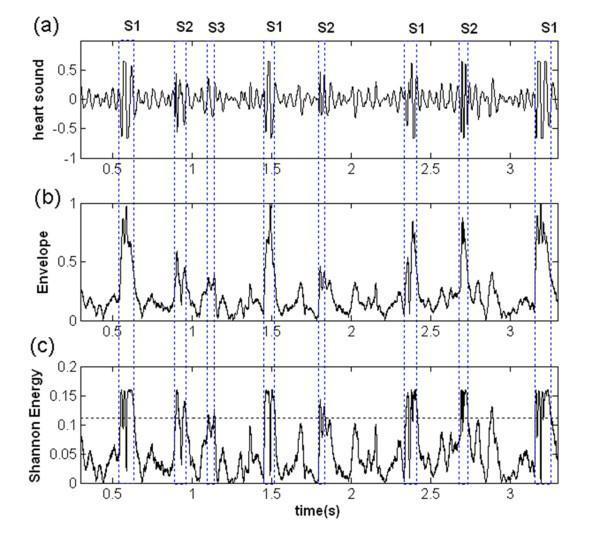
A comparison chart consisting of three vertically aligned signal processing plots (a, b, and c) derived from a human heart sound record (phonocardiogram) over a duration of approximately 3.5 seconds. Panel (a) displays the raw heart sound waveform showing characteristic periodic high-amplitude oscillations corresponding to the first (S1) and second (S2) heart sounds, with a labeled third heart sound (S3) visible in the early diastolic period following the first S2. Panel (b) illustrates the envelope of the signal, which traces the magnitude peaks of the cardiac cycle, smoothing the high-frequency oscillations into distinct pulses. Panel (c) shows the Shannon energy of the signal, a non-linear transformation used to emphasize low-amplitude components like S3 and S4. A horizontal dashed line in panel (c) represents a threshold level for signal detection and segmentation. Vertical blue dashed lines across all three panels correlate the temporal alignment of S1, S2, and S3 peaks. This visual is used to demonstrate diagnostic algorithms for heart sound segmentation and the identification of abnormal clinical signs.
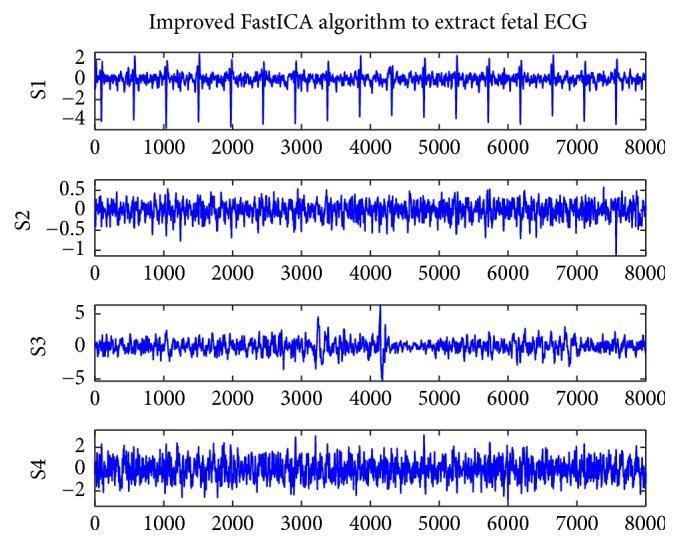
This diagnostic visualization displays four signal waveforms (labeled S1 through S4) generated by an improved FastICA algorithm for the extraction of fetal electrocardiogram (ECG) data from maternal abdominal recordings. Each plot represents a different signal component after maternal ECG cancellation. The S1 signal demonstrates a clear fetal ECG pattern characterized by sharp, negative-amplitude R-wave deflections occurring at a regular heart rate; these spikes reach approximately -4 units against a stable baseline. In contrast, signals S2, S3, and S4 represent residual noise or non-target components with varying amplitudes and frequencies but lack the distinct, periodic fetal cardiac complexes seen in S1. S2 shows low-amplitude fluctuations between -1 and 0.5, S3 displays higher-amplitude non-periodic spikes between -5 and 5, and S4 exhibits dense baseline noise between -2 and 2. The image illustrates the clinical application of signal processing in fetal monitoring to isolate high-quality fetal cardiac data from complex physiological noise.
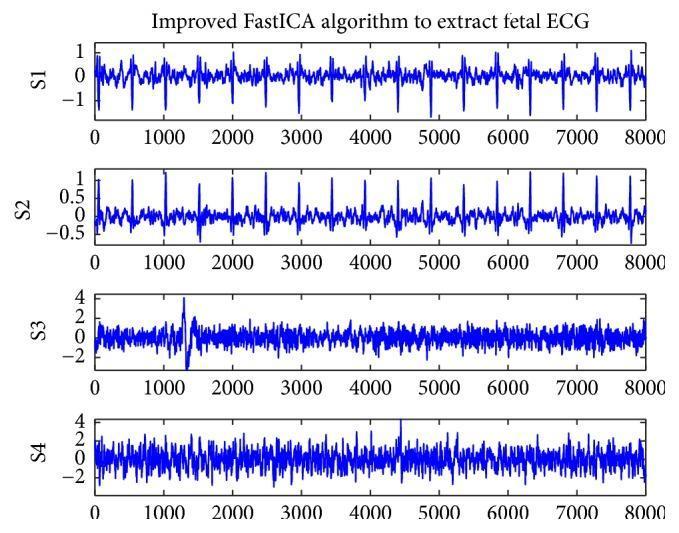
This diagnostic visualization displays four stacked signal tracings (S1, S2, S3, and S4) representing the extraction of fetal electrocardiogram (fECG) signals using an improved FastICA algorithm. The signals are plotted against a time-domain horizontal axis (0 to 8000 samples). S1 and S2 demonstrate periodic waveforms characteristic of ECG complexes, featuring distinct and recurring sharp upward deflections that correspond to R-waves. S1 shows higher amplitude and clearer R-wave morphology compared to S2, indicating a cleaner extraction of the fetal heart rate signal from maternal abdominal interference. In contrast, S3 and S4 exhibit irregular, high-frequency fluctuations and lack discernible periodic patterns, representing residual noise and non-cardiac signal components. This comparison is used in medical engineering and cardiology to demonstrate the efficacy of blind source separation algorithms in isolating fetal cardiac activity from mixed maternal abdominal recordings, which is critical for non-invasive fetal monitoring.
cardiac auscultation areas mitral tricuspid aortic pulmonic valve locations chest
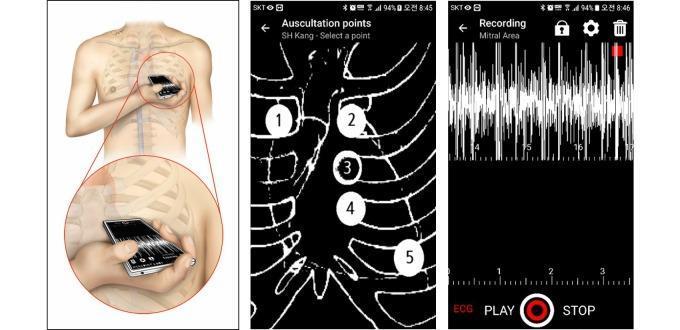
This composite educational graphic illustrates a digital health methodology for heart sound recording using a dedicated smartphone application (CPstethoscope). The image is divided into three sections: Left: An anatomical illustration shows a user positioning a smartphone directly against the chest wall at an intercostal space for auscultation without peripheral devices. Middle: A user interface (UI) screenshot displays the 'Auscultation points' selection screen, featuring a schematic of the rib cage and sternum with five numbered circles (1-5) indicating standard cardiac auscultation areas (aortic, pulmonic, Erb's point, tricuspid, and mitral). Right: A screenshot of the active recording interface shows a high-frequency phonocardiogram waveform in white against a dark background, a horizontal time scale (seconds), and a red recording indicator. Interactive controls include 'ECG', 'PLAY', and 'STOP' buttons. The diagram serves as a technical overview of smartphone-based cardiac monitoring and the graphical representation of clinical examination protocols for medical students and digital health researchers.
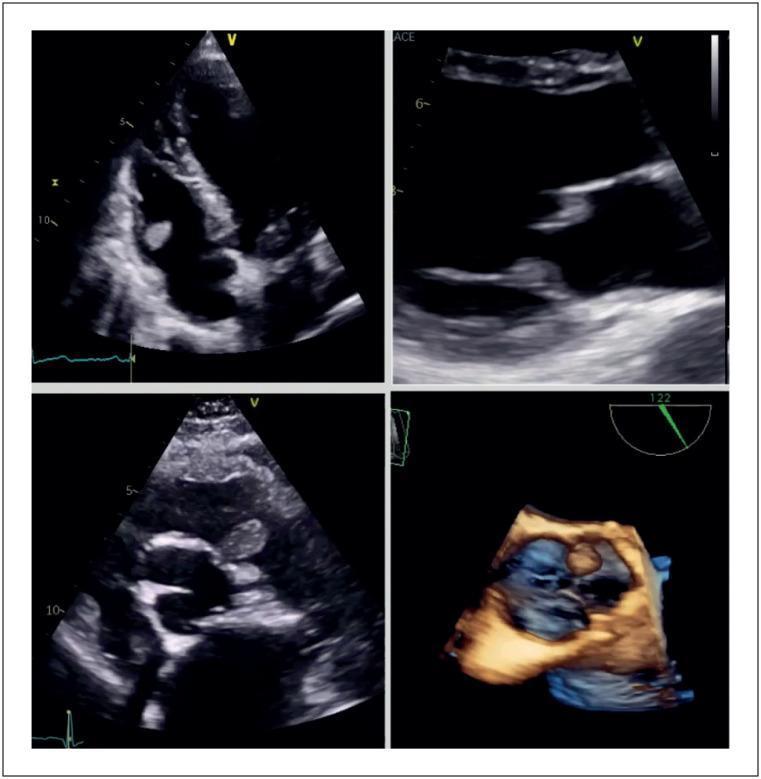
This composite diagnostic image features four echocardiographic views (three 2D grayscale transthoracic images and one 3D color-rendered reconstruction) demonstrating papillary fibroelastomas on all four cardiac valves. The images highlight these benign primary cardiac tumors as small, pedicled, and highly mobile masses attached to the valvular endocardium. Clockwise from top-left, the masses are located on the tricuspid valve anterior leaflet, the mitral valve anterior leaflet, the aortic valve left cusp (3D view), and the pulmonic valve left cusp. Key sonographic features include a speckled internal echogenicity with focal areas of echolucency and a characteristic filamentous or stippled surface appearance at the margins. The 3D reconstruction provides enhanced spatial orientation and surface morphology of the fibroelastoma on the aortic valve. These findings are clinically relevant for distinguishing benign tumors from vegetations or thrombi, particularly given their potential for embolic complications.
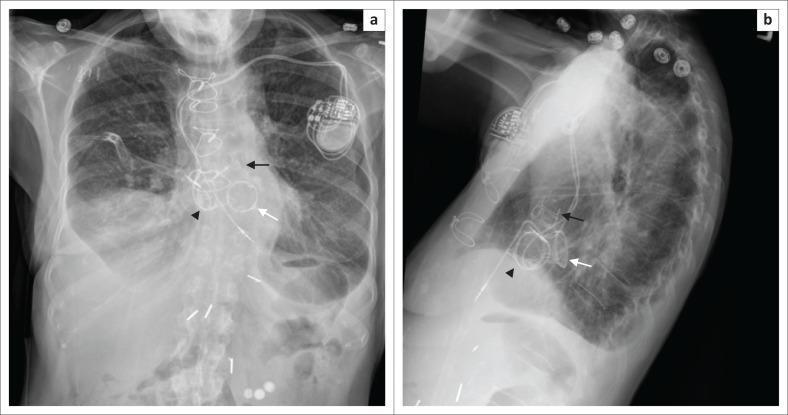
Frontal (a) and lateral (b) chest radiographs of a 72-year-old female demonstrating multiple prosthetic heart valves and a cardiac implantable electronic device (CIED). Three circular, radio-opaque prosthetic valves are visible within the cardiac silhouette: the aortic valve (superior, black arrow), the mitral valve (intermediate, white arrow), and the tricuspid valve (inferior, arrowhead). In the lateral view, the aortic valve is positioned most anteriorly, while the tricuspid valve occupies the most inferior position. A pulse generator is located in the subcutaneous tissue of the left upper chest (prepectoral region) with associated radio-opaque leads coursing through the superior vena cava into the cardiac chambers, consistent with a permanent pacemaker or ICD for managing complete heart block. Median sternotomy wires are also present, indicating prior open-heart surgery. These images illustrate the radiological landmarks and spatial orientation used to differentiate valvular prostheses and cardiac rhythm management hardware.
S3 S4 gallop heart sound diastole pathological third fourth
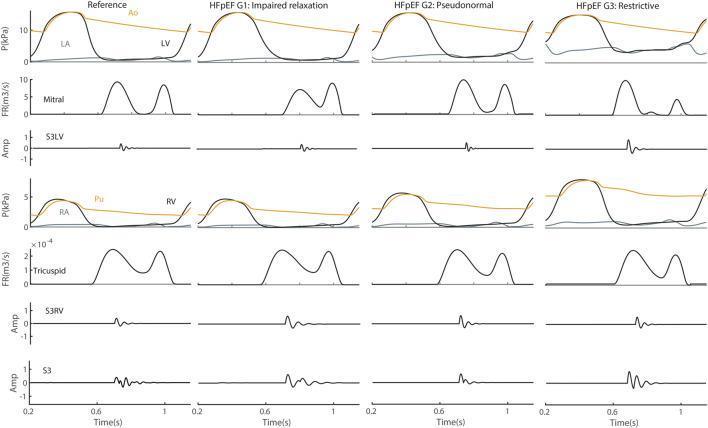
This physiological diagram displays simulated hemodynamic and acoustic waveforms across four stages of cardiac function: Reference, and Heart Failure with Preserved Ejection Fraction (HFpEF) Grade 1 (Impaired Relaxation), Grade 2 (Pseudonormal), and Grade 3 (Restrictive). The panels are organized into columns by disease severity and rows by measurement type, including pressure (P) in the left heart (Ao, LV, LA) and right heart (Pu, RV, RA), flow rate (FR) across mitral and tricuspid valves, and vibration amplitude (Amp) for the left ventricular third heart sound (S3LV), right ventricular S3 (S3RV), and the combined S3 signal. Key educational features include the progressive changes in mitral inflow patterns (transitioning from a normal E/A ratio in Reference to a dominant E-wave and diminished A-wave in Grade 3) and the corresponding increase in S3LV amplitude as diastolic dysfunction worsens. The diagram illustrates the pathophysiology of HFpEF, highlighting how impaired relaxation and increasing ventricular stiffness correlate with the appearance and intensity of the pathological third heart sound (S3 gallop).
A comparison chart consisting of three vertically aligned signal processing plots (a, b, and c) derived from a human heart sound record (phonocardiogram) over a duration of approximately 3.5 seconds. Panel (a) displays the raw heart sound waveform showing characteristic periodic high-amplitude oscillations corresponding to the first (S1) and second (S2) heart sounds, with a labeled third heart sound (S3) visible in the early diastolic period following the first S2. Panel (b) illustrates the envelope of the signal, which traces the magnitude peaks of the cardiac cycle, smoothing the high-frequency oscillations into distinct pulses. Panel (c) shows the Shannon energy of the signal, a non-linear transformation used to emphasize low-amplitude components like S3 and S4. A horizontal dashed line in panel (c) represents a threshold level for signal detection and segmentation. Vertical blue dashed lines across all three panels correlate the temporal alignment of S1, S2, and S3 peaks. This visual is used to demonstrate diagnostic algorithms for heart sound segmentation and the identification of abnormal clinical signs.
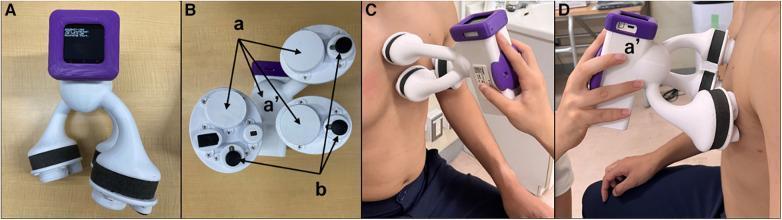
This composite clinical image displays the BMP-LD3, a specialized handheld medical device designed for simultaneous multi-point heart sound (HS) recording and ECG monitoring. Panel A shows the front view, featuring a central housing unit with a digital display screen and three 'tri-antler' chest pieces. Panel B illustrates the posterior surface, identifying three internal microphones (a) located within the antlers for auscultation and three electric terminals (b) for recording electrocardiographic signals. A fourth microphone (a') is integrated into the housing for ambient noise cancellation. Panels C and D demonstrate clinical application on a patient's anterior chest wall. The device is positioned such that two chest pieces are aligned along the left sternal border at approximately the second intercostal space (heart base) and the fourth intercostal space, while the third chest piece is placed over the cardiac apex. This specialized configuration allows for the integrated capture of phonocardiographic and ECG data across key precordial landmarks to facilitate advanced cardiac analysis, such as identifying S1-S4 heart sounds and detecting heart failure indicators.
Heart Sounds
Overview
S1 - First Heart Sound ("lub")
- Cause: Closure of the mitral (bicuspid) and tricuspid valves at the onset of ventricular systole
- Mechanism: Ventricular contraction causes blood to surge back against the AV valves, snapping them shut. The chordae tendineae abruptly stop their backward bulge, causing the taut valves, blood, and ventricular walls to vibrate. These vibrations travel through tissues to the chest wall.
- Duration: ~0.14 seconds
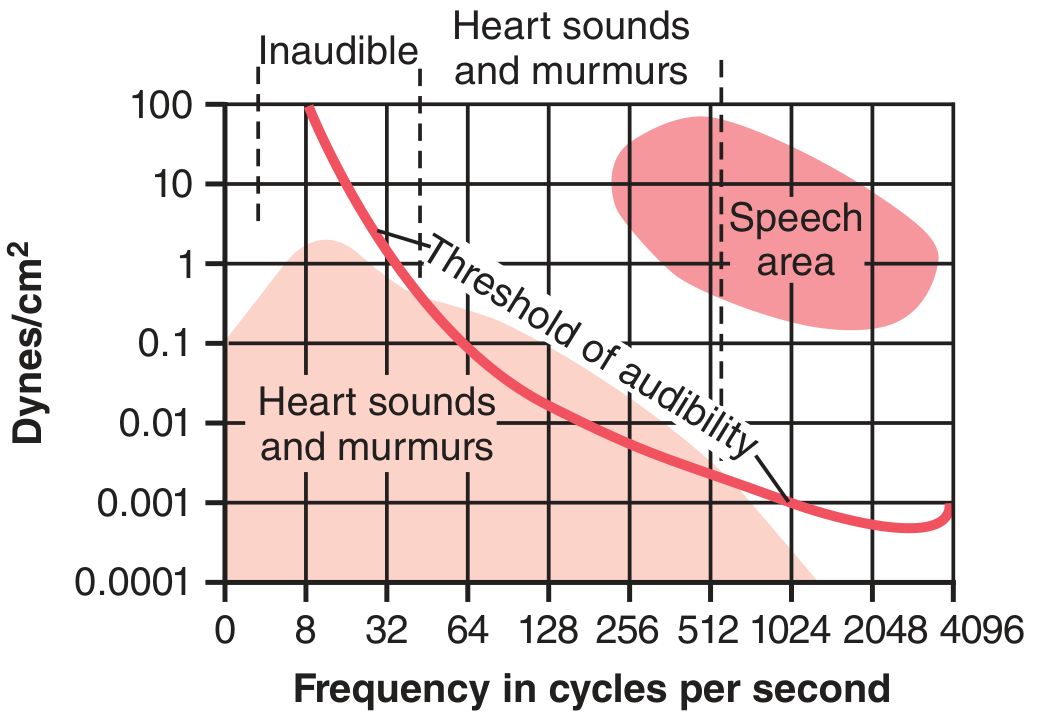
- Frequency: ~40-500 Hz (audible range); much of the energy is actually below 40 Hz (inaudible, but recordable on phonocardiogram)
- Best heard: Apex (mitral area) and left lower sternal border (tricuspid area)
- Marks: Beginning of systole
S2 - Second Heart Sound ("dub")
- Cause: Closure of the aortic and pulmonary (semilunar) valves at the end of systole
- Mechanism: When the semilunar valves close, they bulge back toward the ventricles, and elastic recoil bounces blood back into the arteries, creating reverberations between arterial walls and the closed valves.
- Duration: ~0.11 seconds (shorter than S1 because the semilunar valves are tauter and vibrate for less time)
- Frequency: Higher pitch than S1, due to the tautness of the semilunar valves and the greater elastic coefficient of arterial walls
- Best heard: Left upper sternal border (aortic area: 2nd ICS right; pulmonic area: 2nd ICS left)
- Marks: End of systole / beginning of diastole
Physiologic splitting of S2: During inspiration, increased venous return delays pulmonary valve closure relative to aortic closure, causing A2 before P2 to be audible as two separate sounds. This is normal.
S3 - Third Heart Sound
- Cause: Rapid ventricular filling in early-to-mid diastole, as blood rushes from atria into partially filled ventricles
- Mechanism: Oscillation of blood back and forth between ventricular walls during rapid inflow phase; analogous to water flowing into a paper bag. Does not occur in early diastole because ventricles aren't yet filled enough to have elastic tension.
- Frequency: Very low (~20-40 Hz), often below the threshold of hearing - recorded more easily on a phonocardiogram than heard
- Best heard: Apex or left lower sternal border, with patient in left lateral decubitus
- Clinical significance:
- Normal in children, adolescents, and young adults (physiologic S3)
- Pathologic in older adults - indicates systolic heart failure (dilated, volume-overloaded ventricle); also heard in large VSD, CHF
S4 - Fourth Heart Sound (Atrial Sound)
- Cause: Atrial contraction (late diastole) forcing blood into a non-compliant ventricle
- Mechanism: Inrush of blood into the ventricle during atrial systole causes low-frequency vibrations similar to S3
- Frequency: Very low (~20 Hz), rarely heard with a stethoscope - mostly recordable
- Best heard: Apex
- Clinical significance: Indicates decreased ventricular compliance (stiff ventricle). Common with:
- Left ventricular hypertrophy (e.g., hypertension, aortic stenosis)
- Hypertrophic cardiomyopathy
- Acute MI
- S4 is always pathologic (per Harriet Lane Handbook)
Auscultation Areas
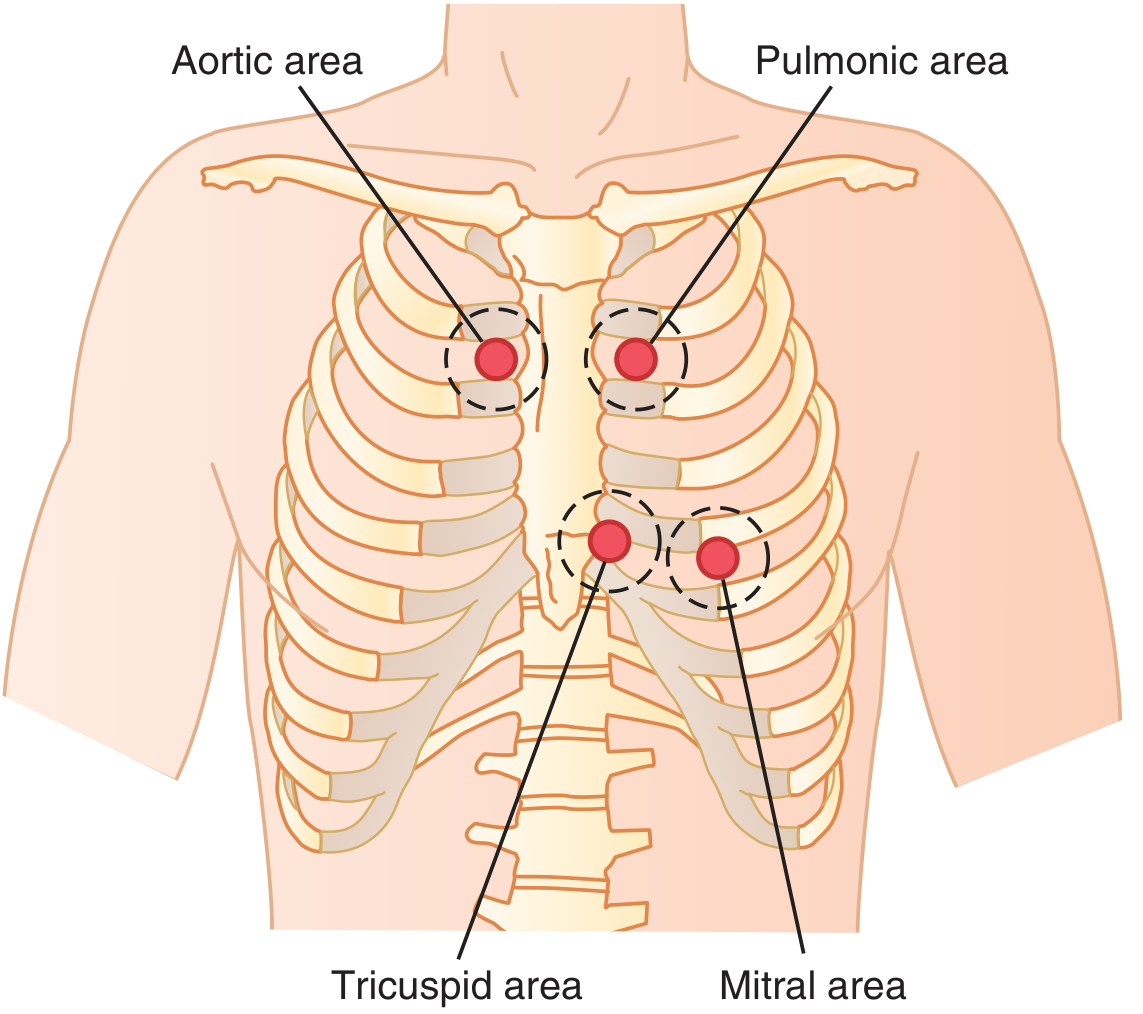
| Area | Location | Valve best heard |
|---|---|---|
| Aortic | 2nd ICS, right sternal border | Aortic valve |
| Pulmonic | 2nd ICS, left sternal border | Pulmonary valve |
| Tricuspid | 4th-5th ICS, left sternal border (over RV) | Tricuspid valve |
| Mitral (Apex) | 5th ICS, midclavicular line (apex of LV) | Mitral valve |
Frequency and Audibility
Phonocardiogram Patterns
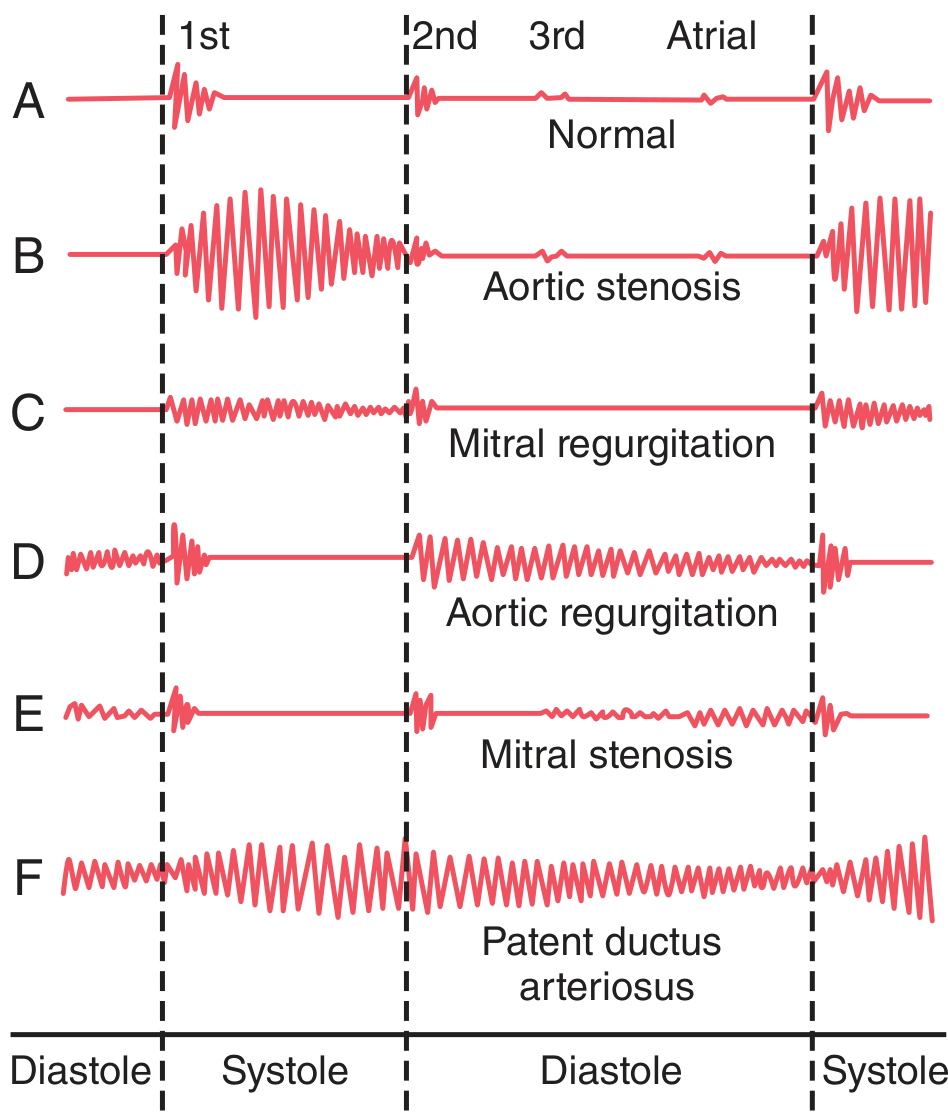
- A - Normal: Clean S1 and S2, faint S3 and atrial sound
- B - Aortic stenosis: Loud systolic murmur between S1 and S2 (crescendo-decrescendo)
- C - Mitral regurgitation: Holosystolic murmur from S1 to S2
- D - Aortic regurgitation: Diastolic murmur after S2
- E - Mitral stenosis: Diastolic murmur after S2 (mid-diastolic rumble)
- F - Patent ductus arteriosus: Continuous "machinery" murmur spanning both systole and diastole
Abnormal S2 Splitting (Clinical Summary)
| Pattern | Examples |
|---|---|
| Wide split S2 | Ebstein anomaly, RBBB |
| Wide + fixed split S2 | ASD, partial anomalous pulmonary venous return, PS |
| Narrow split S2 | Pulmonary hypertension, aortic stenosis, LBBB |
| Single S2 | Pulmonary hypertension, pulmonary atresia, severe AS, TGA |
| Paradoxical (reversed) split | Severe AS, LBBB, WPW type B |
| Loud P2 | Pulmonary hypertension |
Extra Sounds
| Sound | Timing | Association |
|---|---|---|
| Ejection click | Early systole | Semilunar valve stenosis, dilated great arteries, pulmonary HTN |
| Midsystolic click | Mid-systole | Mitral valve prolapse (at apex) |
| Opening snap | Early diastole (after S2) | Mitral/tricuspid stenosis; rare in children |