
Pumping & priming effect of vaporisers & modifications to prevent it .Physics & laws applied to anaesthesia delivery systems. Uptake & distribution of volatile anaesthesia
uptake distribution volatile anaesthetic FA/FI ratio Eger factors affecting alveolar concentration anaesthesia physics
FA FI ratio volatile anaesthetic uptake graph inhalation induction curve
This composite diagnostic image illustrates a first-in-human 18F-pretomanid Positron Emission Tomography (PET) study. Panel A shows a coronal CT scan of the head, neck, and upper torso for anatomical reference. Panel B is a time-activity curve graph plotting 18F-pretomanid PET uptake (%ID/g) against time (0-200 minutes) for three compartments: plasma (blue), brain (red), and lungs (green). The graph demonstrates higher initial brain uptake with a slower clearance rate compared to the rapid decline in plasma. Panel C displays Area Under the Curve (AUC) heatmaps for the brain and lungs, overlaid on anatomical sections. The heatmaps use a rainbow color scale (blue-to-red) to indicate radiotracer distribution, showing heterogeneous uptake in lung tissue and specific distribution patterns in the brain parenchyma. Panel D provides a quantitative comparison of the tissue-to-plasma AUC ratios (4-200 min), indicating a brain-to-plasma ratio of 2.39 and a lung-to-plasma ratio of 1.09. This figure demonstrates the pharmacokinetic profile and biodistribution of 18F-pretomanid, a radiolabeled antitubercular agent, particularly highlighting its penetration into the central nervous system and pulmonary system.
This monochrome clinical photograph demonstrates a specific technique for inhalation anesthesia induction, referred to as the 'snorkel breathing technique.' The image shows a patient in a supine position, holding a modified anesthetic breathing circuit directly between their lips. The apparatus consists of a clear mouthpiece interface connected to a Y-piece or T-shaped connector, which features a capped sampling port. This is attached to flexible, white corrugated tubing leading to a Heat and Moisture Exchanger (HME) filter or similar cylindrical circuit component, labeled with directional flow indicators ('Pt'). The patient’s facial features, including the nose and mouth, are visible, illustrating the oral interface that bypasses the traditional full-face mask. A gloved hand of a clinician is visible, stabilizing the circuit near the patient's face. This setup is utilized in anesthesia for patients with specific phobias or preferences, allowing for the delivery of volatile anesthetic agents like sevoflurane through controlled oral breathing during the induction phase.
This composite educational graphic details the kinetics and visualization of gadoxetate disodium enhancement in metastatic castration-resistant prostate cancer (mCRPC). Panel A is a line graph showing the mean Contrast Enhancement Ratio (CER) over a 60-minute timeline. The curve demonstrates a rapid rise from pre-contrast levels to a peak at 10 minutes, followed by a decline at 20 minutes, then a sustained plateau phase through 60 minutes, indicating contrast retention in metastatic lesions. Panel B features a side-by-side comparison of axial T1-weighted MRI scans of the pelvis. Image (a) shows the pre-contrast baseline with a dark, hypointense lesion in the left ilium (white arrow). Image (b) shows the same lesion 60 minutes post-injection, now appearing hyperintense (brighter) due to delayed gadoxetate disodium uptake. The material illustrates the potential for hepatobiliary contrast agents to evaluate extrahepatic mCRPC lesions, likely mediated by OATP1B3 expression.
Pumping & Priming Effect of Vaporisers, Physics of Anaesthesia Delivery, and Uptake & Distribution of Volatile Anaesthetics
PART 1: PUMPING AND PRIMING EFFECT OF VAPORISERS
Definition and Mechanism
- Positive-pressure (IPPV) ventilation
- Use of the oxygen flush valve
- Antegrade through the normal outlet
- Retrograde back through the vaporizing chamber inlet into the bypass chamber
Factors That Worsen the Pumping Effect
| Factor | Effect |
|---|---|
| Low fresh gas flow rates | Worse effect |
| Low dial concentration setting | Worse |
| Low level of liquid anaesthetic in chamber | Worse |
| Rapid respiratory rate | Worse |
| High peak inspiratory pressure | Worse |
| Rapid pressure decrease during expiration | Worse |
The Priming Effect
Modifications to Prevent the Pumping Effect
1. Smaller Vaporizing Chamber Volume
2. Long Spiral / Serpentine / Labyrinth Inlet Tube
3. Extensive Baffle System
4. Machine Outlet Check Valve (One-Way Valve)
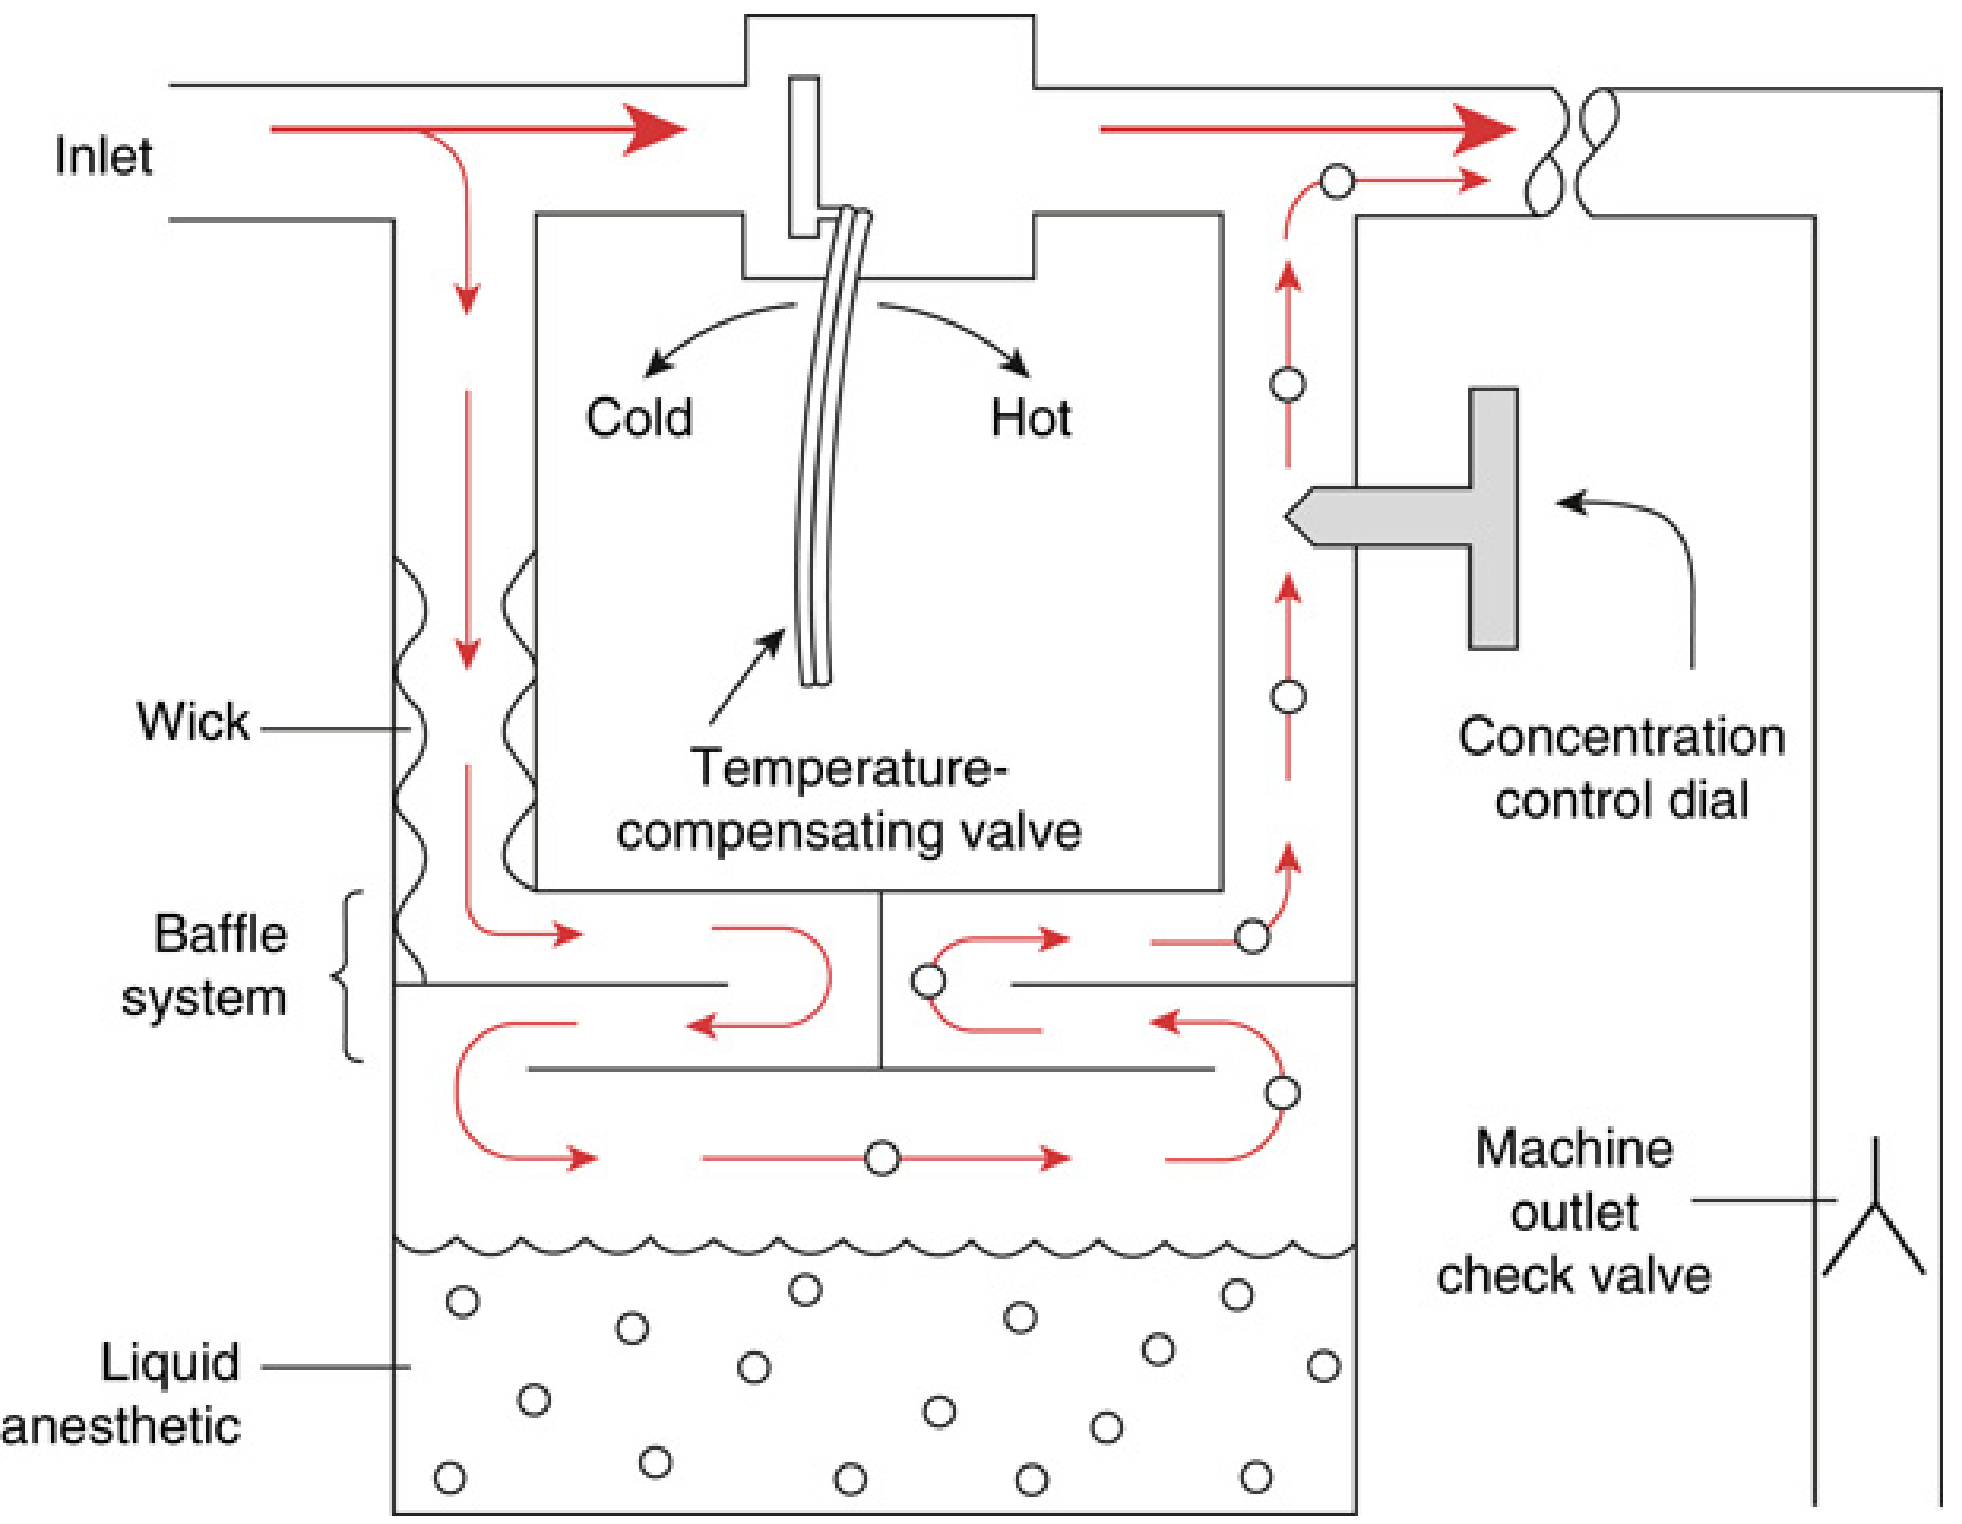
PART 2: PHYSICS AND LAWS APPLIED TO ANAESTHESIA DELIVERY SYSTEMS
Gas Laws
1. Boyle's Law
- Compressed gas cylinders (high-pressure O₂ cylinders: contents calculable from gauge pressure)
- Breathing bags and bellows - as circuit pressure rises, volume decreases
- The pumping effect itself - gas is compressed in the vaporizing chamber under back-pressure, then expands as pressure drops
2. Charles' Law
- Vaporiser output varies with temperature - as temperature rises, SVP rises and more vapour is produced (hence need for temperature compensation)
- Gas volume delivered from bellows/reservoir bags changes with ambient temperature
3. Gay-Lussac's Law (Pressure Law)
- Cylinder pressure increases when warmed - oxygen cylinders must not be stored near heat sources
- Pressure regulators must account for temperature-related pressure changes
4. Dalton's Law of Partial Pressures
- FiO₂ calculation: O₂ partial pressure = FiO₂ × atmospheric pressure (e.g., 0.21 × 101.3 kPa = 21.3 kPa at sea level)
- Calculating delivered anaesthetic partial pressures
- Gas mixing at the rotameter manifold - each gas contributes its partial pressure independently
- MAC (minimum alveolar concentration) is expressed as a partial pressure concept
5. Avogadro's Law
- Flowmeter calibration - each gas rotameter is calibrated individually since gas density differs
- 1 gram molecular weight of any gas occupies 22.4 L at STP
6. Henry's Law
- Blood/gas partition coefficient: the amount of anaesthetic dissolving in blood is proportional to its alveolar partial pressure
- Higher solubility (higher λ) → more dissolved → slower rise in alveolar partial pressure → slower induction
- Used to understand uptake from alveoli into pulmonary capillary blood
7. Fick's Law of Diffusion
- Diffusion of anaesthetic gases across the alveolar-capillary membrane
- Diffusion hypoxia after N₂O discontinuation (Fink effect): large volume of N₂O diffuses out of blood into alveoli, diluting O₂
8. Graham's Law
- Rotameter calibration - lighter gases like H₂ and He flow faster than heavier ones through a tube
- Understanding differential gas flow through variable orifice flowmeters
9. Poiseuille's Law
- Gas flow through the anaesthetic machine tubing, flowmeters, and breathing circuits
- Explains why small reductions in tube radius (e.g., from secretions or kinking) dramatically reduce flow
- Laminar flow through rotameter tubes at low flow rates
10. Reynolds' Number & Turbulent Flow
- Low Re (<2000): laminar flow (Poiseuille applies) - flow dependent on viscosity
- High Re (>4000): turbulent flow - flow dependent on density
- Applied in: gas flow through rotameters (laminar at bottom, turbulent at top of bobbin), airway resistance during high-flow delivery, Venturi masks
11. Bernoulli Effect / Venturi Principle
- Venturi masks (air entrainment)
- Injector (Venturi) in the anaesthetic machine for driving bellows
- Nebuliser function
- Oxygen therapy devices
12. Laplace's Law
- Alveolar stability: smaller alveoli tend to collapse (higher pressure), counteracted by surfactant
- Understanding why a small balloon empties into a large one when connected
- Compliance of anaesthetic bags and breathing circuit components
13. The Ideal Gas Law
- Calculating gas quantities in cylinders and pipelines
- Understanding how temperature and pressure affect delivered gas volumes
Vapour Pressure and Vaporiser Physics
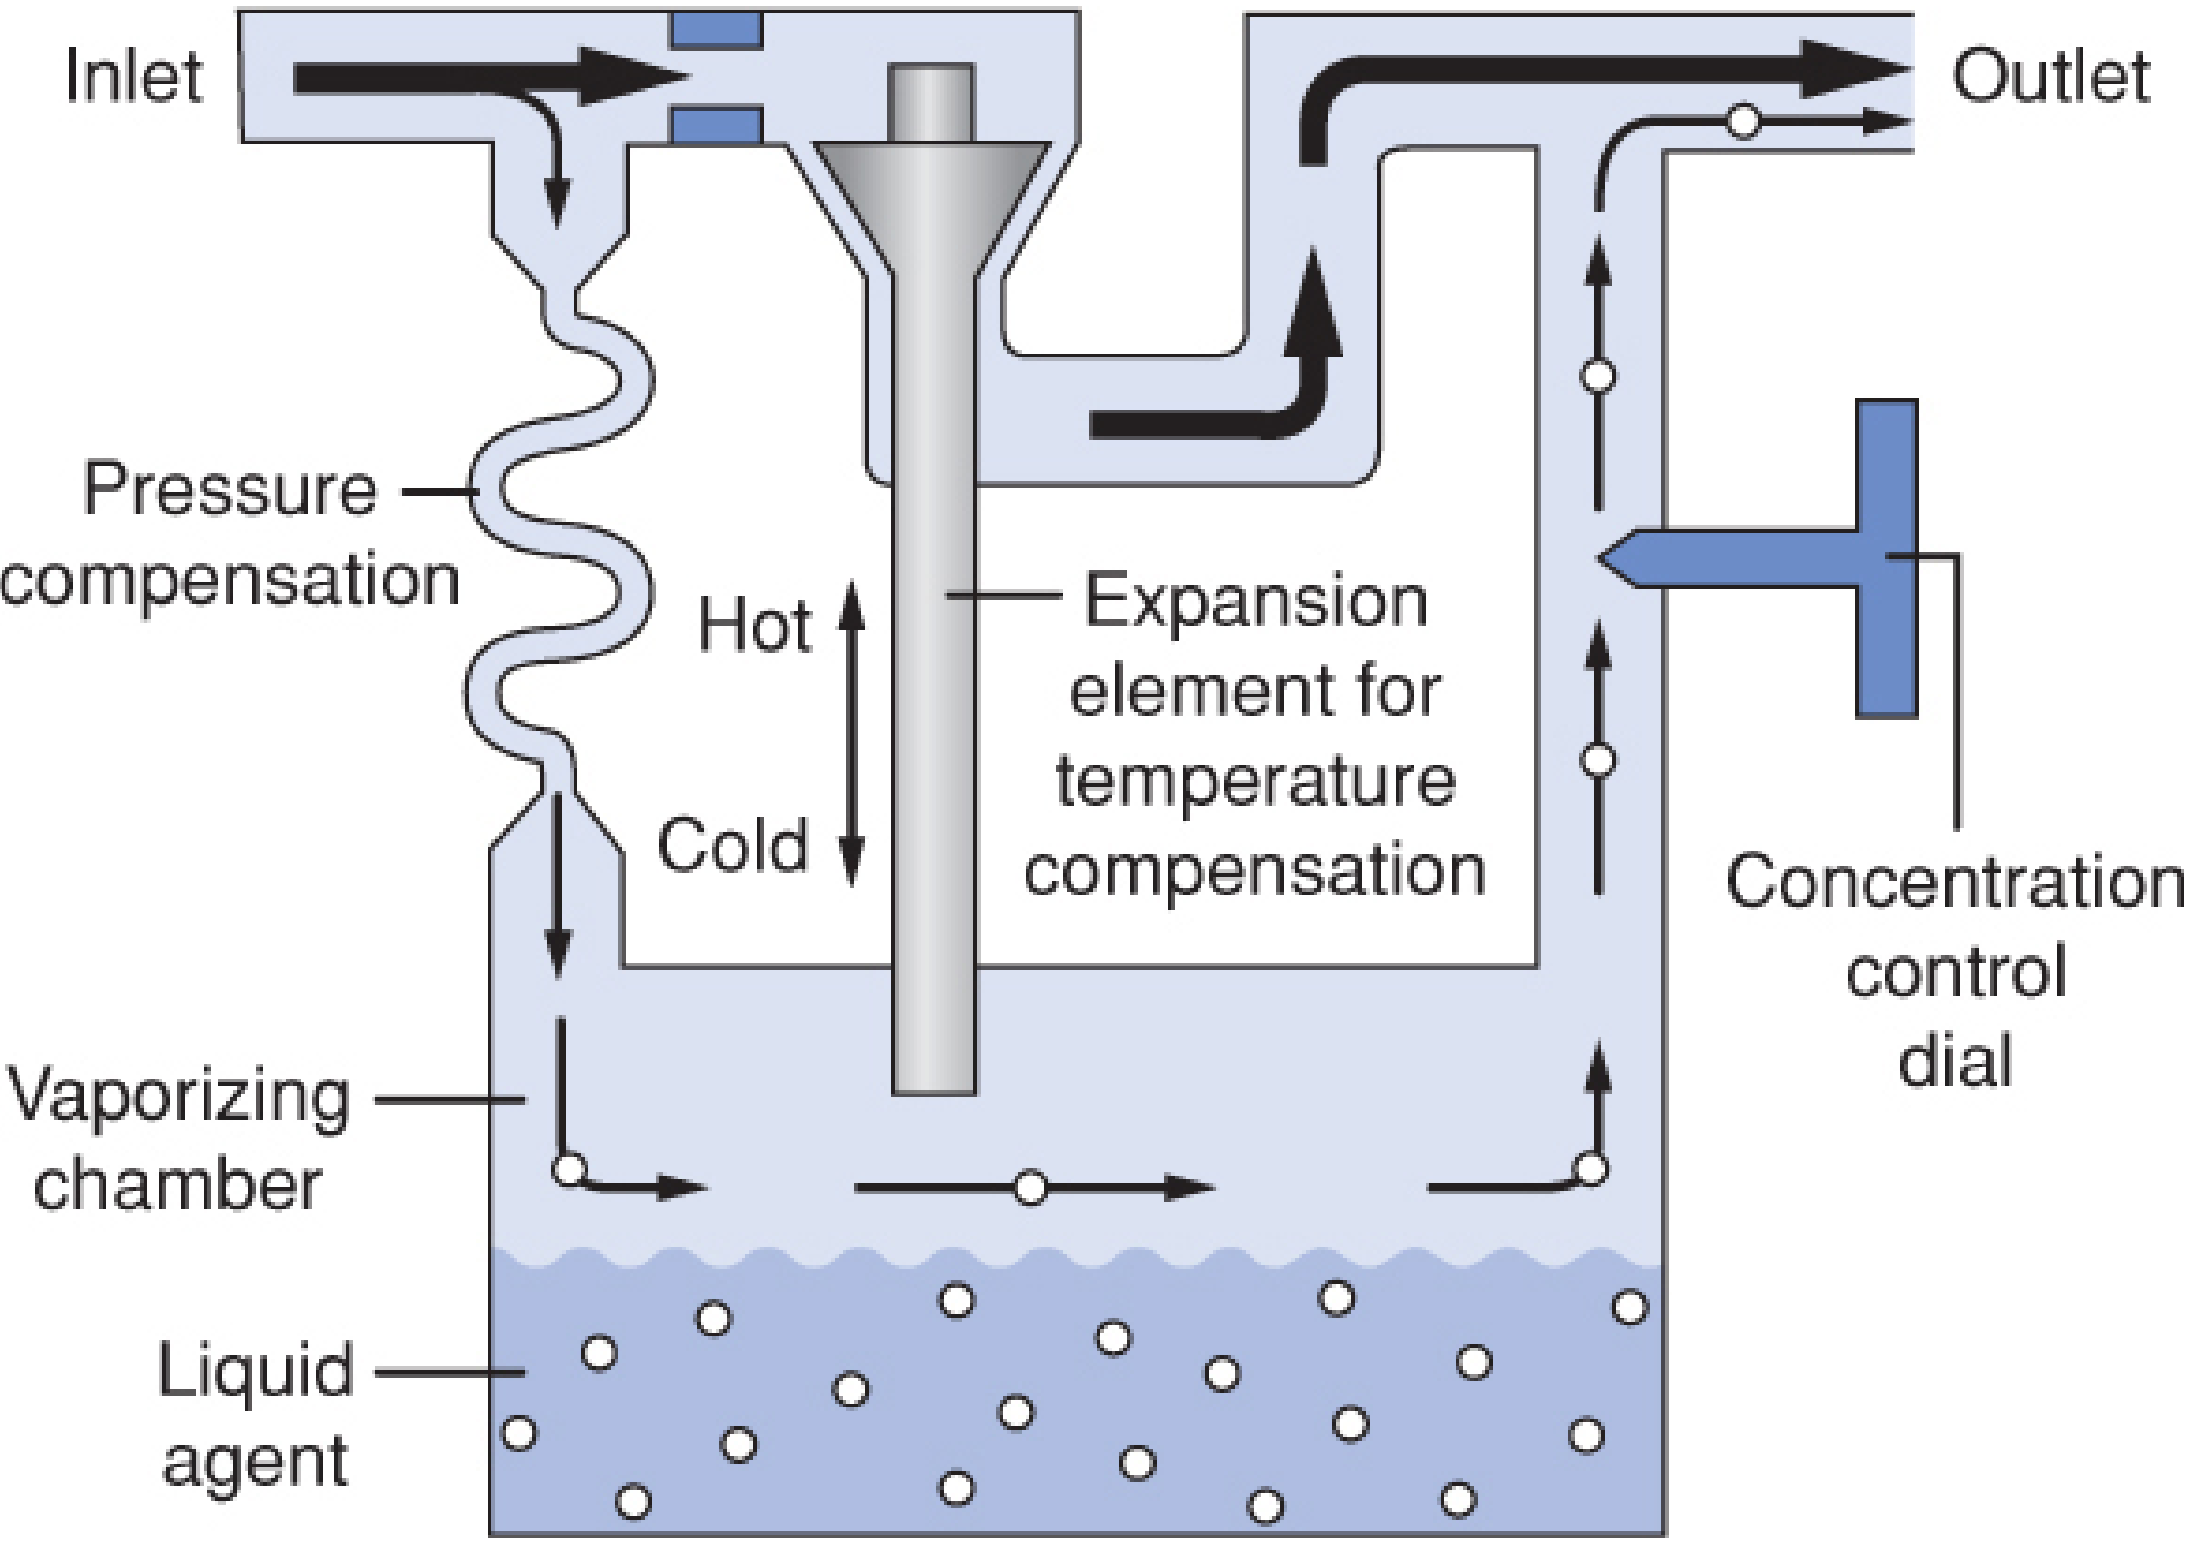
- Bimetallic strip (e.g., Tec series vaporisers): two metals with different thermal expansion coefficients bend toward the bypass channel as temperature rises, directing more flow through the bypass and less through the vaporizing chamber
- Expansion element (Dräger Vapor series): an aneroid-type element expands with heat to divert gas toward the bypass
PART 3: UPTAKE AND DISTRIBUTION OF VOLATILE ANAESTHETICS
DELIVERY TO THE ALVEOLI
1. Inspired Concentration (FI)
2. Alveolar Ventilation
- Increased minute ventilation speeds up induction by replacing anaesthetic taken up by the blood
- The effect is greatest for soluble agents (e.g., halothane, isoflurane) because these are subject to large blood uptake; increasing ventilation can partially overcome this
- For insoluble agents (e.g., desflurane, N₂O), FA/FI rises rapidly regardless of ventilation as uptake is minimal
3. Functional Residual Capacity (FRC)
- FRC dilutes the inspired anaesthetic in the alveoli
- Large FRC slows induction (adults vs children)
- Higher alveolar ventilation : FRC ratio = faster induction (children have ratio 5:1 vs adults 1.5:1)
4. Circuit Characteristics
- Circuit volume: a large circuit volume dilutes and delays delivery
- Fresh gas flow rate: higher FGF speeds equilibration and reduces rebreathing
- Solubility of agent into rubber/plastic: older circuits absorbed volatile agents, slowing delivery
UPTAKE FROM ALVEOLI
- λb/g = blood/gas partition coefficient (solubility)
- Q̇ = cardiac output (= alveolar blood flow if no shunt)
- PA - Pv̄ = alveolar to mixed venous partial pressure difference
A. Solubility (Blood/Gas Partition Coefficient, λ)
| Agent | Blood/Gas λ | Speed of Induction |
|---|---|---|
| Desflurane | 0.42 | Very fast |
| Nitrous oxide | 0.47 | Very fast |
| Sevoflurane | 0.65 | Fast |
| Isoflurane | 1.4 | Moderate |
| Halothane | 2.4 | Slower |
- A high λ means more anaesthetic dissolves in blood → blood acts as a "sink" → alveolar partial pressure rises slowly → slow induction
- A low λ means blood is quickly saturated → FA rises quickly → fast induction
- High postprandial lipidaemia increases blood solubility; anaemia decreases it
B. Cardiac Output
- High CO → more blood passes through lungs → more anaesthetic removed from alveoli → FA rises slowly → slow induction
- Low CO (e.g., shock, heart failure) → less uptake → FA rises rapidly → risk of anaesthetic overdose with soluble agents
- This effect is pronounced for soluble agents and minimal for insoluble agents
- Clinical implication: low CO states require reduced inspired concentrations of soluble agents
C. Alveolar - Venous Partial Pressure Difference (PA - Pv̄)
- At induction, venous blood returns essentially free of anaesthetic (Pv̄ ≈ 0), so the gradient is maximal
- As tissues equilibrate, venous partial pressure rises, gradient falls, uptake slows, and FA/FI ratio rises more quickly
- This explains the characteristic hyperbolic shape of FA/FI curves: rapid initial rise, then plateau
SPECIAL PHENOMENA
Concentration Effect
- Concentrating effect: As N₂O is absorbed, total alveolar volume shrinks, but the remaining N₂O occupies a larger fraction of the smaller volume - raising its concentration above expected
- Augmented inflow effect: Reduction in alveolar volume creates a slight negative pressure drawing more fresh gas in from the circuit, which also carries more N₂O (and any co-administered volatile agent)
Second Gas Effect
- Rapid uptake of large volumes of N₂O concentrates the volatile agent in alveoli
- This accelerates the rise of FA/FI for the volatile agent beyond what would occur with oxygen alone
- Clinically: N₂O co-administration speeds induction with volatile agents
TISSUE DISTRIBUTION (Compartmental Model)
- Tissue blood flow (perfusion)
- Tissue-blood partition coefficient
- Tissue volume
| Tissue Group | % Body Mass | % Cardiac Output | Examples |
|---|---|---|---|
| Vessel-rich group (VRG) | 10% | 75% | Brain, heart, liver, kidney |
| Muscle group | 50% | 20% | Skeletal muscle |
| Fat group | 20% | 6% | Adipose tissue |
| Vessel-poor group (VPG) | 20% | <1% | Bone, tendons, cartilage |
- VRG equilibrates rapidly (high flow, moderate volume) - this is why anaesthesia is achieved quickly in the brain
- Muscle group equilibrates over 20-40 minutes - uptake shifts from VRG to muscle group as VRG saturates
- Fat group equilibrates very slowly (hours) - high fat/blood coefficient means fat is a vast reservoir (especially for halothane λfat/blood = 60, isoflurane = 45); prolonged infusion leads to fat accumulation and delayed emergence
- VPG essentially negligible uptake
RECOVERY AND EMERGENCE
- Low blood/gas partition coefficient (desflurane, sevoflurane > halothane)
- Elimination of rebreathing (high fresh gas flows)
- Low circuit volume
- High alveolar ventilation
- Low fat/blood coefficient - less agent stored in fat compartment
- Short duration of anaesthesia - less redistribution to fat
Summary Table: FA/FI - Factors at a Glance
| Factor | ↑ FA/FI (faster induction) | ↓ FA/FI (slower induction) |
|---|---|---|
| Solubility | Low λb/g (desflurane) | High λb/g (halothane) |
| Cardiac output | Low CO | High CO |
| Alveolar ventilation | High | Low |
| FRC | Small (child) | Large (adult, emphysema) |
| Inspired concentration | High FI | Low FI |
| FGF rate | High | Low |
| Circuit volume | Small | Large |
- Barash, Cullen & Stoelting's Clinical Anesthesia, 9th ed., pp.1976-1977 (vaporiser - pumping effect)
- Miller's Anesthesia, 10th ed., pp.2287-2290 (vaporiser output factors, pumping effect, modifications)
- Morgan & Mikhail's Clinical Anesthesiology, 7th ed., pp.281-289 (partition coefficients, uptake, concentration effect, tissue distribution)