
Pathophysiology of ckd underlying diabetic nephropathy
diabetic nephropathy pathophysiology glomerulosclerosis CKD
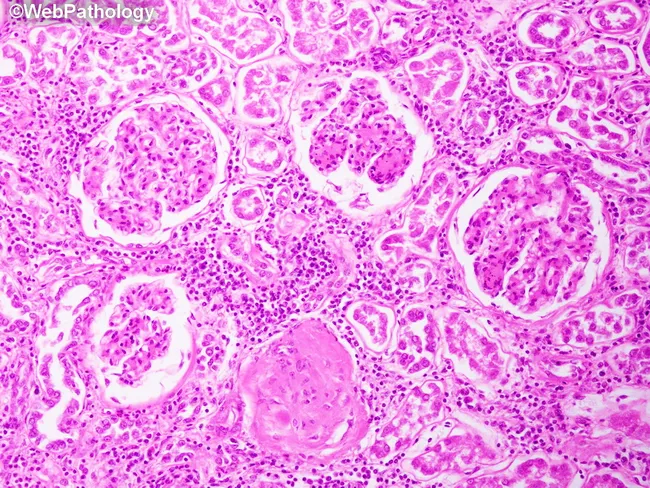
This is a light microscopy image of a renal biopsy from a patient with diabetes mellitus, stained with Hematoxylin and Eosin, viewed at high magnification (approximately 400x). The section comprises renal cortex with multiple glomeruli. Hallmarks of diabetic nephropathy are present: increased mesangial matrix with mesangial expansion surrounding capillary tufts, and one glomerulus showing global sclerosis consistent with advanced disease. The glomerular basement membranes appear thickened in the affected areas (as described in classic diabetic changes), though the image primarily highlights mesangial and sclerotic changes. Interstitium displays a chronic inflammatory infiltrate, indicating tubulointerstitial involvement associated with long-standing diabetes. Collectively these features reflect the triad of diabetic microvascular injury: mesangial expansion, GBM thickening, and arteriolar hyalinosis, contributing to progressive glomerulosclerosis and renal impairment. The observed pathology confirms diabetic glomerulopathy and provides diagnostic significance in evaluating proteinuria, decreased glomerular filtration, and CKD risk. In clinical practice, such histology supports staging of DN, guides management aimed at optimizing glycemic control, reducing hypertension, and preventing further renal decline. This image serves educational purposes for understanding pathophysiology of diabetic nephropathy, correlating morphological lesions with clinical severity, and illustrating typical glomerular sclerosis and interstitial inflammatory response in advanced disease.
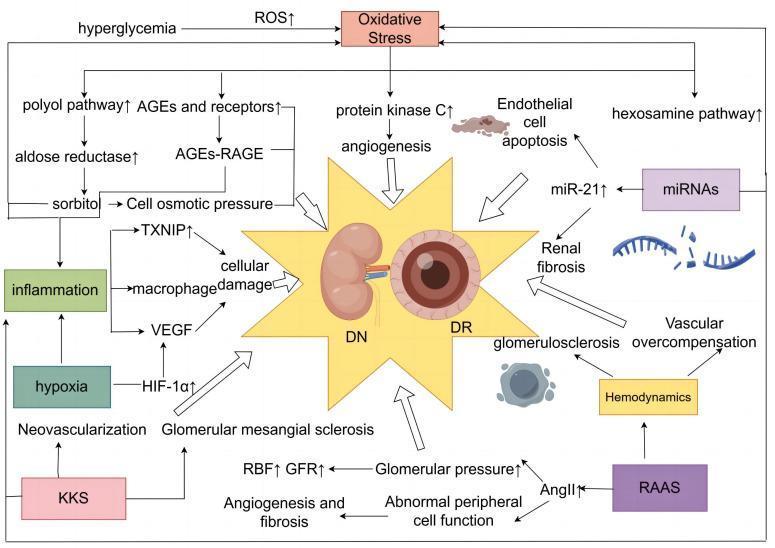
This pathophysiology diagram illustrates the shared metabolic and hemodynamic mechanisms underlying Diabetic Nephropathy (DN) and Diabetic Retinal (DR). The visual logic centers on a central starburst icon containing a kidney and an eye, surrounded by converging pathological pathways. At the top, Hyperglycemia and Oxidative Stress (ROS↑) serve as primary drivers, initiating four classic metabolic branches: the polyol pathway (leading to sorbitol and osmotic pressure changes), AGEs-RAGE signaling, the hexosamine pathway (via miRNAs/miR-21↑), and Protein Kinase C activation (triggering angiogenesis). On the left, factors like Hypoxia and Inflammation link to HIF-1̡ and VEGF, promoting neovascularization. On the right and bottom, Hemodynamics and the RAAS system (via AngII↑) are shown contributing to glomerular hypertension, renal blood flow (RBF) alterations, and vascular overcompensation. The diagram illustrates how these multi-systemic pathways culminate in shared endpoints: cellular damage, endothelial cell apoptosis, renal fibrosis, and glomerulosclerosis, highlighting the interconnected nature of microvascular complications in diabetes mellitus.
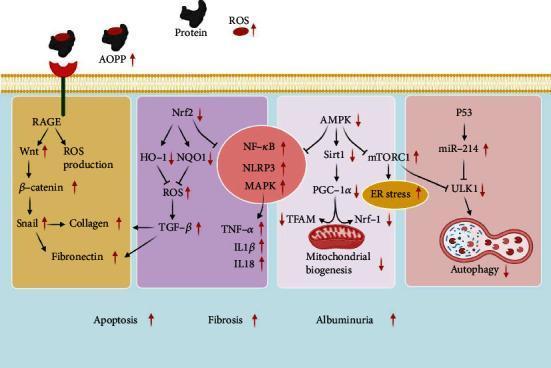
A pathophysiology diagram illustrating impaired molecular signaling pathways in diabetic nephropathy. The diagram is divided into four functional domains: 1) The RAGE pathway (yellow) shows Advanced Oxidation Protein Products (AOPP) activating RAGE, leading to increased ROS, Wnt, β-catenin, Snail, collagen, and fibronectin. 2) The Nrf2 pathway (purple) depicts decreased Nrf2, HO-1, and NQO1, resulting in increased ROS, TGF-β, and inflammatory markers (NF-κB, NLRP3, MAPK, TNF-α, IL1β, IL18). 3) The AMPK pathway (grey) shows decreased AMPK, Sirt1, PGC-1α, TFAM, and Nrf-1 leading to reduced mitochondrial biogenesis, while increased mTORC1 aggravates ER stress. 4) The P53 pathway (red) demonstrates increased P53 and miR-214, which inhibits ULK1 and suppresses autophagy. Collectively, these dysregulated pathways contribute to the clinical manifestations of increased apoptosis, fibrosis, and albuminuria. Red arrows indicate upregulated or downregulated protein expression levels characteristic of the diabetic state, emphasizing the loss of antioxidant defenses and homeostatic mechanisms like autophagy.
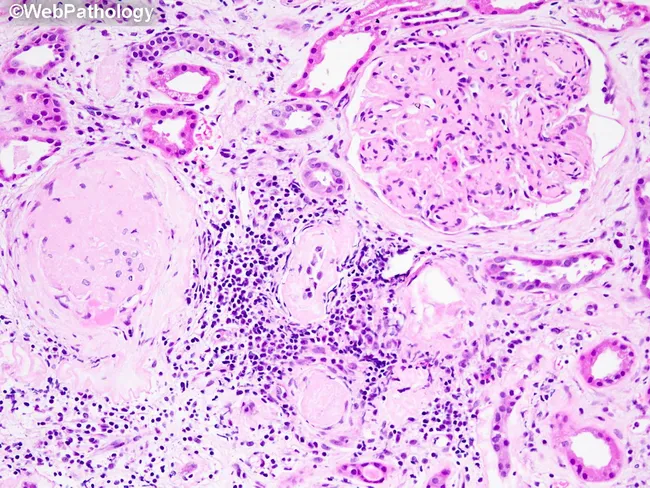
This histopathology image displays a renal cortex biopsy stained with Hematoxylin and Eosin and observed under bright-field light microscopy. The core features of diabetic nephropathy are evident: mesangial widening with expansion of the mesangial matrix and a globally sclerotic glomerulus, indicative of advanced glomerulosclerosis. Tubular basement membranes appear thickened, reflecting chronic microangiopathy and diabetic tubulopathy. The interstitium shows inflammatory infiltrates consistent with chronic interstitial inflammation and potential tubular injury. The overall renal architecture is altered by progressive scarring while some glomeruli retain reference morphology. These changes typify diabetic kidney disease in long-standing diabetes, often accompanying proteinuria, hypertension, and reduced glomerular filtration rate. The lack of nodular Kimmelstiel-Wilson lesions may reflect a particular stage. Notable differential considerations include hypertensive nephrosclerosis or chronic glomerulonephritis; however, the combination of mesangial matrix expansion, global sclerosis, and TBM thickening strongly supports diabetic nephropathy. Clinically, these histologic features correlate with reduced renal function and microalbuminuria, guiding therapeutic decisions such as optimization of glycemic control and renin-angiotensin-aldosterone system blockade. This image is valuable for educational, diagnostic, and research contexts, enabling recognition of advanced DN pathology and correlation with clinical diabetes duration and nephropathy progression.
"diabetic nephropathy" AND pathophysiology
Pathophysiology of CKD Underlying Diabetic Nephropathy
1. The Central Driver: Chronic Hyperglycemia
| Pathway | Mechanism | Renal Effect |
|---|---|---|
| Polyol pathway | Aldose reductase converts glucose to sorbitol | Osmotic stress, cellular injury, oxidative stress |
| AGE-RAGE axis | Advanced glycation end-products bind RAGE receptors | Collagen cross-linking, GBM thickening, fibrosis |
| Protein kinase C (PKC) | DAG accumulation activates PKC | Increased TGF-β, VEGF, endothelin-1, angiogenesis |
| Hexosamine pathway | Excess glucose flux via glucosamine | Upregulates TGF-β and PAI-1, promoting fibrosis |
2. Hemodynamic Injury: Glomerular Hyperfiltration
- Glomerular hyperperfusion and hyperfiltration - GFR rises 20-40% above normal
- Renal hypertrophy - kidney size increases
- Afferent arteriolar vasodilation - driven by elevated IGF-1, glucagon, and prostaglandins
- Stretches the GBM, increasing pore size
- Leads to proteinuria
- Stimulates mesangial matrix production
- Causes podocyte stress and detachment
3. RAAS Activation and Maladaptive Loop
- Renin release → angiotensin I → angiotensin II (via ACE)
- AII causes systemic and glomerular hypertension
- AII stimulates aldosterone → salt/water retention
- AII directly stimulates TGF-β production → mesangial expansion and fibrosis
- AII promotes reactive oxygen species (ROS) and endothelin-1 release
4. Oxidative Stress and Inflammation
- Mitochondrial electron transport chain dysfunction
- NADPH oxidase activation
- Decreased antioxidant defenses (Nrf2/HO-1 pathway suppression)
- Pro-inflammatory cytokines (TNF-α, IL-1β, IL-6, IL-18)
- Adhesion molecules (ICAM-1)
- VEGF (vascular dysfunction, angiogenesis)
- HIF-1α under hypoxic conditions → further VEGF and fibrosis
5. TGF-β and Fibrosis: The Final Common Pathway
- AGEs
- AII
- PKC activation
- Mechanical stretch (from hyperfiltration)
- High glucose directly
- Stimulates mesangial cells to produce excess ECM (collagen IV, fibronectin, laminin)
- Induces epithelial-to-mesenchymal transition (EMT) of tubular cells
- Inhibits matrix metalloproteinases (MMPs) → impaired ECM degradation
- Activates Smad2/3 signaling → pro-fibrotic gene transcription
6. Podocyte Injury
- Podocyte hypertrophy occurs early (from IGF-1 and AII)
- Foot process effacement disrupts the slit diaphragm → proteinuria
- Podocyte apoptosis and detachment - lost podocytes cannot be replaced
- Podocyte depletion directly correlates with mesangial expansion and GFR decline
7. Structural (Histopathological) Changes
Glomerular lesions
- GBM thickening - earliest change, detectable by EM within years of diabetes onset; precedes clinical changes
- Diffuse mesangial sclerosis - increased PAS-positive mesangial ECM + mesangial cell proliferation; present in most patients with >10 years of disease
- Nodular glomerulosclerosis (Kimmelstiel-Wilson lesions) - ball-like laminated matrix deposits in the peripheral mesangium; pathognomonic of DN; found in ~15-30% of long-term diabetics; ~40-50% of proteinuric patients
- Glomerular hypertrophy - earliest structural change
Vascular lesions
- Hyaline arteriolosclerosis affecting both afferent AND efferent arterioles (efferent involvement is virtually unique to diabetes); leads to ischemic glomerulosclerosis
- Renal atherosclerosis as part of diabetic macrovascular disease
Tubulointerstitial lesions
- Tubular basement membrane (TBM) thickening
- Tubular atrophy and interstitial fibrosis (late stage)
- Armanni-Ebstein lesion (glycogen deposition in tubular cells, from severe hyperglycemia)
Immunofluorescence
- Linear IgG (mainly IgG4) and albumin deposition along GBM, TBM, and Bowman capsule (non-immune, ionic trapping)
8. Tubular Dysfunction
- SGLT2 upregulation increases proximal sodium-glucose reabsorption → further suppression of tubuloglomerular feedback → sustained hyperfiltration
- Type IV renal tubular acidosis (hyporeninemic hypoaldosteronism) occurs in both T1DM and T2DM, causing hyperkalemia and metabolic acidosis
- Tubuloglomerular junction abnormalities in proteinuric patients contribute to GFR loss
- Tubulointerstitial fibrosis is the histologic finding that best correlates with ultimate GFR decline
9. Natural History and CKD Progression
| Stage | Feature | GFR | Albuminuria |
|---|---|---|---|
| I | Hyperfiltration, hypertrophy | Elevated | Normal |
| II | Silent (structural changes) | Normal | Normal (exercise-induced) |
| III | Incipient nephropathy | Normal/slightly ↓ | Microalbuminuria 30-299 mg/g |
| IV | Overt nephropathy | Progressively ↓ | Macroalbuminuria >300 mg/g, nephrotic range possible |
| V | ESKD | <15 mL/min | Variable (may decrease as GFR falls) |
- Up to 24% of T1DM and 50% of T2DM patients with CKD may be normoalbuminuric - albuminuria is not always present
- The degree of hyperfiltration correlates directly with albuminuria development and GFR decline
- Microalbuminuria appears 5-10 years after diabetes onset; classically progresses over another 5-10 years to proteinuria and falling GFR, but regression to normoalbuminuria can occur with treatment
10. Common CKD Amplification Pathways
- Remnant nephron hyperfiltration - surviving nephrons hypertrophy and hyperfiltrate to compensate, creating a cycle of FSGS-like injury
- Proteinuria itself - filtered proteins are cytotoxic to tubular cells; albumin activates NF-κB in tubular cells → chemokines → interstitial inflammation
- Systemic hypertension - transmits to glomeruli, worsening sclerosis
- Recurrent AKI episodes on a background of CKD accelerate decline
- Uremic milieu - accumulation of uremic toxins (indoxyl sulfate, p-cresol sulfate) further drives tubular and vascular injury
Summary Schematic of Mechanisms
Chronic Hyperglycemia
        ↓
┌───────────────────────────────────┐
│ Polyol → Sorbitol (osmotic stress)│
│ AGE-RAGE → ECM cross-linking      │
│ PKC → TGF-β, VEGF, ET-1          │
│ Hexosamine → Fibrosis             │
└───────────────┬───────────────────┘
                ↓
     Oxidative Stress (ROS↑)
     + RAAS Activation (AII↑)
                ↓
   ┌────────────┴────────────┐
   ↓                         ↓
Glomerular              Podocyte Injury
Hyperfiltration         (foot process
(GFR↑, P_GC↑)          effacement,
                         apoptosis)
   ↓                         ↓
GBM Thickening ──────→ Proteinuria
Mesangial Expansion
Kimmelstiel-Wilson Nodules
   ↓
Glomerulosclerosis + Tubulointerstitial Fibrosis
   ↓
Progressive CKD → ESKD
- Harrison's Principles of Internal Medicine 22E (2025), Chapters 417 & 326
- NKF Primer on Kidney Diseases 8e, Chapter 26 (Diabetic Nephropathy) & Chapter 50 (Pathophysiology of CKD)
- Robbins & Kumar Basic Pathology, Chapter 18
- Brenner & Rector's The Kidney - multiple chapters on hemodynamic factors and kallikrein-kinin system