Explain me ECG
Reading File
Finding Sources
Searching the Web
ECG electrocardiogram basics waves intervals clinical interpretation
Reading File
Finding Sources
Finding Sources
Loading Image
Finding Sources
Finding Sources
Reading File
Reading File
Reading File
Reading File
Loading Image
Loading Image
Loading Image
Now I have everything needed for a thorough explanation. Let me compile it all.
Electrocardiogram (ECG / EKG)
An ECG is a recording of the tiny electrical potential differences on the body's surface that reflect the heart's electrical activity. It was introduced by Einthoven in the early 1900s and has changed surprisingly little since. The key insight is that the heart does not depolarize all at once - different regions activate in a precise sequence, creating measurable voltage differences between body surface electrodes at different times.
1. The Cardiac Conduction System
Before reading any ECG, you need to know where the electricity comes from.
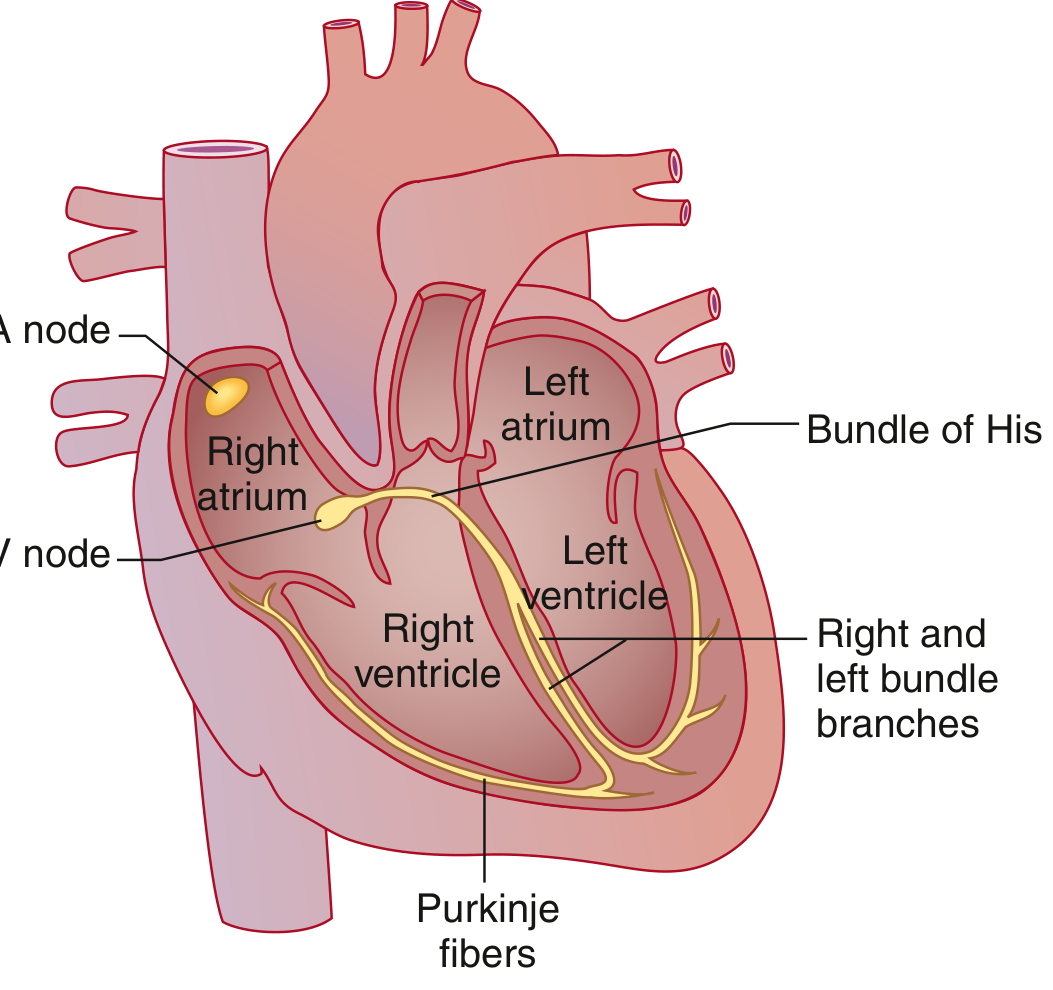
The normal conduction pathway (Goldman-Cecil Medicine):
- SA node (sinoatrial node) - in the high lateral right atrium near the superior vena cava. It spontaneously depolarizes at the highest rate (~60-100/min) and is the dominant pacemaker.
- Depolarization spreads across both atria via specialized tracts (Bachmann bundle carries it to the left atrium). This triggers atrial contraction.
- AV node - the only normal electrical connection between atria and ventricles. It deliberately slows conduction, creating a critical delay that allows the atria to finish contracting before the ventricles begin.
- Bundle of His - exits the AV node and bifurcates into right and left bundle branches (the left further divides into anterior and posterior fascicles).
- Purkinje system - the finest branches. Conduction here is extremely fast, so both ventricles depolarize almost simultaneously despite their large mass.
- The electrical signal finally reaches individual ventricular cardiomyocytes, triggering mechanical contraction.
"The AV node is an area of relatively slow conduction, and a delay between atrial and ventricular contraction normally occurs at this locus." - Miller's Anesthesia, 10e
2. The ECG Waveform
Each heartbeat produces a characteristic waveform with named components. Waves represent depolarization or repolarization; intervals include waves; segments are the flat regions between waves.

The Waves, Segments, and Intervals
| Component | What it represents | Normal value |
|---|---|---|
| P wave | Atrial depolarization | Duration 0.06-0.12 sec; amplitude 2-3 mm |
| PR interval | Time from atrial depolarization onset to ventricular depolarization onset (includes AV node delay) | 120-200 ms (3-5 small boxes) |
| PR segment | Flat portion = AV node conduction time | Isoelectric (flat) |
| QRS complex | Ventricular depolarization (Q = initial downstroke, R = upstroke, S = final downstroke) | <120 ms (3 small boxes) |
| ST segment | Period between end of ventricular depolarization and start of repolarization | Isoelectric (flat, at baseline) |
| T wave | Ventricular repolarization | Upright in most leads |
| QT interval | Full ventricular depolarization + repolarization (QRS + ST + T wave) | Corrected QTc <440 ms |
| U wave | Seen after T wave, most prominent in V2-V3; possibly Purkinje repolarization | Small, may be absent |
| J point | Junction between end of QRS and start of ST segment | At baseline |
Why is atrial repolarization not visible? It is buried within (and electrically masked by) the much larger QRS complex.
Why is QRS duration similar to P wave duration despite the ventricles being much larger? Because the His-Purkinje system conducts extremely fast, so the ventricles depolarize nearly as quickly as the atria.
3. The ECG Paper and Measurements
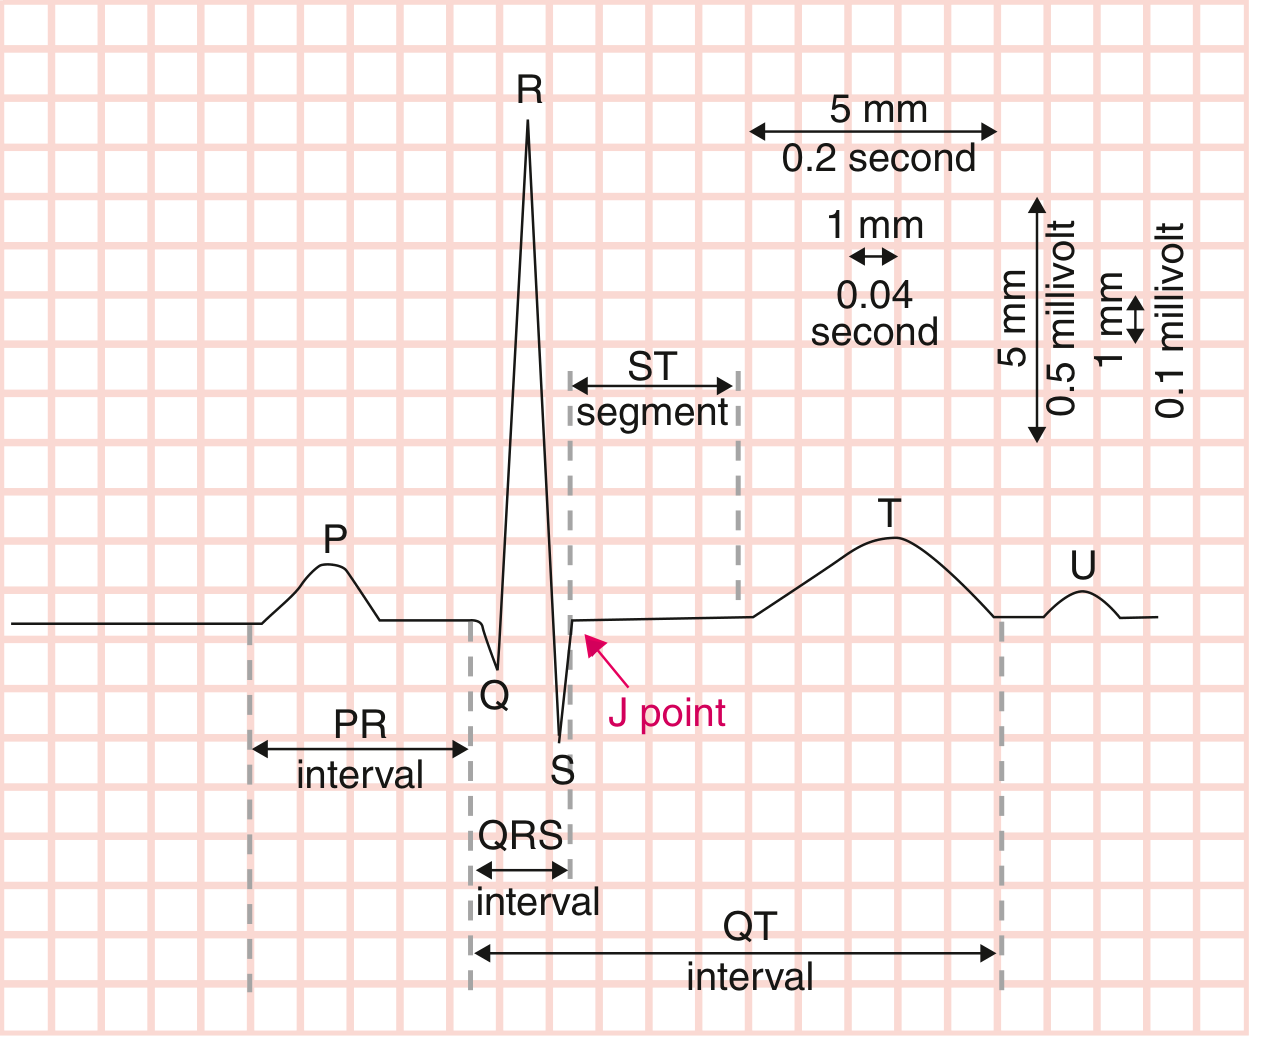
Standard ECG paper (Goldman-Cecil Medicine):
- Horizontal axis = time: 1 small box (1 mm) = 0.04 sec; 1 large box (5 mm) = 0.2 sec
- Vertical axis = voltage: 1 small box (1 mm) = 0.1 mV; 10 mm = 1 mV
- Recording speed: 25 mm/sec
- Standard recording: 10 seconds per strip
Calculating Heart Rate
- Regular rhythm: Count large boxes between two consecutive R waves. Divide 300 by that number. (e.g., 4 large boxes = 300/4 = 75 bpm)
- Irregular rhythm: Count QRS complexes in a 10-second strip and multiply by 6.
4. The 12 Leads
A standard ECG has 12 leads, each giving a different "view" of the heart's electrical activity:
- Limb leads (I, II, III): Look at the heart in the frontal plane
- Augmented limb leads (aVR, aVL, aVF): Additional frontal plane views
- Precordial (chest) leads (V1-V6): Look at the heart in the horizontal plane, progressing from right to left across the chest
Each lead records the same electrical events but from a different angle, so the same wave may appear positive in one lead and negative in another depending on whether the wave is moving toward or away from that electrode.
5. ECG and the Cardiac Cycle Together
The ECG perfectly coordinates with mechanical events:
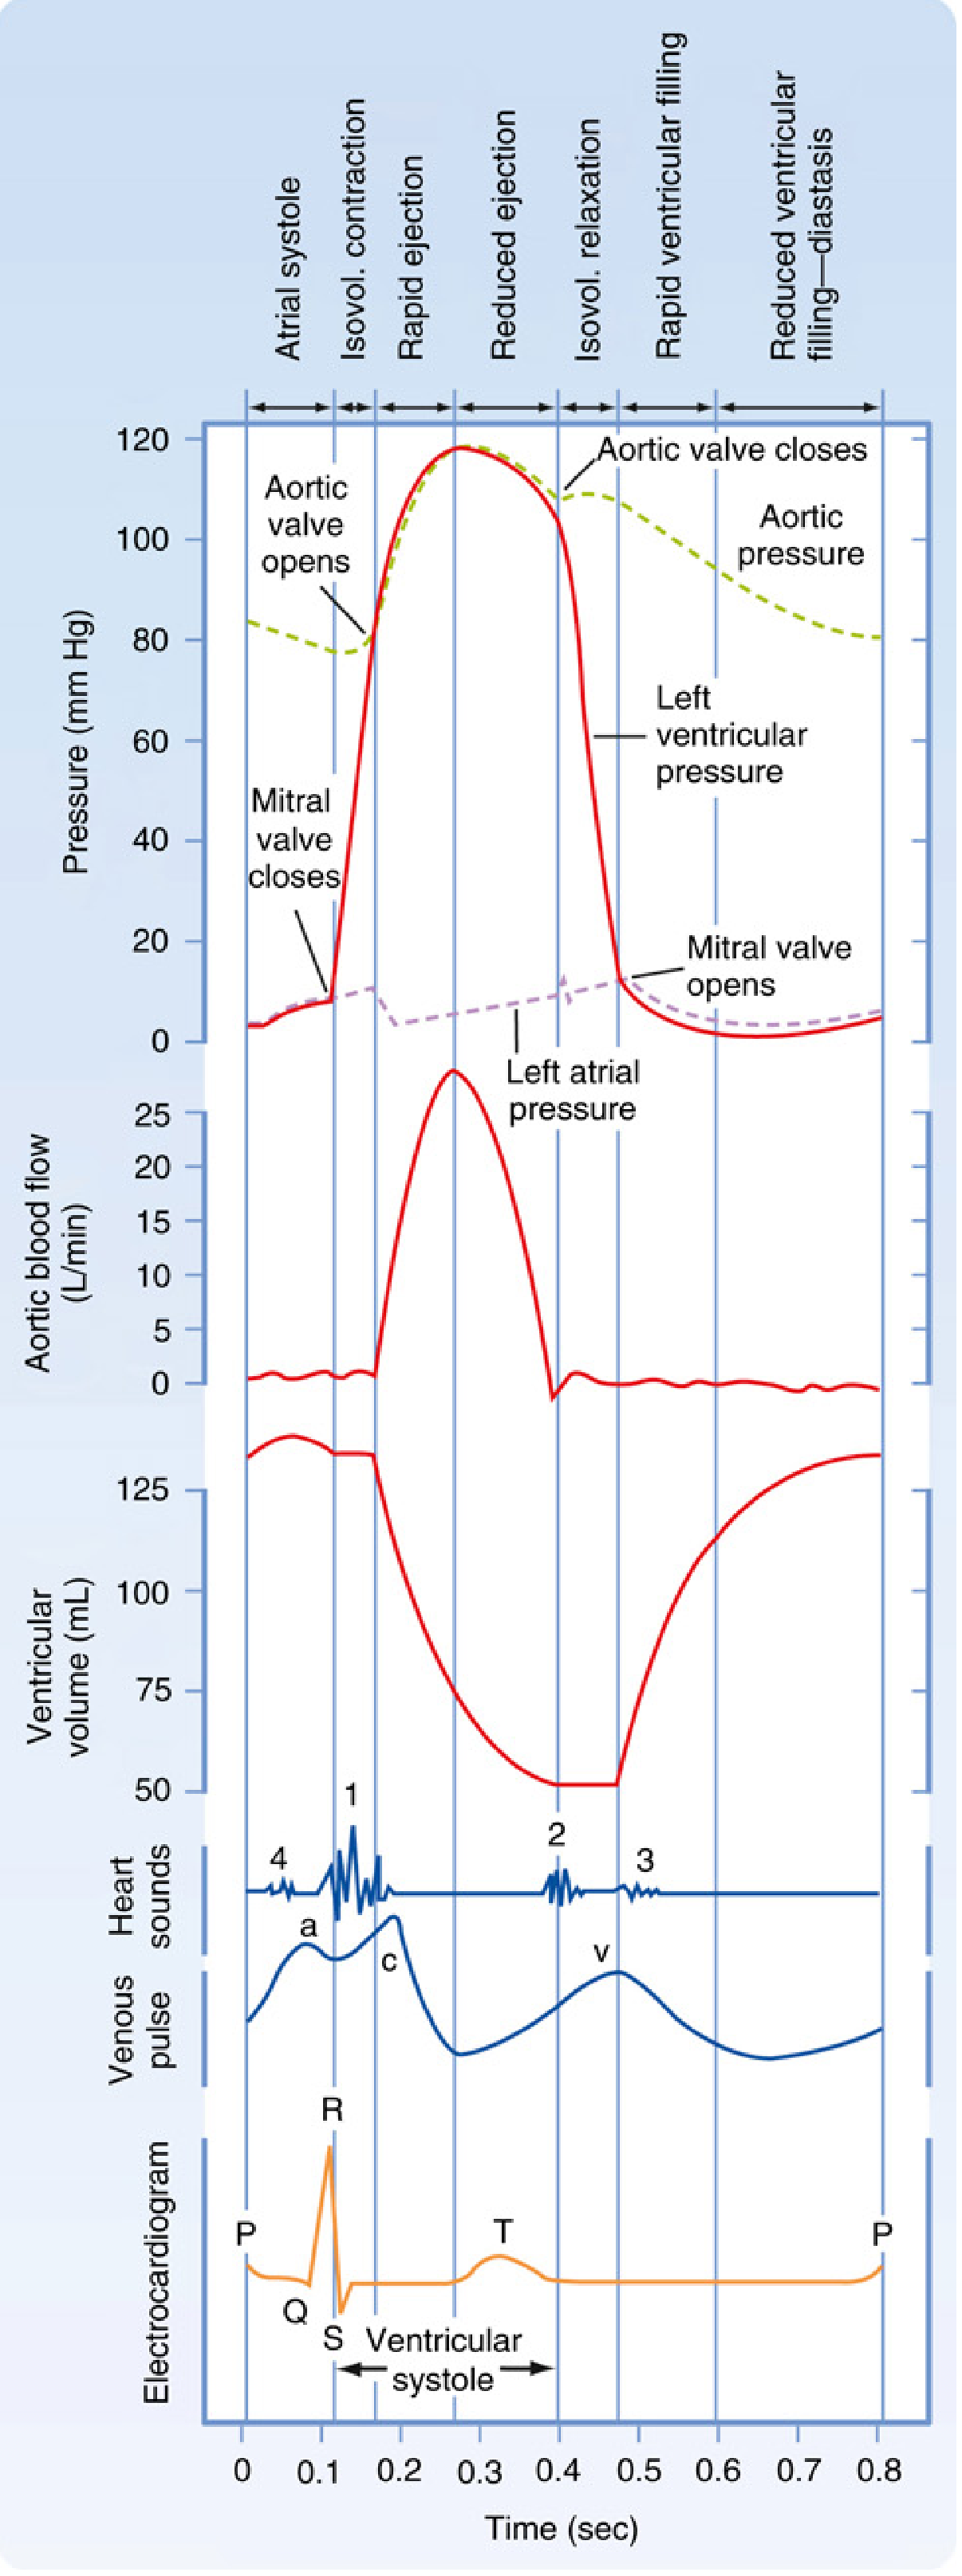
- P wave → atrial systole (atrial contraction, the "atrial kick")
- End of R wave → mitral/tricuspid valves close (S1 heart sound)
- QRS complex → ventricular depolarization → start of ventricular systole
- ST segment → isovolumetric relaxation, then aortic/pulmonic valves open
- T wave → ventricular repolarization → end of systole, start of diastole
- After T wave → aortic/pulmonic valves close (S2 heart sound), ventricular filling begins
6. Autonomic Influence on the ECG
The autonomic nervous system modifies conduction and rate, which changes what you see on the ECG (Costanzo Physiology, 7e):
| Effect | Sympathetic | Parasympathetic |
|---|---|---|
| Heart rate | Increases (faster SA nodal firing) | Decreases (slower SA nodal firing) |
| AV conduction | Faster (shorter PR interval) | Slower (longer PR interval, may cause heart block) |
| Mechanism | Increased I_Ca in AV node | Decreased I_Ca + increased I_K-ACh in AV node |
7. Common ECG Abnormalities (Quick Reference)
| Finding | Possible Cause |
|---|---|
| Prolonged PR (>200 ms) | 1st-degree AV block, digoxin toxicity, hyperkalemia |
| Wide QRS (>120 ms) | Bundle branch block, hyperkalemia, ventricular rhythm |
| ST elevation | STEMI, pericarditis, Brugada syndrome, early repolarization |
| ST depression | Subendocardial ischemia, digoxin effect, strain |
| Prolonged QT | Hypokalemia, hypomagnesemia, drugs (antiarrhythmics, antipsychotics) - risk of torsades |
| Peaked T waves | Early hyperkalemia |
| Absent P waves with irregular rhythm | Atrial fibrillation |
| J wave (Osborn wave) | Hypothermia, hypercalcemia |
Summary
The ECG translates the heart's electrical sequence into a readable tracing. P = atria depolarize, PR interval = AV node delay, QRS = ventricles depolarize, ST segment = electrical pause before repolarization, T = ventricles repolarize. Abnormalities in the shape, duration, or position of any of these components point directly to the underlying cardiac problem.
Sources: Costanzo Physiology 7e, Goldman-Cecil Medicine (International Ed.), Miller's Anesthesia 10e
This is a shared conversation. Sign in to Orris to start your own chat.