
Pain in left testes causes
scrotal pain testicular torsion epididymo-orchitis diagram causes
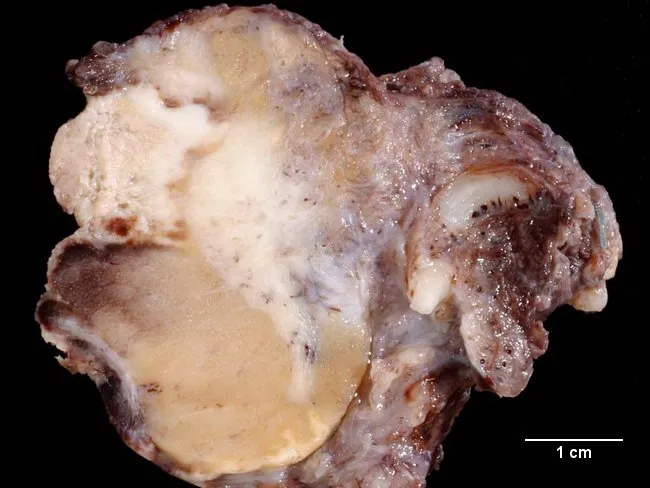
This is a macroscopic gross pathology photograph of the scrotal contents from a 25-year-old male with acute epididymo-orchitis in the setting of suspected testicular torsion. The specimen demonstrates destruction of the epididymal architecture with extensive inflammatory changes and partial involvement of the adjacent testicular parenchyma. The epididymis is irregular and disrupted, with creamy white exudate and pale tan to yellowish areas representing inflammatory tissue and early necrosis. The testicular surface shows uneven contour and focal inflammatory involvement; surrounding tunica and vascular structures may be congested. A 1 cm scale bar provides reference for lesion size. The overall appearance is that of an intense infectious/inflammatory process rather than isolated torsion, although torsion could be clinically suspected preoperatively. Such gross findings reinforce the diagnostic challenge of acute scrotal pain, where epididymo-orchitis can mimic torsion and lead to urgent surgical exploration. This image is valuable for medical education, urology training, and pathology teaching as a representative example of acute epididymo-orchitis with epididymal destruction and partial testicular involvement. Keywords: epididymitis, orchitis, acute inflammation, scrotal infection, gross pathology, pathology education, differential diagnosis, testicular torsion mimic, Pathorama.ch, 25-year-old male. These features are typical of acute inflammatory epididymal and testicular involvement.
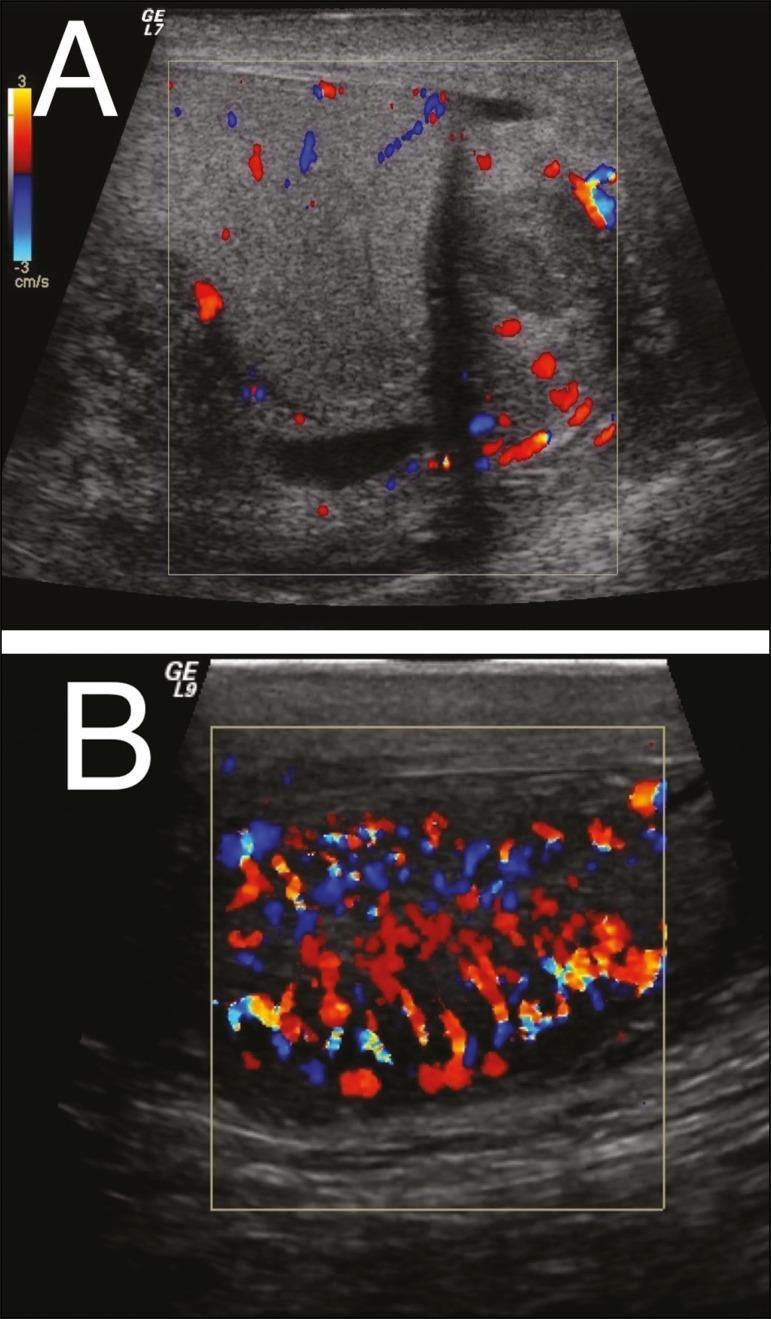
Two color Doppler ultrasound images (A and B) of the scrotal contents demonstrating findings consistent with epididymo-orchitis. Image A displays the epididymis, which appears enlarged and heterogeneous with an irregular echotexture. The color Doppler overlay reveals focal hypervascularity (hyperemia), indicated by increased red and blue signals within the epididymal tissue. Image B shows the testis, which is similarly enlarged and heterogeneous. The Doppler study in B demonstrates diffuse, intense hypervascularity throughout the testicular parenchyma, often referred to as a 'thyroid storm' or 'inferno' sign in the clinical context of orchitis. These findings illustrate the standard diagnostic radiological approach for differentiating inflammatory conditions from testicular torsion; the presence of increased blood flow is characteristic of infectious or inflammatory processes like epididymitis and orchitis, whereas absent or reduced flow would suggest torsion. The imaging is relevant for urological and emergency medicine education regarding acute scrotum evaluation.
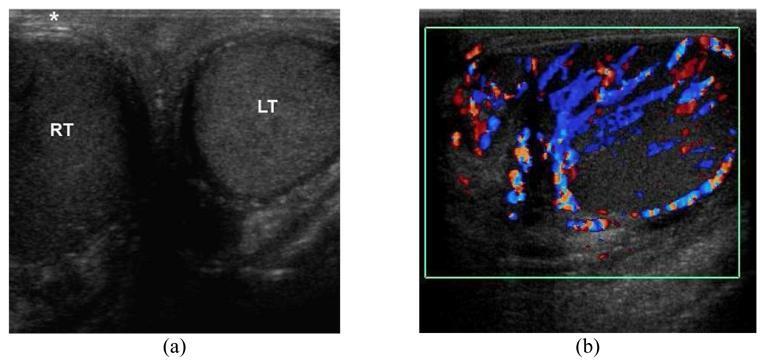
This diagnostic ultrasound display consists of two panels illustrating the clinical features of acute epididymo-orchitis in a 45-year-old male. Panel (a) is a transverse grayscale ultrasound of the scrotum providing a side-by-side comparison of the testes. The right testis (RT) is markedly enlarged and demonstrates a diffuse hypoechoic echotexture compared to the normal left testis (LT). Additionally, the overlying right scrotal skin is significantly thickened, indicated by an asterisk. Panel (b) shows a longitudinal color Doppler ultrasound (CDUS) of the right hemiscrotum. This image reveals prominent hypervascularity within both the testis and the adjacent epididymis, characterized by dense red and blue signals representing increased blood flow (hyperemia). These visual findings—testicular enlargement, decreased echogenicity, skin thickening, and hyperperfusion—are classic diagnostic indicators for infectious or inflammatory processes of the scrotum, distinguishing epididymo-orchitis from testicular torsion where flow would be absent.
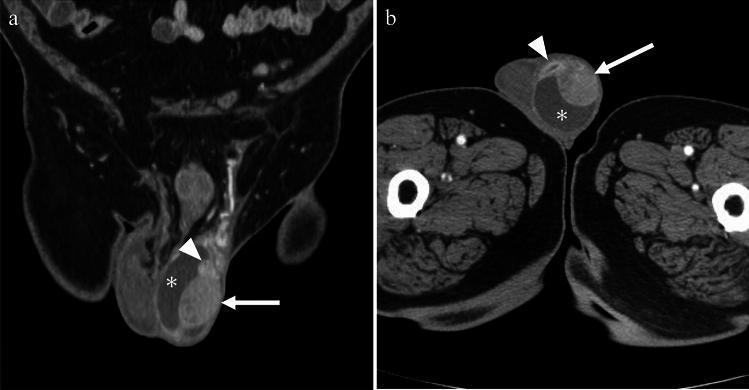
This contrast-enhanced CT study consists of coronal (a) and axial (b) sections of the pelvic and scrotal region, demonstrating findings characteristic of acute epididymo-orchitis with complications. The imaging reveals significant enlargement and intense, heterogeneous contrast enhancement of the left testis (arrow) and left epididymis (arrowhead), indicating severe inflammation and hyperemia. Associated features include marked thickening of the scrotal wall and a reactive hydrocele (asterisk), seen as a hypoattenuating fluid collection surrounding the testicular structures. In the axial view (b), a distinct focal area of non-enhancement with peripheral rim enhancement is visible in close contact with the testis and hydrocele, representing an abscess formation. These radiological findings are critical for diagnosing complicated intrascrotal infections and differentiating them from simple epididymitis or testicular torsion. The image serves as an educational resource for identifying secondary signs of infection such as abscess development and reactive fluid accumulation within the tunica vaginalis.
Causes of Left Testicular Pain
🚨 Emergency - Rule Out First
1. Testicular Torsion
- Presentation: Sudden, severe unilateral pain; may radiate to lower abdomen or inguinal region; often wakes from sleep; associated nausea and vomiting
- Age peak: Bimodal - neonatal period and puberty (most common in adolescents)
- Key sign: Absent cremasteric reflex, high-riding testis, transverse lie (bell-clapper deformity)
- Viability: Drops sharply after 6 hours; near-zero at 24+ hours
- Diagnosis: Color Doppler ultrasound (absent/reduced blood flow). Sensitivity 96-100%, specificity 84-95%
- Treatment: Emergency surgical detorsion and bilateral orchidopexy
"Because of the potential for infarction and infertility, testicular torsion must be the primary consideration in acute scrotal pain." - Tintinalli's Emergency Medicine
Common Causes
2. Epididymitis / Epididymo-orchitis
- Cause:
- Age <35: Sexually transmitted - Chlamydia trachomatis, Neisseria gonorrhoeae
- Age >35: Enteric bacteria (E. coli) from UTI or urinary obstruction
- Men who practice insertive anal sex: enteric organisms regardless of age
- Presentation: Gradual-onset pain and swelling; starts at the cauda of epididymis and ascends; fever in ~26%; dysuria in ~1/3; 96% unilateral
- Exam: Tender, indurated epididymis; orchitis present in 50% of cases
- Ultrasound: Epididymal enlargement, hypervascularity ("thyroid storm / inferno" sign on Doppler), hydrocele
- Treatment: Ceftriaxone 250mg IM single dose + doxycycline 100mg PO twice daily x 10 days (STI cause); levofloxacin for enteric organisms
3. Torsion of the Appendix Testis
- Small embryological remnant on the upper pole of testis that can twist
- More common in children (age 7-14)
- Classic finding: "Blue dot sign" - a small, tender, blue nodule visible through the scrotal skin at the upper pole
- Less severe than testicular torsion; usually managed conservatively
4. Orchitis
- Mumps orchitis: Most common in post-pubertal males; usually occurs 4-8 days after parotitis; unilateral in 70%
- Viral orchitis: Coxsackievirus, EBV, varicella
- Bacterial: Secondary to epididymitis spreading to the testis
- Granulomatous: Tuberculosis, syphilis (gummatous orchitis)
Other Important Causes
| Condition | Key Features |
|---|---|
| Varicocele | "Bag of worms" feel on palpation; dull aching; left side more common (left gonadal vein drains at 90° into left renal vein); worsens on standing, eases on lying |
| Inguinal hernia | Groin/scrotal pain; bowel in scrotum; does not transilluminate; risk of incarceration |
| Trauma | History of direct blow; haematocele or haematoma; can rupture tunica albuginea |
| Testicular tumour | Usually painless solid mass; 20-30% have dull ache; most common cancer in men aged 15-35 |
| Hydrocele (reactive) | Fluid collection around testis; transilluminates; secondary to infection/torsion/tumour |
| Spermatocele | Non-tender cystic mass above/behind testis; transilluminates |
| Fournier gangrene | Necrotising fasciitis of perineum/scrotum; emergency; skin necrosis, crepitus, sepsis |
Referred Pain to the Testis (Extra-scrotal Causes)
| Source | Mechanism |
|---|---|
| Ureteric calculus | Left ureter stone causes colicky referred testicular pain + loin pain + haematuria |
| Renal pathology | Left kidney stone, hydronephrosis, pyelonephritis |
| Retroperitoneal masses | Lymphoma, aortic aneurysm compressing genitofemoral nerve |
| Left renal vein obstruction | Can cause acute left varicocele - "secondary varicocele" - must be investigated if new-onset in adult |
| Inguinal hernia | Direct pressure on spermatic cord |
| Lumbar disc herniation | L1-L2 nerve root - ilioinguinal/genitofemoral nerve compression |
Approach Summary
Left testicular pain
       ↓
Is onset sudden and severe?
  → YES → TORSION until proven otherwise
           Doppler US + urgent urology
  → NO  → Consider:
           • Gradual onset + fever + STI risk → Epididymitis
           • Child, blue dot sign → Appendix torsion
           • Dull ache, varicose feel → Varicocele
           • Colicky loin pain + haematuria → Ureteric stone
           • Painless solid mass → Tumour
           • History of trauma → Haematocele / rupture

Give answer to the essays for 10 marks with diagrams
- Cardiac cycle
- Nerve conduction study
- Urinary bladder physiology and types of bladder dysfunction
- Zero order kinetics
- Coagulation pathways
- Blood brain barrier - Anatomy and clinical significance
- Primary immune deficiency syndromes
- Significance of urine analysis
- Clinical trials for drugs
- Hypersensitivity reactions
cardiac cycle Wiggers diagram pressure volume heart sounds
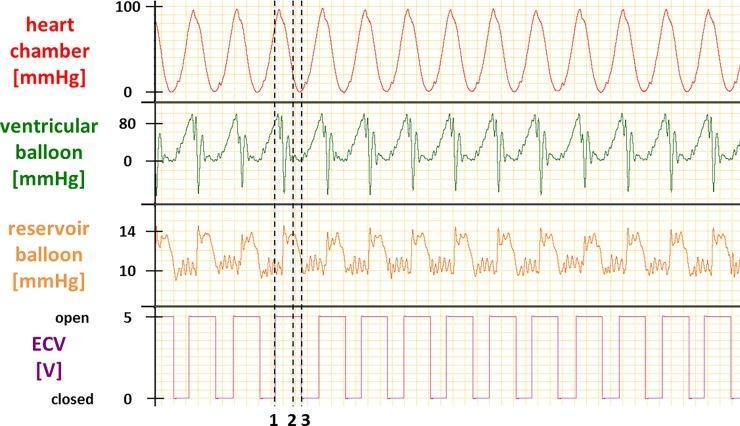
A multi-panel line graph illustrating the physiological mechanics of an in vitro cardiac loading device (CLD) used to simulate ventricular pressure-volume relationships. The visualization consists of four vertically aligned time-series plots depicting a cyclical cardiac simulator test. The top panel shows heart chamber pressure oscillating between 0 and 100 mmHg. The second panel displays ventricular balloon (VB) pressure, reaching peaks of approximately 80 mmHg. The third panel tracks reservoir balloon (RB) pressure, which fluctuates between 10 and 14 mmHg. The bottom panel indicates the status of an electronic check valve (ECV) as a binary voltage (0V for closed, 5V for open). Vertical dashed lines (labeled 1, 2, and 3) correlate specific phases: (1) ECV opening when VB pressure exceeds afterload, leading to VB emptying and RB filling; (2) VB refilling when VB pressure drops below RB pressure; and (3) ECV closure upon completion of refilling. This diagram is utilized in cardiovascular physiology research to validate cardiac cycle simulation for isolated heart preparations.
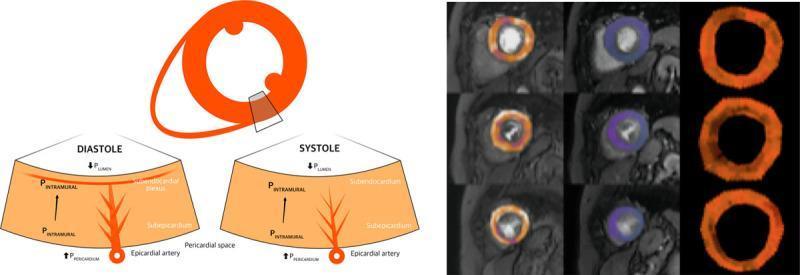
This composite educational graphic details the pathophysiology of myocardial perfusion and coronary hemodynamics. Panel A features a pathophysiology diagram illustrating the extravascular forces and intraluminal pressures affecting the myocardial layers during the cardiac cycle. It compares diastole and systole, highlighting the differences in intramural pressure (PINTRAMURAL), left ventricular lumen pressure (PLUMEN), and pericardial space pressure (PPERICARDIUM). The diagram shows the subendocardial plexus and epicardial artery, emphasizing greater subendocardial compression and reduced vascular volume during systole. Panel B presents a cardiac perfusion quantification map from a patient with aortic stenosis (AS). The map is organized in a grid: rows represent basal, mid, and apical short-axis slices of the left ventricle; columns demonstrate stress perfusion, rest perfusion, and myocardial perfusion reserve (MPR). The color-coded mapping shows regional perfusion distribution, with the MPR column specifically highlighting global limitations in perfusion reserve. This visual is designed for medical education focusing on cardiovascular hemodynamics, coronary microcirculation, and the physiological impact of valvular heart disease on myocardial blood flow.
coagulation cascade intrinsic extrinsic pathway fibrin clot formation
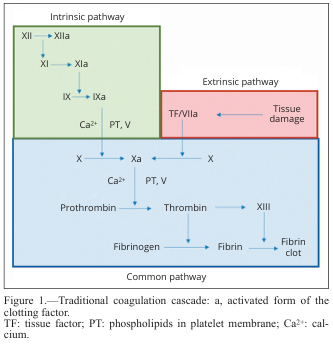
Summary : This diagram illustrates the traditional coagulation cascade, detailing the sequence of events and factors involved in blood clotting via the intrinsic, extrinsic, and common pathways. flowchart: # Pathways : • Intrinsic pathway (green box): Initiated by factor XII, proceeds through XI, IX, and VIII, with activation steps indicated by "a" (e.g., XIIa, XIa, IXa). • Extrinsic pathway (red box): Initiated by tissue damage, which activates tissue factor (TF) and factor VIIa. • Common pathway (blue box): Both intrinsic and extrinsic pathways converge at factor X, leading to the activation of prothrombin to thrombin, which then converts fibrinogen to fibrin, forming a fibrin clot. # Nodes : • XII → XIIa (Intrinsic) • XI → XIa (Intrinsic) • IX → IXa (Intrinsic) • Ca²⁺, PT, V (Intrinsic, Common) • TF/VIIa (Extrinsic) • Tissue damage (Extrinsic) • X → Xa (Common) • Prothrombin → Thrombin (Common) • Fibrinogen → Fibrin (Common) • XIII (Common) • Fibrin clot (Common) # Connectors : • Arrows indicate the direction of activation or conversion between factors. • Intrinsic and extrinsic pathways both feed into the activation of factor X in the common pathway. • Ca²⁺ and PT, V are required cofactors at specific steps. # Layout : • Three main colored sections: green (intrinsic, top left), red (extrinsic, top right), blue (common, bottom). • Flow proceeds from top (initiation) to bottom (clot formation). • Arrows show sequential activation and convergence of pathways. # Analysis : • The diagram clearly separates the intrinsic and extrinsic initiation mechanisms, both converging on the common pathway at factor X. • The cascade is highly sequential, with each activated factor catalyzing the next step. • Calcium ions (Ca²⁺) and phospholipids (PT) are essential cofactors at multiple steps. • The final outcome is the formation of a stable fibrin clot, highlighting the coordinated nature of the coagulation process.
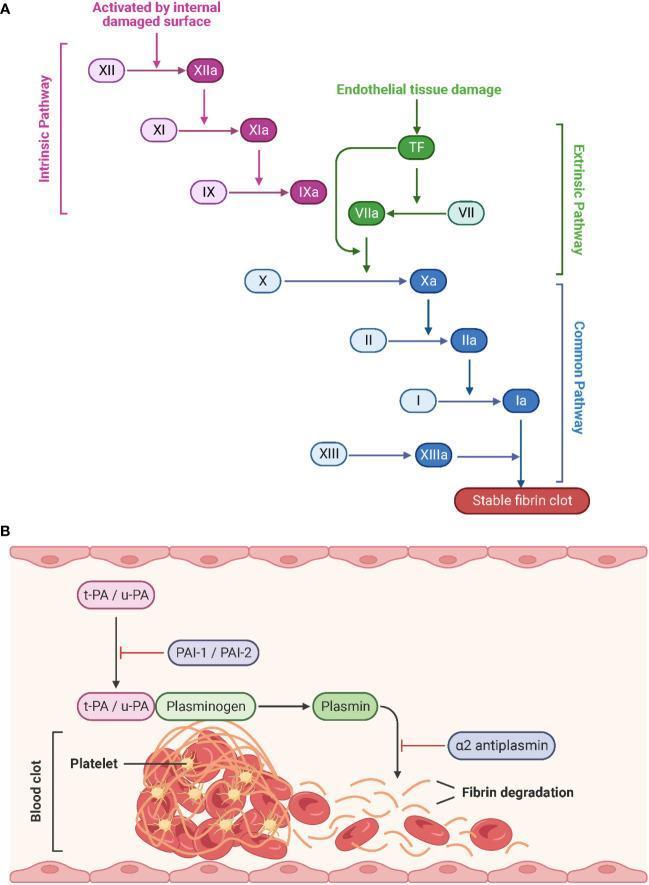
This medical schematic illustrates the physiological processes of hemostasis and fibrinolysis. Part A depicts the Coagulation Cascade, divided into the Intrinsic, Extrinsic, and Common pathways. The Intrinsic pathway (purple) is triggered by internal damaged surfaces, activating Factor XII to XIIa, followed by XI and IX. The Extrinsic pathway (green) begins with endothelial tissue damage and Tissue Factor (TF), activating Factor VII to VIIa. Both pathways converge at the Common pathway (blue) starting with the activation of Factor X to Xa. This leads to the conversion of prothrombin (II) to thrombin (IIa), and fibrinogen (I) to fibrin (Ia), culminating in a stable fibrin clot stabilized by Factor XIIIa. Activated factors are denoted by an 'a' suffix. Part B illustrates Fibrinolysis, where tissue-type (t-PA) and urokinase-type (u-PA) plasminogen activators convert plasminogen to plasmin, which then degrades the fibrin network of the blood clot. Inhibitory regulators including PAI-1, PAI-2, and ̡2-antiplasmin are also shown. The diagram represents the structural breakdown of a clot containing platelets and red blood cells into fibrin degradation products.
hypersensitivity reactions type 1 2 3 4 classification diagram
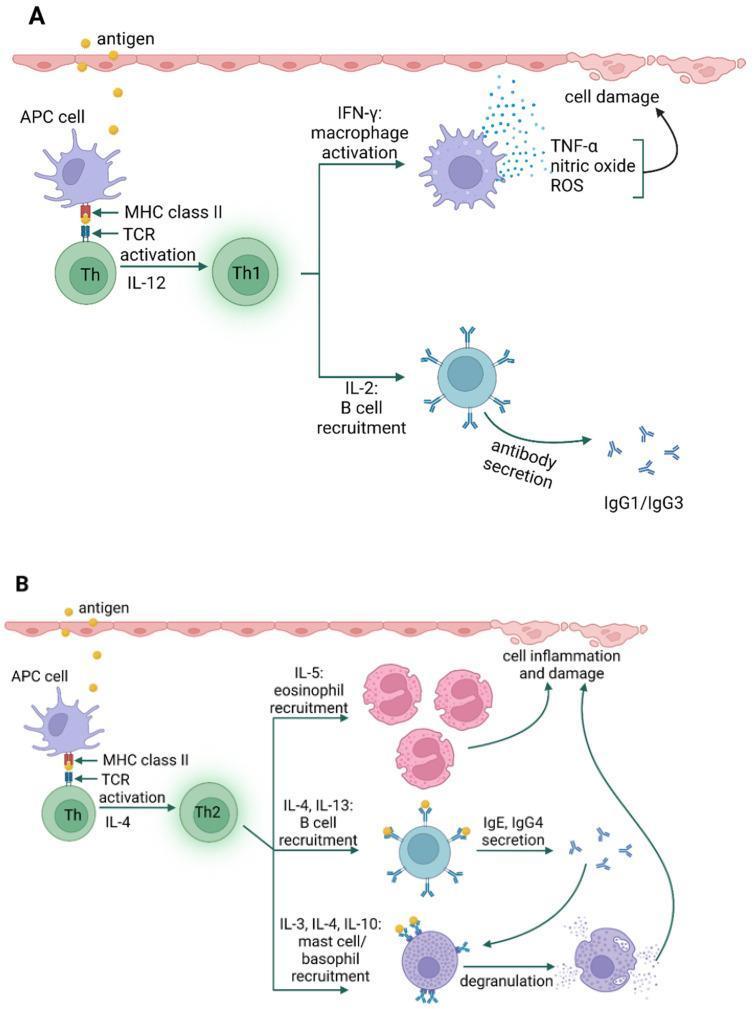
A pathophysiology diagram illustrating the cellular mechanisms and signaling pathways of Type IVa and Type IVb hypersensitivity reactions. Panel A (Type IVa) shows an antigen-presenting cell (APC) interacting with a T helper cell (Th) via MHC class II and TCR. IL-12 signaling leads to Th1 differentiation. Th1 cells release IFN-gamma to activate macrophages, which secrete TNF-alpha, nitric oxide, and reactive oxygen species (ROS) resulting in cell damage. Th1 cells also release IL-2 for B cell recruitment and IgG1/IgG3 antibody secretion. Panel B (Type IVb) depicts Th2 differentiation mediated by IL-4. Th2 cells release IL-5 for eosinophil recruitment, contributing to inflammation and damage. They also produce IL-4 and IL-13 for B cell recruitment leading to IgE and IgG4 secretion, as well as IL-3, IL-4, and IL-10 for mast cell and basophil recruitment and degranulation. The diagram utilizes standard immunological symbols to demonstrate delayed-type hypersensitivity pathways relevant to conditions like contact dermatitis and allergic drug reactions.
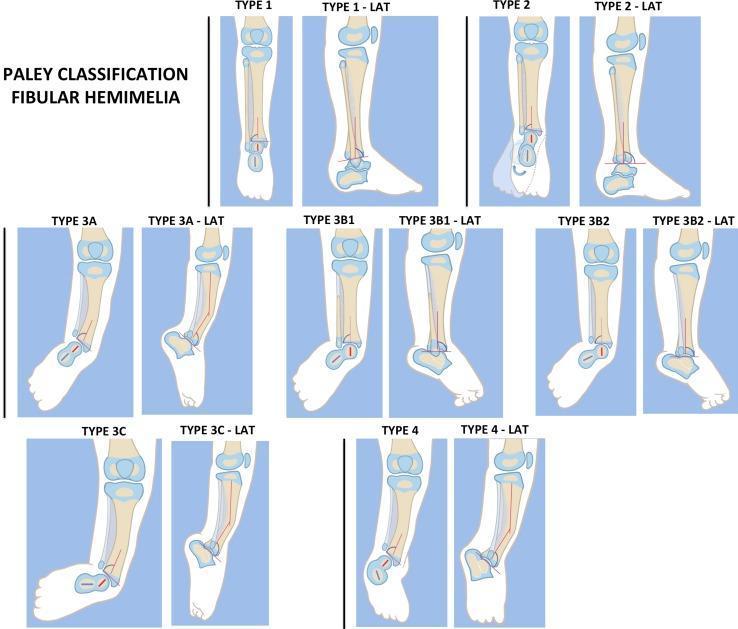
This medical illustration presents the Paley classification system for fibular hemimelia, a congenital deficiency of the fibula. The diagram is organized by anatomical severity, featuring both anterior (AP) and lateral (LAT) views for each type. Type 1 shows a stable ankle with a nearly full-length fibula. Type 2 illustrates dynamic valgus instability where the distal fibular physis is proximal to the ankle joint line. Type 3 is characterized by fixed equino-valgus deformities and is subdivided: 3A (ankle type) showing distal tibial malorientation; 3B (subtalar type) involving subtalar coalition with (3B1) or without (3B2) a visible distal fibular remnant; and 3C (combined) featuring both tibial and subtalar malalignment. Type 4 depicts a fixed equino-varus deformity with subtalar coalition. Key visual markers include the mechanical axis of the tibia (red line), the orientation of the distal tibial physis, the presence/absence of the fibula, and the articulation of the talus and calcaneus. This orthopedic diagram serves as a clinical guideline for reconstructive surgical planning in pediatric lower limb deficiencies.
blood brain barrier anatomy astrocyte tight junction
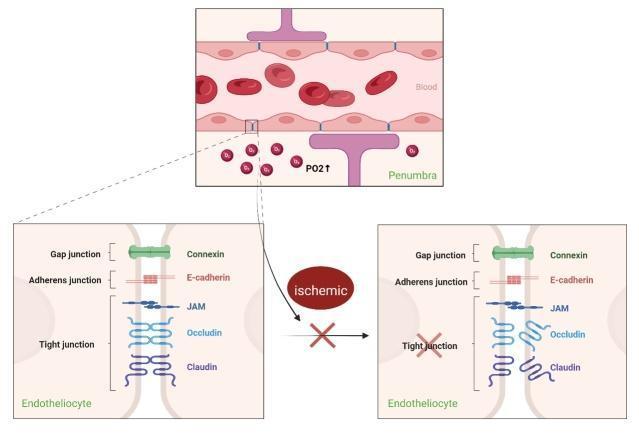
This pathophysiology diagram illustrates the structural integrity of the blood-brain barrier (BBB) and the impact of ischemia on endothelial junctions. The top panel shows a cerebral capillary containing erythrocytes, surrounded by endotheliocytes and astrocyte foot processes within the penumbra region, highlighting increased partial pressure of oxygen (PO2). A magnified comparative view demonstrates the intercellular junctional complex between endotheliocytes. On the left ('before' state), the intact BBB consists of gap junctions (Connexin), adherens junctions (E-cadherin), and tight junctions (JAM, Occludin, and Claudin) maintaining paracellular seal. The right panel depicts the 'ischemic' state, where the tight junction proteins Occludin and Claudin show visible fragmentation and loss of continuity, signifying increased BBB permeability and structural breakdown. This medical illustration is designed to explain the mechanisms of BBB disruption in acute ischemic stroke and the potential protective role of Normobaric Hyperoxia (NBHO) in slowing the degradation of tight junction proteins (TJP) and matrix metalloproteinase-9 induction.
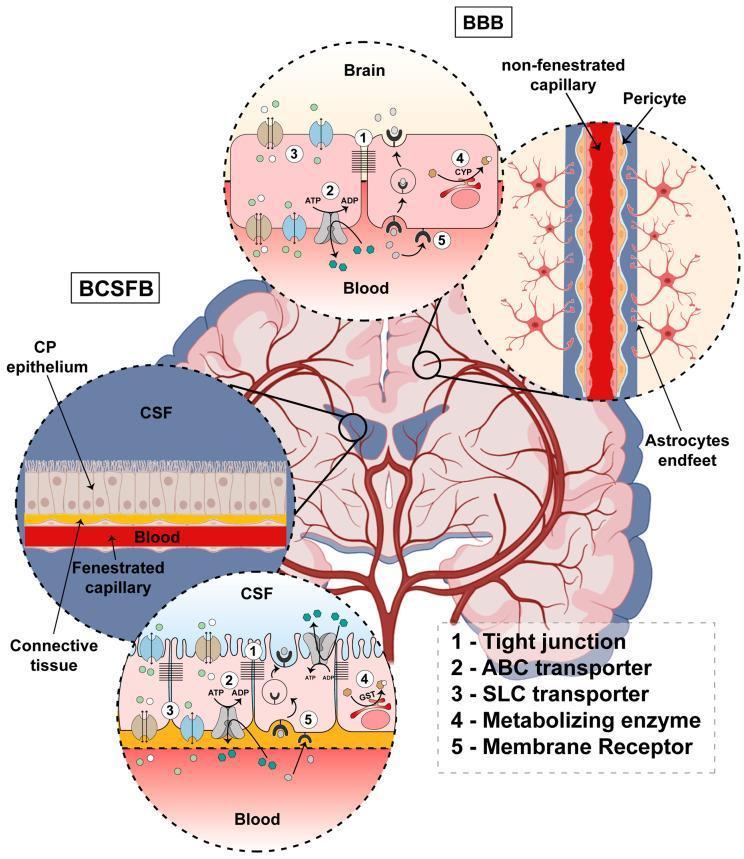
A medical pathophysiology diagram illustrating the comparative structural and molecular anatomy of the Blood-Brain Barrier (BBB) and the Blood-Cerebrospinal Fluid Barrier (BCSFB). The central image shows a sagittal view of the human brain with callouts for each barrier. The BBB section depicts a non-fenestrated capillary lined by brain capillary endothelial cells, surrounded by pericytes and astrocyte endfeet. In contrast, the BCSFB section shows the choroid plexus (CP) epithelium as a monolayer of cuboidal cells overlying highly vascularized connective tissue containing fenestrated capillaries. Both barriers feature a detailed cellular view highlighting five key molecular hallmarks: (1) Tight junctions for paracellular restriction, (2) ABC transporters (efflux pumps using ATP), (3) SLC transporters for facilitated or active transport, (4) Metabolizing enzymes (e.g., CYP and GST) for chemical modification, and (5) Membrane receptors for endocytosis and transcytosis. This infographic serves as an educational tool for neurovascular physiology and pharmacology.
urinary bladder innervation micturition reflex neural control
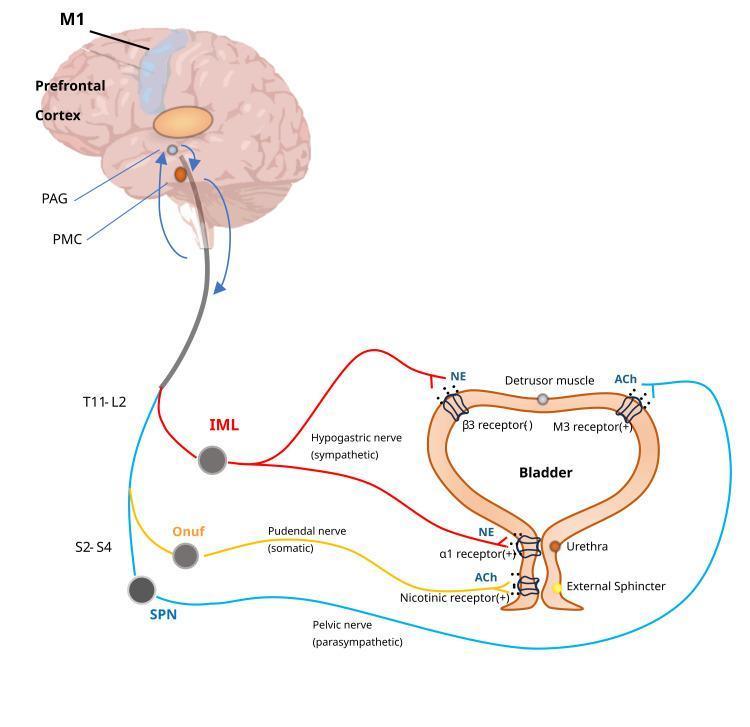
This medical illustration depicts the neural control of the lower urinary tract, specifically the micturition reflex and voluntary bladder control. It shows the hierarchical integration between the brain (primary motor cortex M1, prefrontal cortex, periaqueductal gray PAG, and pontine micturition center PMC) and the spinal cord. The diagram illustrates three distinct pathways: 1) The sympathetic pathway (red), originating from the T11-L2 intermediolateral cell column (IML) via the hypogastric nerve, releasing norepinephrine (NE) to inhibit the detrusor muscle (beta-3 receptors) and contract the bladder neck (alpha-1 receptors). 2) The parasympathetic pathway (blue), originating from the S2-S4 sacral parasympathetic nucleus (SPN) via the pelvic nerve, releasing acetylcholine (ACh) to contract the detrusor muscle (M3 receptors). 3) The somatic motor pathway (yellow), originating from Onuf's nucleus (S2-S4) via the pudendal nerve, releasing ACh to contract the external urethral sphincter (nicotinic receptors). This diagram serves as a pathophysiology and anatomical guide to neurogenic bladder and the physiological mechanisms of urination.
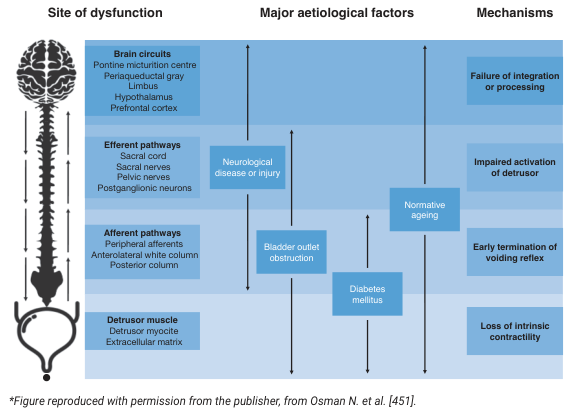
Summary : This figure illustrates the sites of dysfunction in the neural control of the lower urinary tract, the major aetiological factors contributing to these dysfunctions, and the resulting mechanisms of bladder dysfunction. It visually links anatomical/functional sites, causes, and pathophysiological outcomes. flowchart: # Sites of Dysfunction : • Brain circuits: Pontine micturition centre, Periaqueductal gray, Limbic system, Hypothalamus, Prefrontal cortex. • Efferent pathways: Sacral cord, Sacral nerves, Pelvic nerves, Postganglionic neurons. • Afferent pathways: Peripheral afferents, Anterolateral white column, Posterior column. • Detrusor muscle: Detrusor myocyte, Extracellular matrix. # Major Aetiological Factors : • Neurological disease or injury (affecting brain circuits, efferent, and afferent pathways). • Bladder outlet obstruction (affecting efferent and afferent pathways). • Diabetes mellitus (affecting afferent pathways and detrusor muscle). • Normative ageing (affecting all sites). # Mechanisms : • Failure of integration or processing (linked to brain circuits). • Impaired activation of detrusor (linked to efferent pathways). • Early termination of voiding reflex (linked to afferent pathways). • Loss of intrinsic contractility (linked to detrusor muscle). # Connectors : • Vertical arrows connect each site of dysfunction to its corresponding aetiological factors and mechanisms. • Some aetiological factors (e.g., neurological disease or injury, normative ageing) span multiple sites and mechanisms. # Layout : • Three main columns: Site of dysfunction (left), Major aetiological factors (center), Mechanisms (right). • Rows correspond to anatomical/functional levels from brain to bladder muscle. • Arrows indicate causal or contributory relationships across columns. # Analysis : • The diagram highlights that bladder dysfunction can arise from multiple neural and muscular sites, with overlapping aetiological factors such as neurological disease, outlet obstruction, diabetes, and ageing. • Mechanisms of dysfunction are specific to the site affected, but some factors (e.g., ageing) can impact all levels. • The flowchart structure clarifies how different diseases or injuries can lead to specific bladder dysfunction mechanisms by affecting distinct anatomical pathways.
nerve conduction study electromyography waveform motor sensory
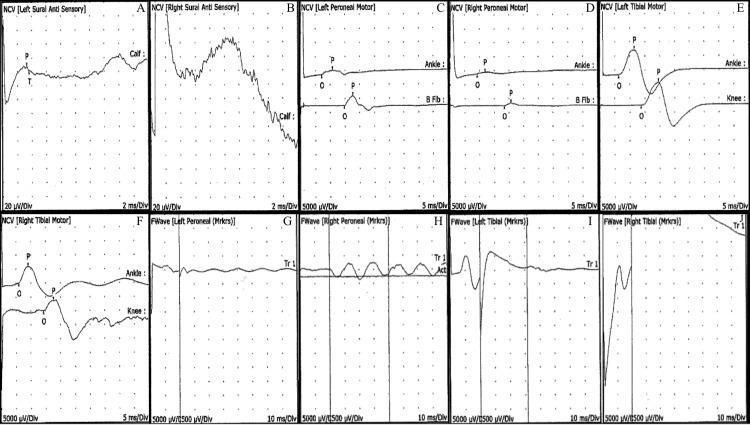
A composite panel of electrodiagnostic waveforms from a nerve conduction study (NCS) and F-wave analysis in a clinical setting. Panels A and B display sensory nerve conduction velocity (NCV) waveforms for the left and right sural nerves, respectively; Panel A shows a defined sensory nerve action potential (SNAP) while Panel B demonstrates significant dispersion and baseline instability. Panels C through F represent motor NCV studies of the left and right peroneal and tibial nerves, showing compound muscle action potentials (CMAPs) with markers for onset (O) and peak (P) at ankle, knee, and fibular head (B Fib) stimulation sites. Panels G through J display late response F-wave studies for the bilateral peroneal and tibial nerves. Notably, Panel G shows an absent or severely diminished F-wave response in the left peroneal nerve, while Panel J shows a highly irregular, high-amplitude waveform in the right tibial nerve. These findings are used to evaluate peripheral neuropathies, demyelinating conditions like Guillain-Barré Syndrome (GBS), or axonal injury.
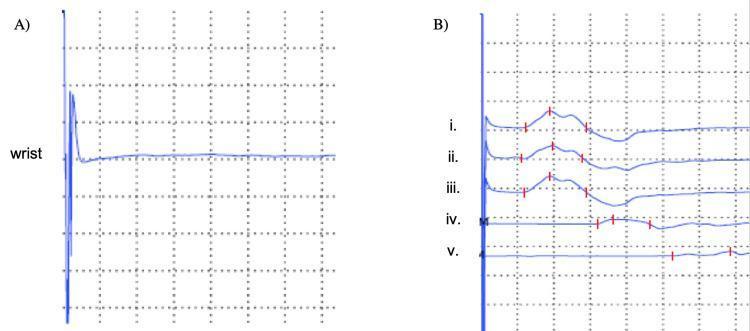
This diagnostic image displays a nerve conduction study (NCS) of the right ulnar nerve, divided into sensory (A) and motor (B) components. Panel A shows the sensory nerve action potential (SNAP) recording at the wrist, characterized by a stimulus artifact followed by a flat baseline, indicating a lack of sensory response. Panel B illustrates motor nerve conduction tracings (CMAP) from five stimulation points: (i-iii) wrist, (iv) below the elbow, and (v) above the elbow. The motor tracings reveal significant pathology: traces i-iii show reduced distal amplitudes and prolonged distal latency, while traces iv and v demonstrate severe attenuation of the waveform and marked slowing of conduction velocity. This pattern of partial conduction block and reduced amplitude across the elbow is diagnostic of severe cubital tunnel syndrome or ulnar neuropathy at the elbow with mixed axonal and demyelinating features. Red vertical hash marks indicate latency and peak markers used for quantitative analysis in clinical neurophysiology.
primary immunodeficiency syndromes classification B cell T cell
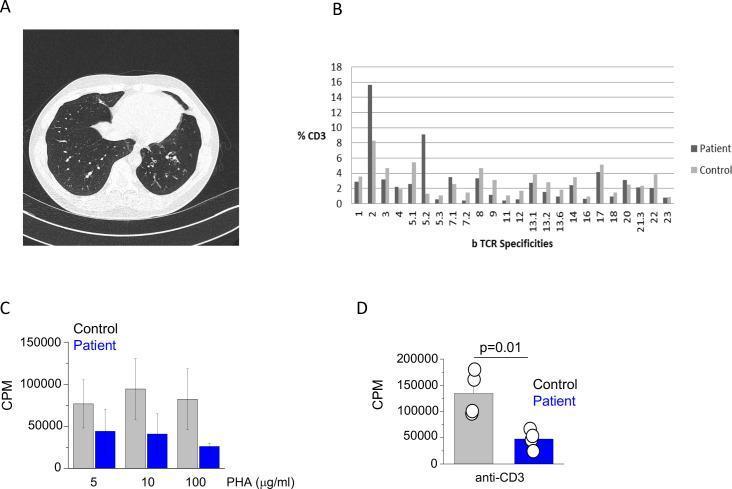
This composite educational figure illustrates clinical imaging and immunological findings for a patient with a suspected primary immunodeficiency. Panel A is an axial chest CT scan showing the basal segments of the lungs. The image highlights cylindrical bronchiectasis in the left lower lobe, characterized by dilated, non-tapering bronchi presenting as tubular radiolucencies extending toward the periphery. Panel B displays a TCR repertoire analysis via spectratyping, comparing TCR specificities between the patient and a control group to assess T-cell receptor diversity. Panels C and D are bar graphs representing functional T-cell assays measured in counts per minute (CPM). Panel C compares T-cell proliferation in response to varying concentrations of Phytohaemagglutinin (PHA). Panel D shows proliferation in response to anti-CD3 stimulation, indicating a statistically significant reduction in the patient’s T-cell response compared to the control (p=0.01). Together, these panels correlate structural lung damage (bronchiectasis) with quantitative defects in cellular immunity, specifically impaired T-cell proliferative capacity, common in patients with panhypogammaglobulinaemia.
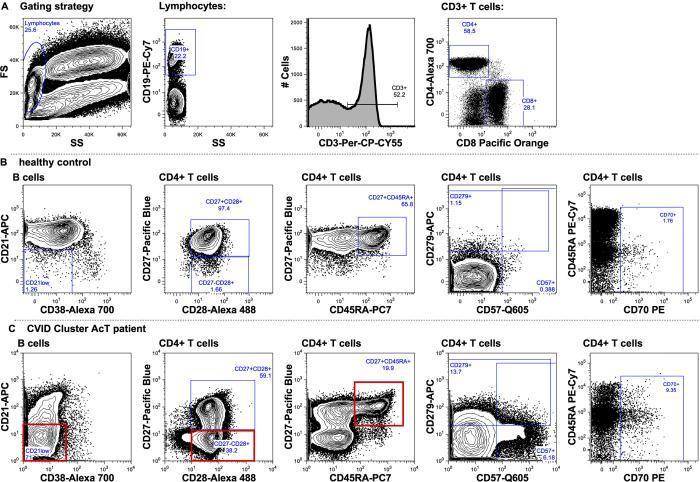
This diagnostic image displays multiparametric flow cytometry contour plots illustrating the immunophenotypic signature of Common Variable Immunodeficiency (CVID), specifically the 'AcT' cluster. The panel is organized into three rows: (A) Initial gating strategy for lymphocytes, CD19+ B cells, and CD3+ T cells; (B) Healthy control reference; and (C) CVID AcT patient profile. Key diagnostic hallmarks highlighted in red boxes for the AcT patient include a significant expansion of CD21low B cells (CD21-APC vs CD38-Alexa 700) and a shift in CD4+ T cell differentiation. Specifically, the patient shows a depletion of naive T cells (CD27+CD45RA+) and an expansion of intermediate memory T cells (CD27-CD28+). Additional plots demonstrate increased expression of senescence and activation markers, such as CD279 (PD-1), CD57, and CD70, in the patient's CD4+ T cell compartment. This visual comparison emphasizes the 'immunophenotypic aging' and chronic activation characteristic of certain CVID subsets, facilitating clinical classification and pathophysiological study of primary immunodeficiencies.
DR NTRUHS General Medicine Paper-I — Essay Answers (10 Marks Each)
Q1. Cardiac Cycle
Definition
Phases of the Cardiac Cycle (7 phases)
| Phase | Events | ECG | Valves | Heart Sounds |
|---|---|---|---|---|
| A - Atrial Systole | Atria contract; final ventricular filling | P wave | - | S4 (if audible) |
| B - Isovolumetric Ventricular Contraction | Ventricles contract; pressure rises; no volume change | QRS complex | Mitral closes | S1 |
| C - Rapid Ventricular Ejection | Max pressure; blood ejected to aorta | ST segment | Aortic opens | - |
| D - Reduced Ventricular Ejection | Slow ejection; min ventricular volume | T wave | - | - |
| E - Isovolumetric Ventricular Relaxation | Ventricles relax; pressure falls; no volume change | - | Aortic closes | S2 |
| F - Rapid Ventricular Filling | Passive filling from atria | - | Mitral opens | S3 (pathological) |
| G - Reduced Ventricular Filling (diastasis) | Slow filling; heart rate determines duration | - | - | - |
Diagram - Wiggers Diagram (Key Parameters)
                 SYSTOLE              DIASTOLE
           |___B_|__C__|_D_|_E_|____F____|_G_|_A_|

Pressure
(mmHg)   120|         /\  Aortic
         80 |    /\__/  \/___________
         10 |___/  LV        LA

Volume
(mL)     130|          \___________
         65 |____/               \___

ECG          P   QRS    T

Heart Sounds     S1        S2    S3  S4
Key Points
- Systole = phases B, C, D (ventricular contraction + ejection)
- Diastole = phases E, F, G, A (relaxation + filling)
- Stroke Volume = End-Diastolic Volume (EDV) - End-Systolic Volume (ESV) = ~130 - 65 = ~65 mL
- Ejection Fraction (EF) = SV/EDV × 100 = ~55-70% (normal)
- S1 = closure of mitral + tricuspid valves (onset of systole)
- S2 = closure of aortic + pulmonary valves (onset of diastole)
- S3 = rapid ventricular filling (normal in children; indicates heart failure in adults)
- S4 = atrial contraction against stiff ventricle (hypertrophy, heart failure)
- a wave on venous pulse = atrial contraction
- c wave = tricuspid valve bulging into atrium
- v wave = venous filling during ventricular systole
Clinical Significance
- Prolonged isovolumetric contraction = reduced cardiac output
- Atrial fibrillation abolishes the P wave and a wave
- Aortic stenosis: slow-rising pulse, prolonged ejection phase
- Mitral regurgitation: pansystolic murmur (blood flows back during entire systole)
Q2. Nerve Conduction Study (NCS)
Definition
Types of NCS
- Stimulate nerve at two points (distal and proximal)
- Record Compound Muscle Action Potential (CMAP) from muscle
- Measures: Distal Latency, Conduction Velocity, Amplitude
- Stimulate nerve distally; record Sensory Nerve Action Potential (SNAP) proximally (orthodromic) or vice versa (antidromic)
- Measures: Peak Latency, Amplitude, Velocity
How NCS is Performed
Diagram: Motor NCS Setup

  Stimulator         Ground       Recording Electrode
     |                 |               |
  [NERVE]----tissue----[MUSCLE]----[EARTH]

  Distal stimulation → Distal Latency (ms)
  Proximal stimulation → Proximal Latency (ms)

  Conduction Velocity (m/s) = Distance / (Proximal Latency - Distal Latency)
Normal Values
- Motor conduction velocity: >50 m/s (median, ulnar, peroneal)
- Sensory conduction velocity: >50 m/s
- Distal motor latency (median): < 4.2 ms
- CMAP amplitude (median motor): > 4 mV
- SNAP amplitude (median sensory): > 10 µV
NCS Patterns in Disease
| Disease | Velocity | Amplitude | Latency |
|---|---|---|---|
| Demyelination (e.g., GBS, CIDP) | Very slow | Normal/reduced | Prolonged |
| Axonal damage (e.g., diabetic neuropathy) | Normal/mildly slow | Reduced | Normal/mildly prolonged |
| Carpal tunnel syndrome | Slow across wrist | Reduced | Prolonged distally |
| Normal | >50 m/s | Normal | Normal |
Clinical Uses
- Diagnosis of carpal tunnel syndrome, ulnar neuropathy
- Peripheral neuropathies (diabetic, alcoholic, uremic)
- Guillain-Barré syndrome
- Radiculopathy (combined with EMG)
- Myasthenia gravis (repetitive stimulation test)
Q3. Urinary Bladder Physiology and Types of Bladder Dysfunction
Normal Bladder Physiology
| Nerve | Origin | Neurotransmitter | Effect |
|---|---|---|---|
| Sympathetic | T11-L2 (hypogastric nerve) | Norepinephrine | Detrusor relaxation (β3); Internal sphincter contraction (α1) - STORAGE |
| Parasympathetic | S2-S4 (pelvic nerve) | Acetylcholine (M3) | Detrusor contraction - VOIDING |
| Somatic | S2-S4 (pudendal nerve, Onuf's nucleus) | Acetylcholine (nicotinic) | External sphincter contraction - VOLUNTARY CONTROL |
Micturition Reflex
Bladder fills → stretch receptors activated →
afferent signals to sacral cord (S2-S4) →
Pontine Micturition Centre (PMC) →
voluntary cortical decision →
Parasympathetic activation → Detrusor contracts →
Sympathetic inhibited → Internal sphincter opens →
Somatic inhibited → External sphincter opens →
VOIDING
Cystometrogram (CMG) - Bladder Filling Curve
Pressure
(cmH2O)
  40|                                          /| Void
  20|_________/\_____________________________/ |
  10|flat (compliance phase)                   |
   0|___________________________________________
     0    100   200   300   400  500 ml
                              ↑First desire ↑Urgency
Types of Bladder Dysfunction
| Type | Lesion Site | Features |
|---|---|---|
| Uninhibited neurogenic | Frontal cortex/corticospinal | Urgency, frequency, incontinence; detrusor hyperreflexia; CVA, Parkinson's |
| Reflex neurogenic | Above sacral cord (T6-L2) | No sensation, automatic voiding, DSD (Detrusor-sphincter dyssynergia); spinal cord injury |
| Autonomous neurogenic | Sacral cord/conus | Flaccid bladder, overflow incontinence, no reflex; cauda equina |
| Sensory neurogenic | Posterior columns/sensory roots | Loss of sensation, overdistension; tabes dorsalis, diabetes |
| Motor neurogenic | Anterior horn/motor roots | Cannot initiate micturition; polio, tumour |
Q4. Zero Order Kinetics
Definition
Comparison with First Order Kinetics
| Feature | Zero Order | First Order |
|---|---|---|
| Rate of elimination | Constant (fixed amount/time) | Proportional to concentration |
| Enzyme status | Saturated | Unsaturated |
| Half-life | Increases with dose (not constant) | Constant |
| Graph (concentration vs time) | Straight line (linear decay) | Exponential decline |
| Graph (log concentration vs time) | Curved | Straight line |
Diagram
Concentration (mg/L)

First Order:                Zero Order:
  100|  \                     100|  \
   80|    \                    80|   \
   60|      \   exponential    60|    \
   40|        \                40|     \  LINEAR
   20|          \              20|      \
    0|____________\             0|_______\
       Time                       Time

Log Conc vs Time:
First Order → STRAIGHT LINE
Zero Order → CURVED (downward concavity)
Michaelis-Menten Kinetics
- At low concentrations → first order (rate proportional to concentration)
- At high concentrations → zero order (enzymes saturated; constant Vmax)
- Most drugs follow first order, but at toxic/high doses shift to zero order
Classic Examples of Zero Order Kinetics
- Phenytoin - shifts to zero order at therapeutic doses (narrow therapeutic index)
- Ethanol (alcohol) - always zero order (~10 mL pure alcohol/hour)
- Aspirin - at high doses
- Heparin - at high doses
- Theophylline - at toxic levels
Clinical Importance
- No constant half-life → small dose increase = disproportionate rise in plasma levels
- Toxicity is unpredictable
- Monitoring of plasma drug levels is essential (e.g., phenytoin TDM)
- Doubling the dose does NOT double the effect linearly - can cause toxicity
Formula
- Zero order: dC/dt = -K₀ (where K₀ is a constant)
- Concentration: C(t) = C₀ - K₀·t
Q5. Coagulation Pathways
Definition
Two Pathways
- Initiated by Tissue Factor (TF/Factor III) released from damaged subendothelium
- TF + Factor VII → TF-VIIa complex → activates Factor X
- Tested by: PT (Prothrombin Time) / INR
- Initiated by contact with negatively charged surface (exposed collagen)
- Factor XII → XIIa → XI → XIa → IX → IXa (+ VIIIa + Ca²⁺ + PF3) → X
- Tested by: aPTT (Activated Partial Thromboplastin Time)
- Both converge at Factor X → Xa
- Xa + Va + Ca²⁺ + PF3 (Prothrombinase complex) → Prothrombin (II) → Thrombin (IIa)
- Thrombin → Fibrinogen (I) → Fibrin (Ia) → (Factor XIIIa crosslinks) → Stable Fibrin Clot
Diagram
Clotting Factors Summary
| Factor | Name |
|---|---|
| I | Fibrinogen |
| II | Prothrombin |
| III | Tissue Factor (Thromboplastin) |
| IV | Calcium (Ca²⁺) |
| V | Labile factor (Accelerin) |
| VII | Proconvertin (Extrinsic) |
| VIII | Anti-hemophilic factor A |
| IX | Christmas factor (Anti-hemophilic B) |
| X | Stuart-Prower factor |
| XI | Plasma thromboplastin antecedent |
| XII | Hageman factor |
| XIII | Fibrin stabilizing factor |
Anticoagulant Controls
- Antithrombin III (ATIII): Inhibits thrombin and Xa; enhanced by heparin
- Protein C + S: Inactivate Factors Va and VIIIa
- TFPI (Tissue Factor Pathway Inhibitor): Inhibits TF-VIIa complex
- Thrombomodulin: Binds thrombin → activates Protein C
Fibrinolysis
- Plasminogen → Plasmin (via t-PA, u-PA)
- Plasmin degrades fibrin → Fibrin Degradation Products (FDPs), including D-dimer
- D-dimer elevated in DVT, PE, DIC
Clinical Applications
| Condition | Abnormality |
|---|---|
| Hemophilia A | Factor VIII deficiency; prolonged aPTT |
| Hemophilia B | Factor IX deficiency; prolonged aPTT |
| Vitamin K deficiency | II, VII, IX, X reduced; PT prolonged first |
| DIC | All factors consumed; both PT and aPTT prolonged |
| Von Willebrand disease | Factor VIII and platelet adhesion defect |
Q6. Blood Brain Barrier (BBB) - Anatomy and Clinical Significance
Definition
Anatomical Structure

- Brain capillary endothelial cells - Non-fenestrated; connected by tight junctions (occludin, claudin, JAM proteins)
- Basement membrane - Type IV collagen, laminin, fibronectin
- Pericytes - Regulate blood flow and maintain BBB integrity
- Astrocyte end-feet (glia limitans) - Ensheath 99% of capillary surface; secrete factors maintaining tight junctions
Diagram: BBB Cross Section

BLOOD
  |
[Endothelial cell]===Tight Junction===[Endothelial cell]
  |                                           |
[Basement membrane]
  |
[Pericyte]
  |
[Astrocyte end-foot process]
  |
BRAIN INTERSTITIUM
What Crosses the BBB?
| Easily crosses | Does NOT cross |
|---|---|
| Lipid-soluble drugs (morphine, anaesthetics) | Large polar molecules |
| O₂, CO₂, alcohol | Most antibiotics |
| Glucose (via GLUT-1 transporter) | Proteins, albumin |
| Small non-ionized molecules | Most chemotherapy drugs |
| Steroid hormones | Catecholamines (L-DOPA given instead) |
Transport Mechanisms Across BBB
- Passive diffusion - Lipophilic, small, non-ionized molecules
- Carrier-mediated transport - Glucose (GLUT-1), amino acids (LAT-1)
- Receptor-mediated transcytosis - Insulin, transferrin
- Active efflux - P-glycoprotein pumps drugs back (e.g., MDR-1)
Circumventricular Organs (lack BBB)
Clinical Significance
| Condition | BBB Role |
|---|---|
| Meningitis/Encephalitis | Inflammation disrupts BBB → brain edema |
| Brain tumors | Disrupted BBB → contrast enhancement on MRI |
| Stroke (ischemia) | Hypoxia destroys tight junctions → cerebral edema |
| Alzheimer's disease | Amyloid-β accumulation; BBB dysfunction |
| Drug delivery | Challenges in treating CNS infections, tumors |
| L-DOPA (Parkinson's) | Dopamine can't cross; precursor L-DOPA crosses via LAT-1 |
| Mannitol | Opens BBB transiently via osmotic shrinkage |
| Focused Ultrasound | New technique to locally open BBB for drug delivery |
Q7. Primary Immune Deficiency Syndromes
Definition
Classification
PRIMARY IMMUNODEFICIENCIES
         |
    _____|___________________________________
   |           |            |               |
B-cell      T-cell     Combined        Phagocyte/
defects     defects    (B+T)           Complement
1. B-cell (Antibody) Deficiencies
| Disease | Defect | Features |
|---|---|---|
| X-linked Agammaglobulinemia (XLA / Bruton's) | BTK gene mutation → No B cells | Boys only; recurrent bacterial infections after 6 months; absent tonsils/lymph nodes; very low all Ig classes |
| Common Variable Immunodeficiency (CVID) | B cells present but fail to mature to plasma cells | Adults; recurrent sinopulmonary infections; low IgG, IgA, IgM; risk of lymphoma |
| Selective IgA Deficiency | Low serum IgA (<7 mg/dL) | Most common PID; recurrent respiratory/GI infections; anaphylaxis to blood transfusion |
| Hyper-IgM Syndrome | CD40L defect (X-linked) | Normal/high IgM; absent IgG, IgA, IgE; Pneumocystis, Cryptosporidium infections |
2. T-cell Deficiencies
| Disease | Defect | Features |
|---|---|---|
| DiGeorge Syndrome | Chromosome 22q11 deletion → thymic aplasia | No T cells; hypocalcemia (absent parathyroids); conotruncal heart defects; characteristic facies |
| Chronic Mucocutaneous Candidiasis | STAT1/IL-17 pathway | Persistent Candida infections of skin/mucosae; normal immunity otherwise |
3. Combined (T + B Cell) Deficiencies
| Disease | Defect | Features |
|---|---|---|
| SCID (Severe Combined Immunodeficiency) | ADA deficiency (50%), γ-chain mutation | "Bubble boy"; absent T, B, NK cells; susceptible to all pathogens; fatal without BMT |
| Wiskott-Aldrich Syndrome | WASp gene (X-linked) | Triad: thrombocytopenia + eczema + recurrent infections; elevated IgA/IgE, low IgM |
| Ataxia-Telangiectasia | ATM gene (DNA repair) | Cerebellar ataxia + telangiectasias + recurrent infections; IgA/IgG deficiency; ↑AFP |
4. Phagocyte Defects
| Disease | Defect | Features |
|---|---|---|
| Chronic Granulomatous Disease (CGD) | NADPH oxidase deficiency | Recurrent infections with catalase-positive organisms (Staph, Aspergillus); granuloma formation; NBT test negative |
| Chediak-Higashi | LYST gene → giant lysosomes | Partial albinism + recurrent infections + neurologic defects |
| Leukocyte Adhesion Deficiency (LAD) | CD18 (β-integrin) defect | Delayed cord separation; no pus formation; very high WBC; recurrent bacterial infections |
5. Complement Deficiencies
| Factor | Disease |
|---|---|
| C1q, C2, C4 deficiency | SLE-like autoimmune disease |
| C3 deficiency | Severe recurrent bacterial infections |
| C5-C9 (MAC) deficiency | Recurrent Neisseria (meningococcal/gonococcal) infections |
Treatment
- Antibody deficiencies: IV/SC immunoglobulin replacement (IVIG)
- SCID: Hematopoietic Stem Cell Transplantation (HSCT) - treatment of choice
- ADA-SCID: Gene therapy / ADA enzyme replacement
- CGD: IFN-γ, prophylactic antifungals/antibiotics
Q8. Significance of Urine Analysis
Definition
Components of Urinalysis
| Parameter | Normal | Abnormal / Significance |
|---|---|---|
| Color | Pale yellow to amber | Red = hematuria/myoglobinuria; Frothy = proteinuria; Dark brown = bilirubinuria (jaundice); Milky = pyuria/chyluria |
| Clarity | Clear | Turbid = cells, bacteria, crystals |
| Specific Gravity | 1.003-1.030 | Fixed at 1.010 = renal tubular disease; High = dehydration, DM; Low = diabetes insipidus |
| Odor | Mild, characteristic | Sweet/fruity = ketones (DKA); Fishy = bacterial infection; Mousy = PKU |
| Volume | 600-2500 mL/day | Oliguria (<400), Anuria (<100), Polyuria (>3L) |
| Test | Normal | Significance |
|---|---|---|
| pH | 4.5-8.0 | Acid = acidosis, uric acid stones; Alkaline = UTI (Proteus), RTA, struvite stones |
| Protein | Absent/trace | Proteinuria → nephritis, nephrotic syndrome, DM nephropathy |
| Glucose | Absent | Glycosuria → DM, Fanconi syndrome, renal threshold ↓ |
| Ketones | Absent | DKA, starvation, vomiting |
| Blood | Absent | Hematuria → UTI, stones, tumor, GN, trauma |
| Bilirubin | Absent | Conjugated jaundice (hepatitis, obstructive) |
| Urobilinogen | Trace | ↑ = hemolysis, hepatitis; Absent = complete bile duct obstruction |
| Nitrite | Absent | Bacterial infection (Gram-negative) |
| Leukocyte esterase | Absent | WBCs present → UTI, pyelonephritis |
| Finding | Significance |
|---|---|
| RBC casts | Glomerulonephritis (PATHOGNOMONIC) |
| WBC casts | Pyelonephritis, interstitial nephritis |
| Granular casts | ATN, advanced renal disease |
| Hyaline casts | Normal/mild proteinuria/dehydration |
| Waxy casts | Chronic renal failure, advanced disease |
| Fatty casts | Nephrotic syndrome |
| Epithelial casts | ATN |
| Bacteria | UTI (>10⁵ cfu/mL significant) |
Diagram: Urine Microscopy - Casts

  RBC Cast         WBC Cast        Granular Cast
  [====RBCs===]    [====WBCs===]   [:::granules:::]
  Glomerulonephritis  Pyelonephritis   ATN/CKD
Clinical Uses of Urinalysis
- Diagnosis of UTI - pyuria, bacteriuria, nitrites, leukocyte esterase
- Diagnosis of renal disease - proteinuria, hematuria, casts
- Monitoring diabetes - glycosuria, microalbuminuria
- Diagnosis of jaundice - bilirubin, urobilinogen pattern
- DKA detection - ketonuria
- Drug screening - toxicology
- Pre-operative assessment - routine investigation
Q9. Clinical Trials for Drugs
Definition
Phases of Clinical Trials
Diagram: Phases of Drug Development

Pre-clinical → Phase I → Phase II → Phase III → Regulatory → Phase IV
(Animal)                                         Approval    (Post-marketing)
| Phase | Subjects | Size | Purpose | Key Question |
|---|---|---|---|---|
| Pre-clinical | Animals/in vitro | - | Safety, toxicology, pharmacokinetics | Is it safe to give to humans? |
| Phase I | Healthy volunteers | 20-80 | Safety, pharmacokinetics, MTD, dose finding | Is it safe? How does the body handle it? |
| Phase II | Patients with disease | 100-300 | Efficacy signals, dose optimization, short-term safety | Does it work? What dose? |
| Phase III | Large patient groups | 300-3000+ | Comparative efficacy vs placebo/standard treatment; safety | Is it better than existing treatment? |
| Phase IV | General population (post-marketing) | Thousands | Long-term safety, rare ADRs, pharmacovigilance | What happens in real-world use? |
Types of Clinical Trial Designs
| Type | Description |
|---|---|
| Randomized Controlled Trial (RCT) | Gold standard; subjects randomly allocated to treatment or control |
| Double-blind | Neither subject nor investigator knows treatment allocation |
| Crossover | Each subject receives both treatments sequentially |
| Parallel group | Two groups receive different treatments simultaneously |
| Open label | Both parties know the treatment |
| Adaptive design | Trial design modified based on interim results |
Key Terms
- Randomization - Ensures equal distribution of confounders
- Blinding - Prevents placebo effect and observer bias
- Placebo - Inert substance given to control group
- Informed consent - Mandatory ethical requirement
- Intention to treat (ITT) - All randomized subjects analyzed in the group they were assigned
- Per protocol - Only subjects who completed trial analyzed
- CONSORT guidelines - Reporting standards for RCTs
Endpoints
- Primary endpoint - Main outcome (mortality, cure rate)
- Secondary endpoints - Additional outcomes (quality of life, hospital stay)
- Surrogate endpoints - e.g., HbA1c instead of diabetic complications
Ethical Principles (Declaration of Helsinki)
- Beneficence - Do good
- Non-maleficence - Do no harm
- Autonomy - Informed consent
- Justice - Fair selection of participants
Regulatory Bodies
- USA: FDA (Food and Drug Administration)
- Europe: EMA (European Medicines Agency)
- India: CDSCO (Central Drugs Standard Control Organization)
- International: ICH-GCP guidelines
Q10. Hypersensitivity Reactions
Definition
Classification (Gell and Coombs)
| Type | Mediator | Timing | Mechanism | Examples |
|---|---|---|---|---|
| Type I - Immediate | IgE | Seconds to minutes | IgE on mast cells → degranulation | Anaphylaxis, asthma, urticaria, hay fever |
| Type II - Cytotoxic | IgG, IgM | Hours | Antibody to cell surface antigens → complement/ADCC | Hemolytic disease, Goodpasture, Graves', myasthenia gravis |
| Type III - Immune complex | IgG (complexes) | 6-24 hours | Antigen-antibody complexes → complement → inflammation | Serum sickness, SLE, post-strep GN, Arthus reaction |
| Type IV - Delayed (Cell-mediated) | T cells | 48-72 hours | Th1 cells → macrophage activation / cytotoxic T cells | Contact dermatitis, PPD (TB test), graft rejection, Hashimoto's |
Type I - Immediate Hypersensitivity (IgE-mediated)
First exposure (Sensitization):
Allergen → B cells → Plasma cells → IgE → binds FcεR on Mast cells/Basophils

Second exposure (Elicitation):
Allergen cross-links IgE on mast cells → DEGRANULATION
   ↓
Preformed mediators (immediate):
   Histamine → vasodilation, bronchoconstriction, itching
   Tryptase, heparin

Late phase (4-8 hours):
   Leukotrienes (LTC4, LTD4) → bronchoconstriction
   Prostaglandins → inflammation
   IL-4, IL-5, IL-13 → eosinophil activation, IgE production
- Anaphylaxis - systemic; urticaria + angioedema + bronchospasm + hypotension → treat with epinephrine 0.3mg IM
- Bronchial asthma - airways
- Allergic rhinitis - nose
- Urticaria/Angioedema - skin
Type II - Cytotoxic
- Autoimmune hemolytic anemia (anti-RBC antibodies)
- Goodpasture syndrome (anti-GBM antibodies)
- Graves' disease (anti-TSH receptor → stimulatory)
- Myasthenia gravis (anti-AChR → inhibitory)
- Rh incompatibility / ABO transfusion reaction
Type III - Immune Complex
Antigen excess → Small complexes → Not cleared → Tissue deposition
       → Complement C3a, C5a → Neutrophil recruitment → ROS, lysosomal enzymes → Damage
- Serum sickness (day 7-10 after foreign serum)
- SLE (anti-dsDNA complexes in glomeruli, joints)
- Post-streptococcal GN
- Farmer's lung / Hypersensitivity pneumonitis
- Arthus reaction (local immune complex at injection site)
Type IV - Delayed Type Hypersensitivity (DTH)
- Type IVa (Th1-mediated): Antigen → sensitized Th1 cells → IL-2, IFN-γ → macrophage activation → granuloma formation (48-72 hr delay)
- Type IVb (Th2-mediated): IL-4, IL-5 → eosinophil infiltration (allergic contact eczema)
- Type IVc (Cytotoxic T cells): CD8+ T cells kill target cells
- Contact dermatitis (poison ivy, nickel allergy) - classic Type IV
- Tuberculin/Mantoux test (PPD) - positive = indurated red area at 48-72 hrs
- Graft rejection (organ transplant)
- Hashimoto's thyroiditis
- Type I DM (T cell destruction of beta cells)
- Multiple sclerosis
Summary Table - Differentiating Features
| Feature | Type I | Type II | Type III | Type IV |
|---|---|---|---|---|
| Antibody | IgE | IgG, IgM | IgG | None |
| Onset | Seconds-minutes | Hours | 6-24 hours | 48-72 hours |
| Complement | No | Yes | Yes | No |
| Cells involved | Mast cells, basophils, eosinophils | Neutrophils, NK cells | Neutrophils | T cells, macrophages |
| Test | Skin prick, RAST | Direct Coombs, IF | C3 levels, ANA | Patch test, Mantoux |