Make a full notes about ECG to a 3rd year medical student
Reading File
Finding Sources
Finding Sources
Finding Sources
Finding Sources
Reading File
Reading File
Reading File
Reading File
Reading File
Reading File
Reading File
Reading File
Reading File
Loading Image
Loading Image
Reading File
Loading Image
Finish it
I have all the content I need from the textbooks. Here are the complete ECG notes:
ECG (Electrocardiogram) - Complete Notes for 3rd Year Medical Students
1. INTRODUCTION
The ECG is a non-invasive recording of the electrical activity of the heart from the body surface. It was introduced by Einthoven in the early 1900s and remains one of the most important tools in clinical medicine. It provides direct measurement of:
- Heart rate
- Heart rhythm
- Conduction pathways
- Ischemia / infarction patterns
- Hypertrophy and metabolic disturbances
"Electrocardiography allows simultaneous recording of myocardial activation from multiple vantage points on the body's surface, thereby permitting analysis of electrical activation in different myocardial regions." - Goldman-Cecil Medicine
2. THE CARDIAC CONDUCTION SYSTEM
Understanding the ECG starts with understanding how electrical impulses travel through the heart.
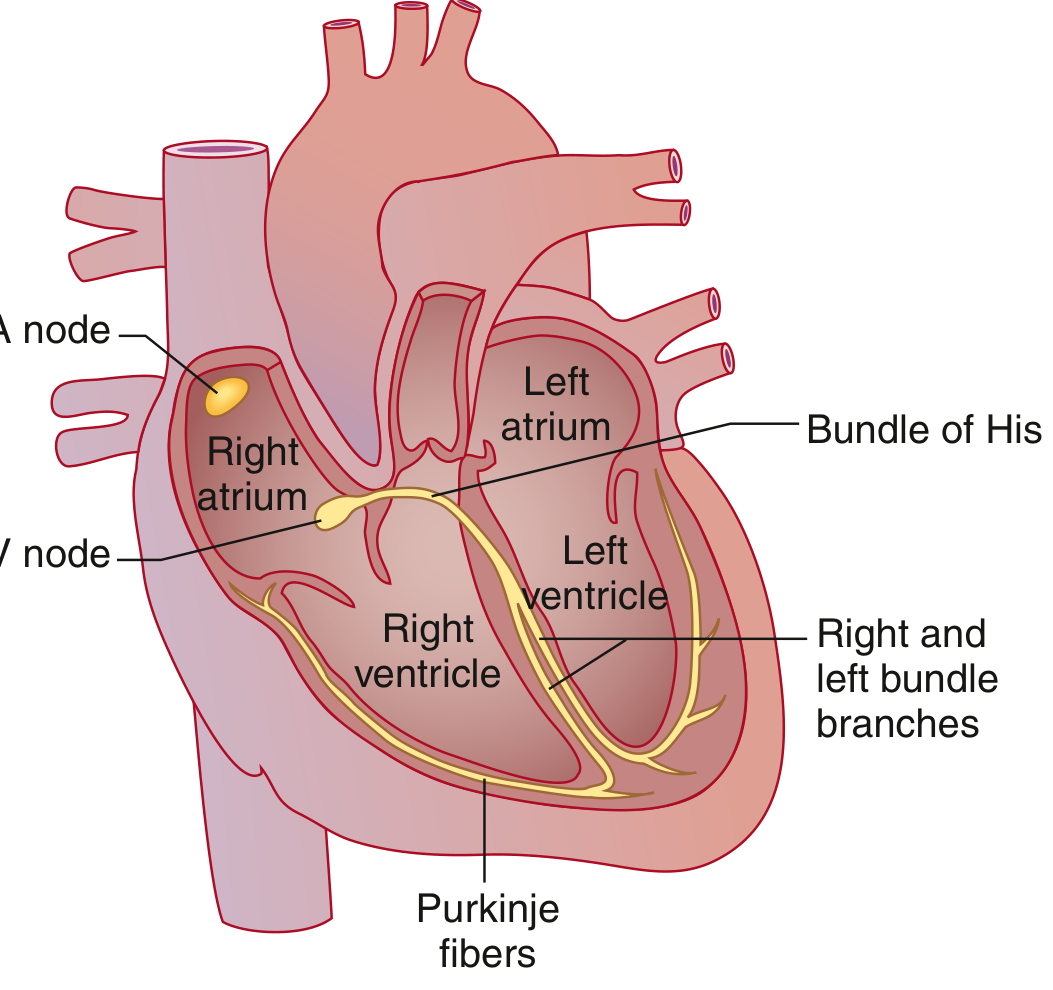
Cardiac conduction system - Goldman-Cecil Medicine
The sequence of normal electrical activation:
- SA node - located in the high lateral epicardial right atrium near the superior vena cava. Spontaneously depolarizes at the highest rate - it is the dominant pacemaker (60-100 bpm intrinsic rate).
- Atria - the wave front spreads through both atria. The Bachmann bundle speeds conduction to the left atrium. This produces the P wave.
- AV node - the only electrical connection between atria and ventricles (the AV rings are electrically insulated). Physiologic delay occurs here. This produces the PR interval.
- Bundle of His - exits the AV node; capable of rapid conduction.
- Bundle branches - the His bundle bifurcates into the right bundle branch and the left bundle branch. The left further divides into the left anterior fascicle and left posterior fascicle.
- Purkinje system - distal ramifications that rapidly deliver current to ventricular myocytes.
- Ventricular myocardium - depolarization produces the QRS complex; repolarization produces the T wave.
3. ECG PAPER AND TECHNICAL STANDARDS
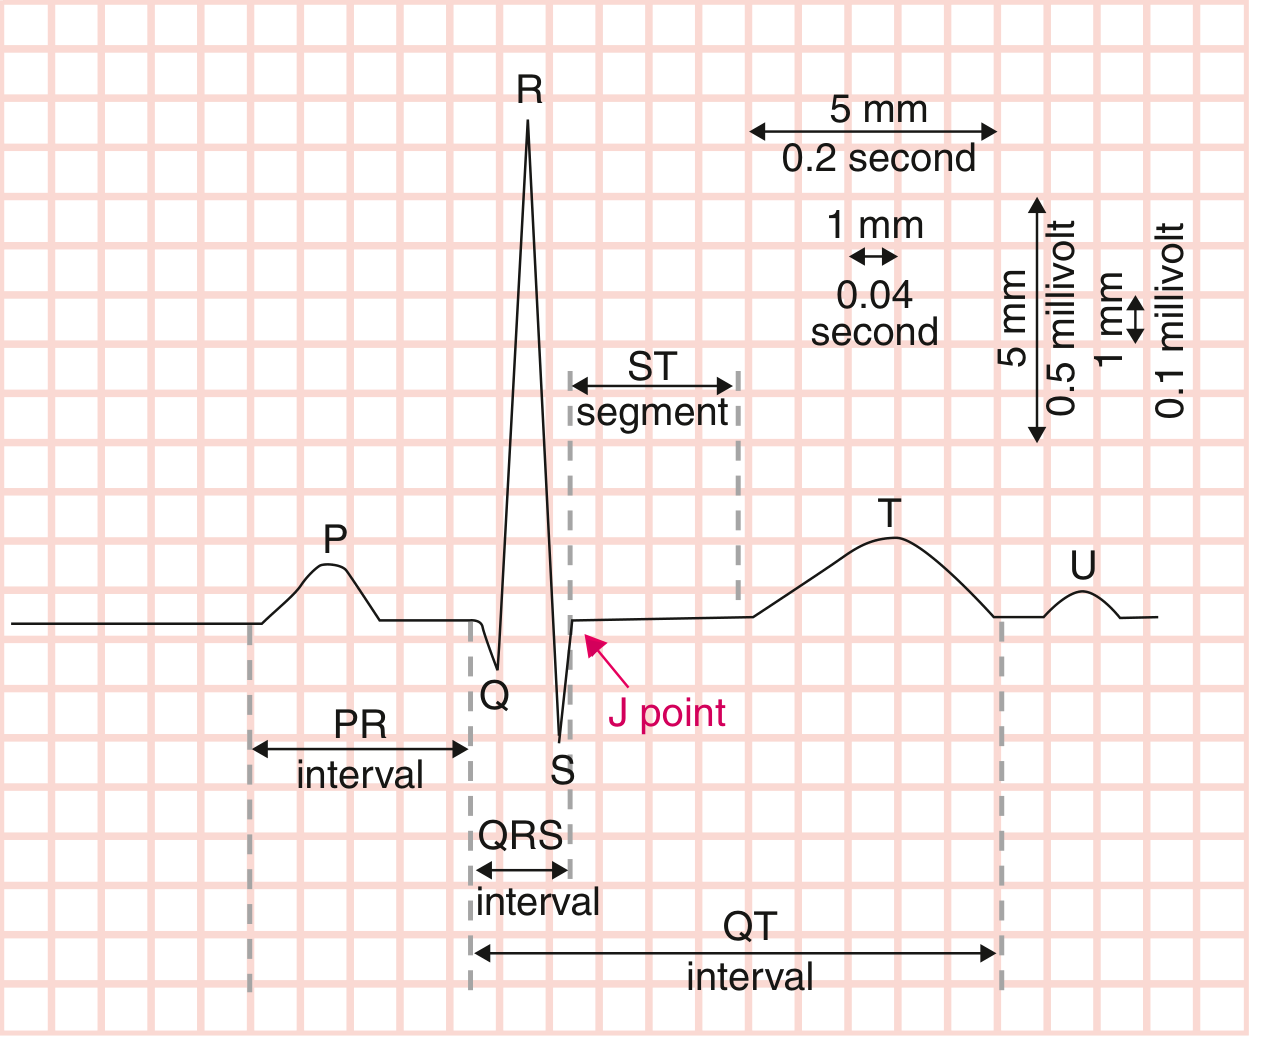
Normal ECG waveform with all intervals labeled - Goldman-Cecil Medicine
| Parameter | Value |
|---|---|
| Paper speed | 25 mm/sec |
| Small box (1 mm) | 0.04 sec horizontally; 0.1 mV vertically |
| Large box (5 mm) | 0.2 sec horizontally; 0.5 mV vertically |
| Standard calibration | 10 mm = 1 mV |
| Recording duration | 10 seconds (standard ECG) |
A standard 12-lead ECG records 4 groups of leads simultaneously: (I, II, III), (aVR, aVL, aVF), (V1, V2, V3), (V4, V5, V6) - each for 2.5 seconds. A rhythm strip runs below for the full 10 seconds.
4. THE ECG LEADS
Limb Leads (Frontal Plane)
| Lead | Positive Electrode | Views |
|---|---|---|
| Lead I | Left arm | Lateral wall |
| Lead II | Left leg | Inferior wall |
| Lead III | Left leg | Inferior wall |
| aVR | Right arm | Cavity (inverted) |
| aVL | Left arm | Lateral wall |
| aVF | Left leg | Inferior wall |
Precordial Leads (Horizontal Plane)
| Lead | Position | Views |
|---|---|---|
| V1 | 4th ICS, right sternal border | Septal / RV |
| V2 | 4th ICS, left sternal border | Septal |
| V3 | Between V2 and V4 | Anterior |
| V4 | 5th ICS, midclavicular line | Anterior |
| V5 | Anterior axillary line (same level as V4) | Lateral |
| V6 | Midaxillary line (same level as V4) | Lateral |
Key concept: Each lead looks at the heart from a different angle. A positive deflection means the electrical wavefront is traveling toward the positive electrode.
5. ECG WAVEFORMS - WHAT EACH REPRESENTS
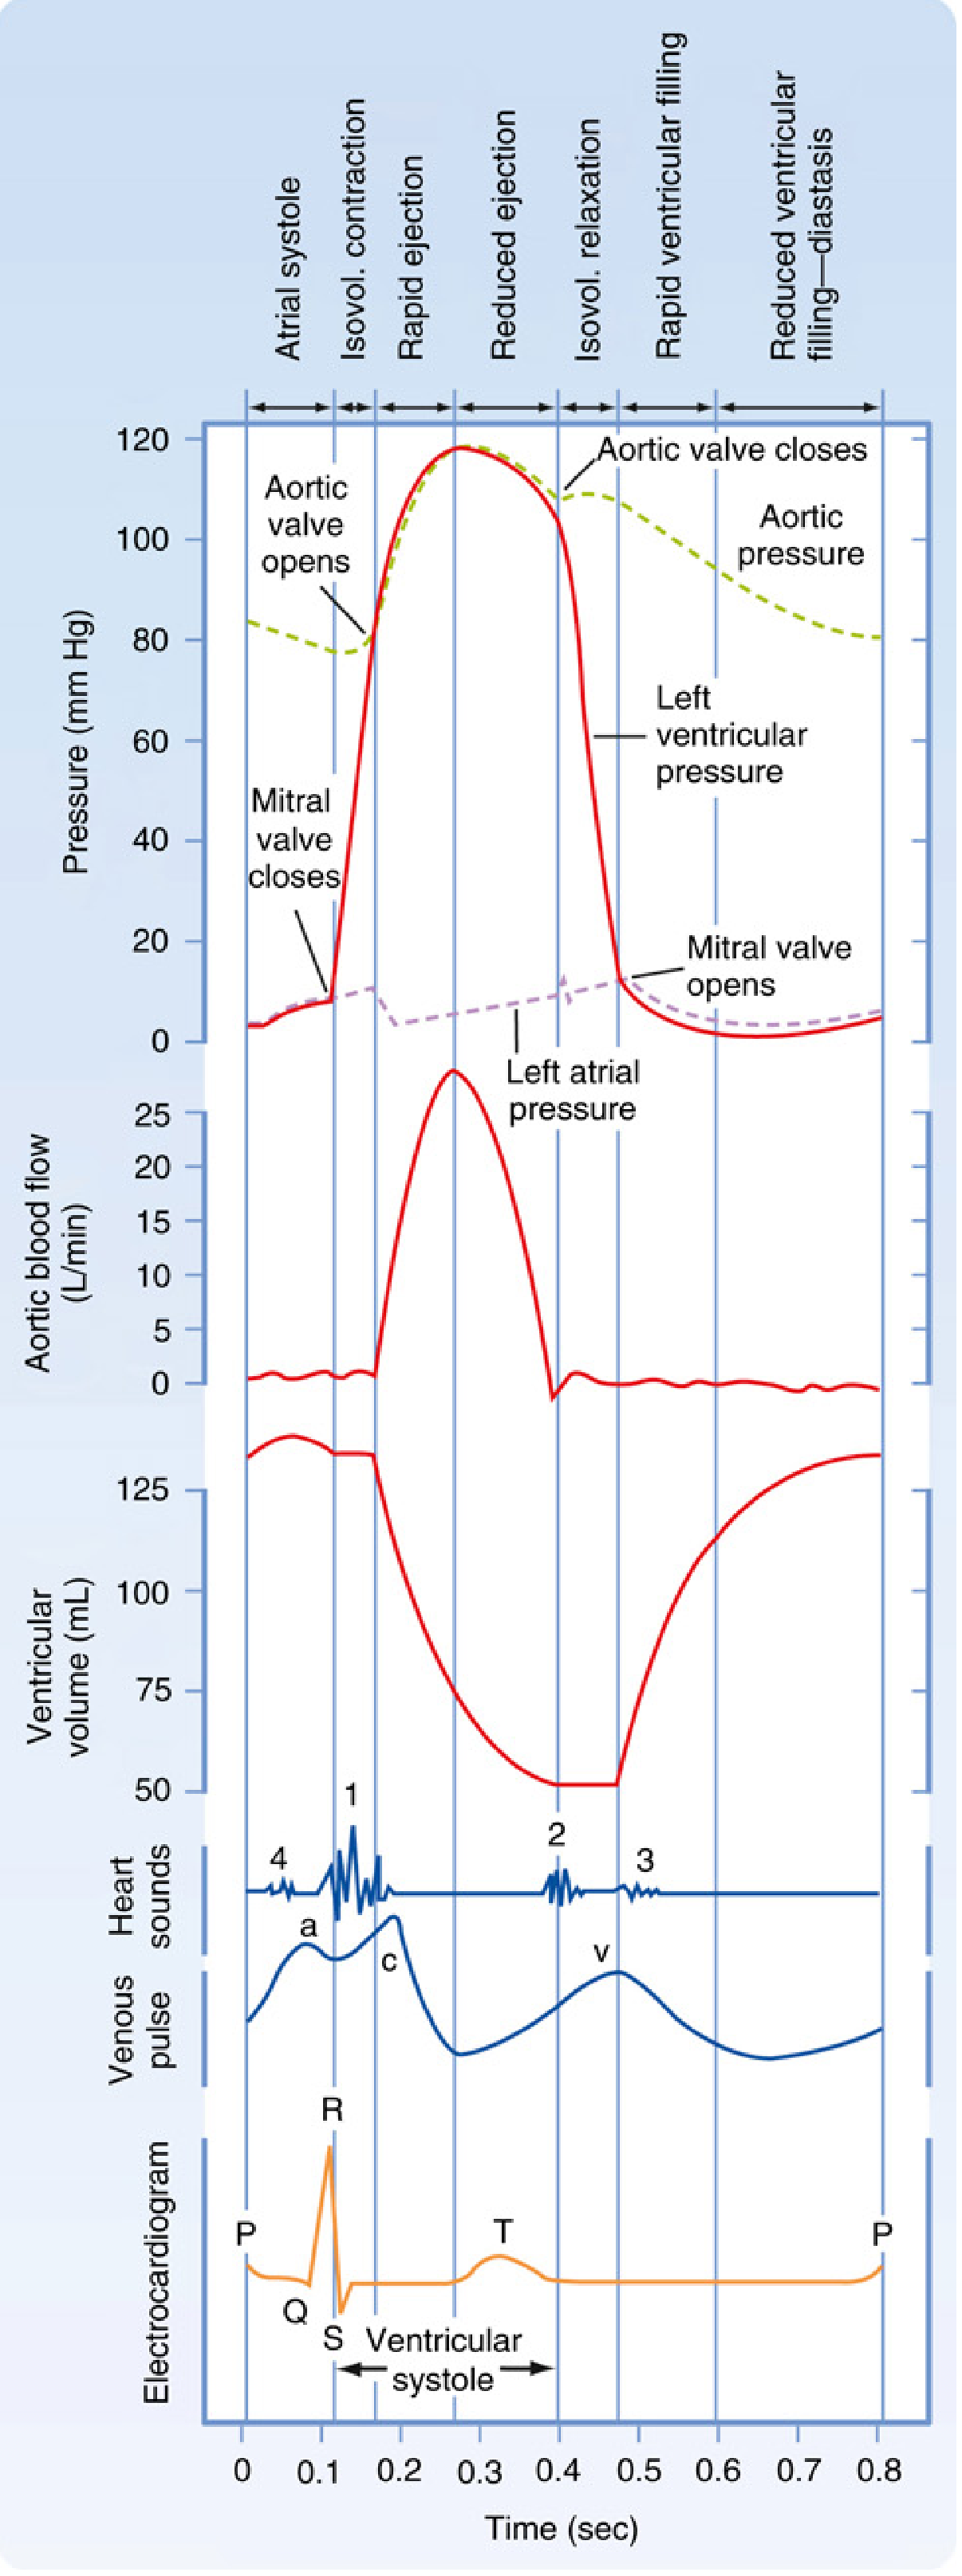
Cardiac cycle correlated with the ECG - Miller's Anesthesia
P Wave
- Represents: Atrial depolarization (both right and left atria)
- Normal duration: < 0.12 sec (< 3 small boxes)
- Normal amplitude: < 2.5 mm in limb leads; < 1.5 mm in precordial leads
- Morphology: Upright in leads I, II, aVF, V4-V6; inverted in aVR
- Abnormalities:
- Broad/bifid P (P mitrale) → Left atrial enlargement
- Tall/peaked P (P pulmonale, >2.5 mm) → Right atrial enlargement
- Absent P waves → AF, junctional rhythm, SA block
PR Interval
- Represents: Time from start of atrial depolarization to start of ventricular depolarization (includes AV nodal delay)
- Normal: 0.09 - 0.20 sec (90-200 msec)
- Prolonged (>0.20 sec): 1st degree AV block (delay usually in AV node)
- Short (<0.09 sec): Ventricular pre-excitation (WPW syndrome), junctional rhythm, or enhanced AV nodal conduction
QRS Complex
- Represents: Ventricular depolarization
- Normal duration: 0.075 - 0.11 sec (75-110 msec)
- Nomenclature:
- Capital letters (Q, R, S) = amplitude ≥ 5 mm (0.5 mV)
- Lowercase letters (q, r, s) = amplitude < 5 mm
- Q/q = initial negative deflection
- R/r = positive deflection
- S/s = negative deflection after a positive deflection
- QS = entirely negative deflection
- R' = second positive deflection (after S wave)
- Prolonged QRS (>0.11 sec): Bundle branch block, ventricular rhythm, pre-excitation
ST Segment
- Represents: Early ventricular repolarization (plateau phase of action potential)
- Normal: Isoelectric (at baseline)
- J point: Junction between the end of QRS and beginning of ST segment
- Abnormalities:
- ST elevation → Acute STEMI, pericarditis, Prinzmetal angina, LBBB, LVH
- ST depression → NSTEMI/UA, subendocardial ischemia, digoxin effect, hypokalemia
T Wave
- Represents: Ventricular repolarization
- Normal: Upright in I, II, V3-V6; inverted in aVR (and often V1)
- Amplitude: < 10 mm precordial; < 5 mm limb leads
- Abnormalities:
- Tall, peaked T waves → Hyperkalemia (early), STEMI (hyperacute T waves)
- T wave inversion → Ischemia, ventricular hypertrophy strain pattern, RBBB, LBBB, CNS events
QT Interval
- Represents: Total ventricular depolarization + repolarization
- Measured: QRS onset to end of T wave; in leads II, V5, V6
- Must be rate-corrected: Use Bazett's formula: QTc = QT / √RR (RR in seconds)
- Normal QTc:
- Males: 390-450 msec
- Females: 390-460 msec
- Prolonged QTc: Risk of Torsades de Pointes (TdP) and sudden cardiac death
- Causes: Drugs (antiarrhythmics, antipsychotics, antibiotics), hypokalemia, hypomagnesemia, hypocalcemia, congenital long QT syndrome
- Short QTc (<350 msec): Hypercalcemia, digoxin, congenital short QT syndrome
U Wave
- Small deflection after the T wave; best seen in V2-V3
- Represents: Repolarization of Purkinje fibers / interventricular septum (debated)
- Prominent U waves: Hypokalemia, bradycardia, hypothermia
- Note: Prominent U waves can complicate QTc measurement
J Wave (Osborn Wave)
- Positive deflection at the J point (QRS downstroke)
- Seen in: Hypothermia (most common), hypercalcemia, brain injury
- May indicate risk of idiopathic ventricular fibrillation
6. HEART RATE CALCULATION
Method 1 (Precise) - R-R interval:
HR = 60 / R-R interval (in seconds) = 60,000 / R-R interval (in msec)
Method 2 (Quick) - Large box counting:
Count large boxes between two consecutive R waves, then use:
300 - 150 - 100 - 75 - 60 - 50 (for 1, 2, 3, 4, 5, 6 large boxes) Formula: HR = 300 / (number of large boxes)
Method 3 (Irregular rhythm):
Count number of QRS complexes in 10-second strip × 6
| Rate | Interpretation |
|---|---|
| < 50 bpm | Bradycardia |
| 50-100 bpm | Normal |
| > 100 bpm | Tachycardia |
7. NORMAL INTERVAL SUMMARY TABLE
| Interval/Wave | Normal Value | Clinical Significance if Abnormal |
|---|---|---|
| HR | 50-100 bpm | Brady/tachycardia |
| P wave duration | < 120 msec | Atrial enlargement if broad |
| PR interval | 90-200 msec | AV block if long; WPW if short |
| QRS duration | 75-110 msec | BBB if > 120 msec |
| QTc (male) | 390-450 msec | TdP risk if prolonged |
| QTc (female) | 390-460 msec | TdP risk if prolonged |
| QRS axis | -30° to +90° | LAD / RAD if deviated |
8. QRS AXIS
The electrical axis is the overall direction of ventricular depolarization in the frontal plane.
Normal axis: -30° to +90°
Quick method using Leads I and aVF:
| Lead I | Lead aVF | Axis |
|---|---|---|
| Positive | Positive | Normal (-30° to +90°) |
| Positive | Negative | Left axis deviation (LAD) |
| Negative | Positive | Right axis deviation (RAD) |
| Negative | Negative | Extreme RAD ("Northwest axis") |
More precise: The axis points toward the lead where the QRS is most positive (or away from where it is most negative). The axis is perpendicular to the lead where the QRS is isoelectric (equal positive/negative deflection).
Causes of Axis Deviation:
Left Axis Deviation (LAD, more negative than -30°):
- Left anterior fascicular block (most common)
- Left ventricular hypertrophy
- Inferior STEMI
- WPW (right-sided accessory pathway)
Right Axis Deviation (RAD, more positive than +90°):
- Right ventricular hypertrophy
- Left posterior fascicular block
- Pulmonary embolism / cor pulmonale
- WPW (left-sided accessory pathway)
- Normal in children and tall thin adults
9. SYSTEMATIC APPROACH TO ECG INTERPRETATION
Use a consistent method every time. A reliable mnemonic is:
"Rate, Rhythm, Axis, Intervals, Hypertrophy, Ischemia/Infarction"
Step-by-Step:
- Rate - calculate using large-box method
- Rhythm - regular or irregular? Is there a P for every QRS? Is there a QRS for every P?
- P wave - present, morphology, axis (upright in I and II = sinus origin)
- PR interval - normal, prolonged, or short?
- QRS complex - duration, morphology, pathological Q waves?
- QRS axis - using leads I and aVF
- ST segment - elevation or depression?
- T waves - normal, inverted, tall/peaked?
- QT interval - calculate QTc
- Overall interpretation - put it all together
10. NORMAL SINUS RHYTHM (NSR) - Criteria
- Regular rhythm
- Rate 60-100 bpm
- P wave upright in I, II, aVF; inverted in aVR
- Every P followed by QRS; every QRS preceded by P
- PR interval 120-200 msec
- QRS < 120 msec
- Normal axis
11. COMMON ARRHYTHMIAS
Sinus Arrhythmia
- Subtle variation in heart rate with respiration
- Inspiration → faster rate; expiration → slower rate
- Normal variant - no treatment required
Sinus Tachycardia
- Rate > 100 bpm; otherwise normal ECG
- Causes: exercise, anxiety, fever, pain, anemia, hypovolemia, hyperthyroidism
- Treat the underlying cause
Sinus Bradycardia
- Rate < 60 bpm; otherwise normal ECG
- Causes: athletes, sleep, hypothyroidism, sick sinus syndrome, medications (beta-blockers)
Atrial Fibrillation (AF)
- Irregularly irregular rhythm
- No distinct P waves - replaced by chaotic fibrillatory baseline
- Narrow QRS (unless aberrant conduction)
- Rate: variable (ventricular rate depends on AV node conduction)
Atrial Flutter
- Regular sawtooth flutter waves at ~300 bpm (P waves)
- Usually 2:1 AV block → ventricular rate ~150 bpm
- Sawtooth most visible in leads II, III, aVF
Supraventricular Tachycardia (SVT)
- Regular narrow-complex tachycardia, rate 150-250 bpm
- P waves may be hidden in QRS or just after QRS
- Includes AVNRT, AVRT
Ventricular Tachycardia (VT)
- ≥3 consecutive wide QRS complexes at rate > 100 bpm
- AV dissociation (independent P waves), fusion beats, capture beats
- Emergency - risk of degeneration to VF
Ventricular Fibrillation (VF)
- Chaotic, irregular wide complexes - no discernible QRS/T
- No cardiac output - cardiac arrest
- Treat with immediate defibrillation
12. AV BLOCKS
1st Degree AV Block
- PR interval > 200 msec (one large box)
- All P waves conduct to ventricles
- Usually benign; no treatment needed
2nd Degree AV Block - Mobitz Type I (Wenckebach)
- Progressive PR prolongation until a P wave is not conducted (dropped QRS)
- Then cycle repeats
- Site of block: usually AV node
- Usually benign
2nd Degree AV Block - Mobitz Type II
- Fixed PR interval with sudden dropped QRS (no progressive lengthening)
- Site of block: His-Purkinje system (below the AV node)
- More serious - can progress to complete heart block
- May need pacemaker
3rd Degree (Complete) AV Block
- Complete dissociation between P waves and QRS complexes
- P waves and QRS have independent regular rates
- Ventricular escape rhythm: rate 20-40 bpm, wide QRS (if ventricular) or narrow QRS (if junctional)
- Emergency - needs pacemaker
13. BUNDLE BRANCH BLOCKS
Right Bundle Branch Block (RBBB)
Criteria:
- QRS ≥ 0.12 sec (≥ 120 msec)
- RSR' pattern ("rabbit ears") in V1
- Wide, slurred S wave in leads I, V5, V6
- Secondary T wave changes (T wave inversion in V1-V3)
Mnemonic: "WiRRoW" - W shape in V1 (actually RSR'), M in V6 ... use "RsR' in Right V1"
Causes: Right heart strain (PE, cor pulmonale), congenital heart disease, ischemia, normal variant
Left Bundle Branch Block (LBBB)
Criteria:
- QRS ≥ 0.12 sec
- Broad, notched R wave in I, aVL, V5, V6 (no Q wave in V5-V6)
- QS or rS in V1
- ST and T wave changes opposite to QRS direction (discordant)
Clinical significance: LBBB almost always indicates significant underlying heart disease (CAD, cardiomyopathy, hypertension). New LBBB in chest pain context = treat as STEMI equivalent (Sgarbossa criteria apply).
Mnemonic: "WiLLiaM MoRRoW" - W in V1 and M in V6 for LBBB; M in V1 and W in V6 for RBBB
14. VENTRICULAR HYPERTROPHY
Left Ventricular Hypertrophy (LVH)
Sokolow-Lyon Criteria (most commonly used):
- S in V1 + R in V5 or V6 > 35 mm
- Or: R in aVL > 11 mm
Other features:
- Strain pattern: ST depression + T wave inversion in lateral leads (I, aVL, V5, V6)
- Left axis deviation
- Wide QRS (though < 120 msec)
Causes: Hypertension (most common), aortic stenosis, hypertrophic cardiomyopathy
Right Ventricular Hypertrophy (RVH)
Criteria:
- R > S in V1 (tall R wave in V1, R ≥ 7 mm)
- Right axis deviation (> +90°)
- Strain pattern: ST depression/T inversion in V1-V3, II, III, aVF
Causes: Pulmonary hypertension, pulmonary stenosis, cor pulmonale, congenital heart disease (ASD, VSD)
15. ISCHEMIA AND INFARCTION
Sequence of ECG Changes in STEMI:
| Time | ECG Change |
|---|---|
| Minutes | Hyperacute (tall, peaked) T waves |
| Hours | ST elevation |
| Hours-days | T wave inversion |
| Days-weeks | Pathological Q waves form |
| Weeks-months | ST returns to baseline |
| Permanent | Q waves may persist |
Pathological Q Waves
- Width ≥ 0.04 sec (1 small box) or duration ≥ 40 msec
- Depth ≥ 25% of R wave amplitude in the same complex
- Represent dead/electrically silent myocardium (transmural infarction)
- Note: Septal Q waves in I, aVL, V5, V6 are normal (small, narrow)
Localizing the Infarct by Territory:
| Territory | Leads with changes | Coronary Artery |
|---|---|---|
| Inferior | II, III, aVF | RCA (80%), LCx (20%) |
| Lateral | I, aVL, V5, V6 | LCx or diagonal |
| Anterior | V1-V4 | LAD |
| Septal | V1-V2 | Septal perforators of LAD |
| Posterior | Tall R and ST depression in V1-V2 (reciprocal) | RCA or LCx |
| Right ventricular | V1, ST elevation in V4R | RCA |
STEMI vs. Pericarditis ST Elevation:
| Feature | STEMI | Pericarditis |
|---|---|---|
| Distribution | Regional (one territory) | Diffuse (all leads except aVR/V1) |
| Morphology | Convex ("tombstone") | Concave (saddle-shaped) |
| PR depression | Absent | Present (pathognomonic) |
| Reciprocal changes | Present | Absent |
| Q waves | Develop | Do not develop |
16. ELECTROLYTE DISTURBANCES ON ECG
Hyperkalemia (progressive changes with rising K+):
- Tall, peaked, narrow ("tented") T waves (earliest sign)
- PR prolongation
- P wave flattening/disappearance
- Wide QRS
- Sine wave pattern
- VF/asystole (at K+ > 7-8 mEq/L)
Hypokalemia:
- Flattening of T waves
- Prominent U waves (most characteristic)
- ST depression
- Prolonged QU interval (mistaken for long QT)
- Risk of TdP at severe levels
Hypercalcemia:
- Short QT interval (shortened ST segment)
- Broad T waves
- J waves (Osborn waves) at very high levels
Hypocalcemia:
- Prolonged QT interval (prolonged ST segment)
- Risk of TdP
Hypomagnesemia:
- PR prolongation
- Prolonged QT
- T wave changes
- Risk of TdP (often co-exists with hypokalemia)
17. DRUG EFFECTS ON ECG
| Drug | ECG Effect |
|---|---|
| Digoxin | "Reverse tick" ST depression, shortened QT, T wave inversion, PR prolongation, various arrhythmias |
| Beta-blockers | Bradycardia, PR prolongation |
| Class Ia antiarrhythmics (quinidine) | QT prolongation, QRS widening |
| Class Ic (flecainide) | QRS widening, PR prolongation |
| Class III (amiodarone, sotalol) | QT prolongation |
| TCAs (tricyclics) | Sinus tachycardia, QRS widening, QT prolongation, right axis deviation |
| Antipsychotics | QT prolongation |
| Fluoroquinolones / macrolides | QT prolongation |
18. OTHER IMPORTANT ECG PATTERNS
Wolff-Parkinson-White (WPW)
- Short PR interval (< 120 msec)
- Delta wave (slurred upstroke of QRS)
- Widened QRS
- ST/T changes
- Caused by accessory pathway (Bundle of Kent) bypassing AV node
- Risk: pre-excited AF → VF (never use AV-nodal blocking drugs in AF with WPW)
Brugada Pattern
- RBBB-like pattern + ST elevation in V1-V3 (downsloping/coved type)
- Associated with sudden cardiac death in structurally normal heart
- Accentuated by fever, sodium channel blockers, vagal tone
Pulmonary Embolism (PE)
- Most common finding: Sinus tachycardia
- Classic (but uncommon): S1Q3T3 - deep S in I, Q wave + T inversion in III
- Right heart strain: RBBB, RAD, P pulmonale
- T wave inversions in V1-V4
Pericarditis
- Stage 1: Diffuse ST elevation (concave/saddle-shaped) + PR depression in all leads except aVR/V1 (PR elevated in aVR)
- Stage 2: ST and PR return to baseline
- Stage 3: Diffuse T wave inversion
- Stage 4: ECG normalizes
Hypothermia
- Sinus bradycardia
- Osborn (J) waves - positive deflection at J point; most prominent in leads V4-V6
- QT prolongation
- Prolonged PR and QRS
- Shivering artifact
Long QT Syndrome
- Congenital (LQT1, LQT2, LQT3 - different triggers and T wave morphologies)
- Acquired (drugs, electrolytes)
- Risk: Torsades de Pointes (polymorphic VT) → syncope / sudden death
19. QUICK CLINICAL CLUES TABLE
| ECG Finding | Think Of |
|---|---|
| Delta wave + short PR | WPW |
| Sawtooth waves at 300 bpm | Atrial flutter |
| Irregularly irregular, no P waves | Atrial fibrillation |
| Progressive PR prolongation + dropped beat | Mobitz I (Wenckebach) |
| Fixed PR + sudden dropped beat | Mobitz II |
| P-QRS complete dissociation | Complete heart block |
| RSR' in V1 + wide S in V6 | RBBB |
| Broad notched R in V5-V6, no Q in V6 | LBBB |
| S1Q3T3 + sinus tachycardia | Pulmonary embolism |
| Diffuse ST elevation + PR depression | Pericarditis |
| Tall peaked T waves | Hyperkalemia |
| Prominent U waves | Hypokalemia |
| Short QT | Hypercalcemia |
| Long QT + low K/Mg | Torsades risk |
| Osborn (J) waves | Hypothermia |
| Reverse tick ST depression | Digoxin effect |
20. KEY FORMULAS SUMMARY
| Formula | Use |
|---|---|
| HR = 300 / (# large boxes) | Quick rate estimation |
| HR = 60,000 / RR interval (msec) | Precise rate |
| QTc = QT / √RR | Bazett's correction for QT |
| Sokolow-Lyon: SV1 + RV5/V6 > 35 mm | LVH criterion |
| Pathological Q: width ≥ 0.04 sec, depth ≥ 25% R | Q wave = infarction |
Sources:
- Goldman-Cecil Medicine, International Edition (Chapter 42 - Electrocardiography)
- Medical Physiology (Boron & Boulpaep), Chapter 21 - Box 21-2, Table 21-5
- Miller's Anesthesia, 10th Edition - Chapter 13 (Electrical Events and the ECG)
- Roberts & Hedges' Clinical Procedures in Emergency Medicine - Electrocardiography chapter
Create a presentation summarizing ECG interpretation steps
Reading File
Reading File
Reading File
Reading File
Running Command
Running Command
Writing File
Running Command
Running Command
Running Command
Running Command
Running Command
Running Command
Reading File
Editing File
Running Command
Running Command
Running Command
Running Command
Running Command
Model call limits exceeded: run limit (20/20)
This is a shared conversation. Sign in to Orris to start your own chat.