Why is contrast used to visualise the pituitary gland?

Reading File
Finding Sources
Finding Sources
Searching Images

pituitary gland MRI contrast enhancement
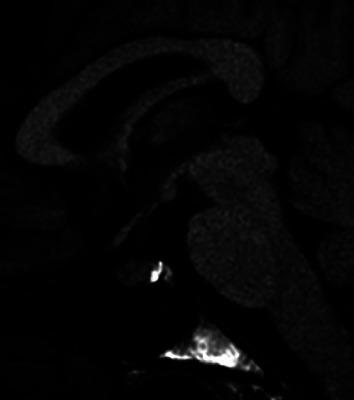
This diagnostic image is a contrast-enhanced MRI of the brain, specifically focusing on a sagittal view of the sellar and suprasellar regions. The image demonstrates the pituitary gland situated within the sella turcica. A key finding is the heterogeneous enhancement of the pituitary parenchyma, characterized by non-uniform signal intensity following intravenous contrast administration. Instead of the typical homogeneous bright signal, the gland shows patchy areas of varying brightness and relative hypoenhancement. The overall morphology of the gland appears slightly enlarged or distorted with poorly defined margins in certain sections. This visual pattern is a significant clinical indicator of hypophysitis, potentially secondary to immune checkpoint inhibitor (ICI) therapy. The image serves as an educational example of how inflammatory processes can alter the vascular and structural integrity of the pituitary gland, leading to abnormal contrast uptake patterns compared to normal glandular tissue.
This diagnostic image is a contrast-enhanced MRI of the brain, specifically focusing on a sagittal view of the sellar and suprasellar regions. The image demonstrates the pituitary gland situated within the sella turcica. A key finding is the heterogeneous enhancement of the pituitary parenchyma, characterized by non-uniform signal intensity following intravenous contrast administration. Instead of the typical homogeneous bright signal, the gland shows patchy areas of varying brightness and relative hypoenhancement. The overall morphology of the gland appears slightly enlarged or distorted with poorly defined margins in certain sections. This visual pattern is a significant clinical indicator of hypophysitis, potentially secondary to immune checkpoint inhibitor (ICI) therapy. The image serves as an educational example of how inflammatory processes can alter the vascular and structural integrity of the pituitary gland, leading to abnormal contrast uptake patterns compared to normal glandular tissue.

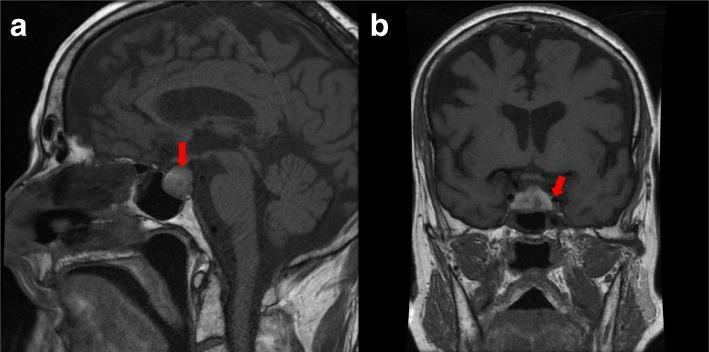
Contrast-enhanced brain magnetic resonance imaging (MRI) scans in sagittal (a) and coronal (b) views demonstrating a significant pituitary lesion. Red arrows point to a markedly enlarged pituitary gland that expands the sella turcica. The lesion exhibits heterogeneous signal intensity, characterized by varying degrees of contrast enhancement and distinct areas of intrinsic high signal, which are visually suggestive of intra-lesional hemorrhage or necrosis. In the sagittal view, superior expansion of the mass is visible relative to the sphenoid sinus and brainstem. The coronal view highlights the horizontal extension and proximity to the cavernous sinuses. These neuroimaging findings are clinically significant for diagnosing pituitary apoplexy, often occurring in the setting of a preexisting macroadenoma. The images serve as an educational example of sellar pathology, demonstrating the diagnostic utility of multi-planar MRI in evaluating the hypothalamic-pituitary axis and identifying complications such as hemorrhage within a pituitary mass.
Contrast-enhanced brain magnetic resonance imaging (MRI) scans in sagittal (a) and coronal (b) views demonstrating a significant pituitary lesion. Red arrows point to a markedly enlarged pituitary gland that expands the sella turcica. The lesion exhibits heterogeneous signal intensity, characterized by varying degrees of contrast enhancement and distinct areas of intrinsic high signal, which are visually suggestive of intra-lesional hemorrhage or necrosis. In the sagittal view, superior expansion of the mass is visible relative to the sphenoid sinus and brainstem. The coronal view highlights the horizontal extension and proximity to the cavernous sinuses. These neuroimaging findings are clinically significant for diagnosing pituitary apoplexy, often occurring in the setting of a preexisting macroadenoma. The images serve as an educational example of sellar pathology, demonstrating the diagnostic utility of multi-planar MRI in evaluating the hypothalamic-pituitary axis and identifying complications such as hemorrhage within a pituitary mass.

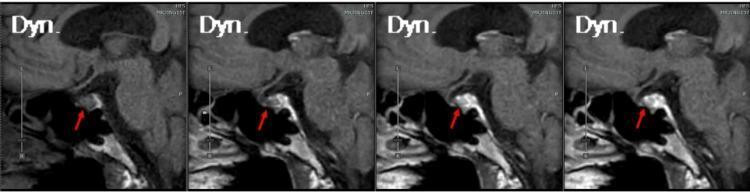
This diagnostic image series consists of four T1-weighted sagittal dynamic contrast-enhanced (DCE) MRI frames of the pituitary gland, progressing from an arterial/early phase (left) to a late venous phase (right). The red arrow indicates the pituitary gland situated within the sella turcica. The sequence demonstrates normal contrast wash-in, where the pituitary stalk and posterior pituitary enhance initially, followed by diffuse, homogeneous enhancement of the adenohypophysis. Visible anatomical landmarks include the sphenoid sinus (inferior), the optic chiasm (superior), and the pons (posterior). The images are used to assess the pituitary for secondary signs of pathology, such as hypophysitis or microadenomas, which may present with delayed or altered enhancement patterns. In this specific case, the pituitary appears normal in size and morphology with appropriate contrast kinetics, providing radiographic evidence against structural causes in patients presenting with hormonal deficiencies like isolated ACTH deficiency.
This diagnostic image series consists of four T1-weighted sagittal dynamic contrast-enhanced (DCE) MRI frames of the pituitary gland, progressing from an arterial/early phase (left) to a late venous phase (right). The red arrow indicates the pituitary gland situated within the sella turcica. The sequence demonstrates normal contrast wash-in, where the pituitary stalk and posterior pituitary enhance initially, followed by diffuse, homogeneous enhancement of the adenohypophysis. Visible anatomical landmarks include the sphenoid sinus (inferior), the optic chiasm (superior), and the pons (posterior). The images are used to assess the pituitary for secondary signs of pathology, such as hypophysitis or microadenomas, which may present with delayed or altered enhancement patterns. In this specific case, the pituitary appears normal in size and morphology with appropriate contrast kinetics, providing radiographic evidence against structural causes in patients presenting with hormonal deficiencies like isolated ACTH deficiency.

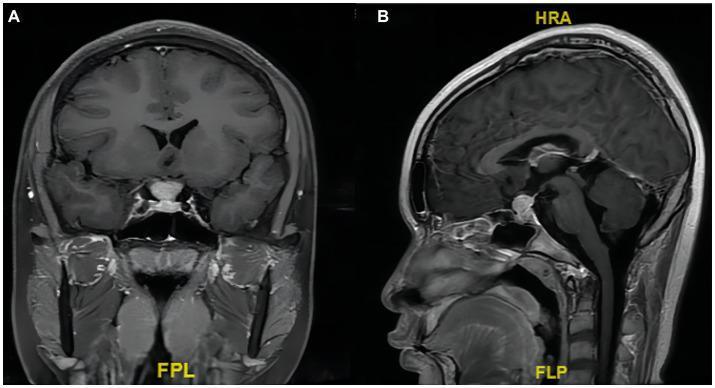
Contrast-enhanced T1-weighted MRI of the head in coronal (A) and sagittal (B) planes, focused on the sellar and suprasellar regions. The imaging reveals a significant homogeneous enhancement of an enlarged pituitary stalk, measuring approximately 12 x 15 x 16 mm. This mass and the normal pituitary gland are both bounded superiorly by the diaphragma sellae. Notable mass effect includes slight compression of the optic chiasm and a focal depression of the sellar floor toward the left side. The cavernous sinuses bilaterally appear clear of tumor invasion. Additionally, the images show mucosal thickening in the ethmoid and left maxillary sinuses. This diagnostic imaging is indicative of pathology involving the infundibulum, such as lymphocytic hypophysitis or a primary pituitary stalk tumor like marginal zone lymphoma (MZL). The study demonstrates key landmarks for neurosurgical planning, including the relationship between the lesion, the sella turcica, and the visual pathways.

Contrast-enhanced T1-weighted MRI of the head in coronal (A) and sagittal (B) planes, focused on the sellar and suprasellar regions. The imaging reveals a significant homogeneous enhancement of an enlarged pituitary stalk, measuring approximately 12 x 15 x 16 mm. This mass and the normal pituitary gland are both bounded superiorly by the diaphragma sellae. Notable mass effect includes slight compression of the optic chiasm and a focal depression of the sellar floor toward the left side. The cavernous sinuses bilaterally appear clear of tumor invasion. Additionally, the images show mucosal thickening in the ethmoid and left maxillary sinuses. This diagnostic imaging is indicative of pathology involving the infundibulum, such as lymphocytic hypophysitis or a primary pituitary stalk tumor like marginal zone lymphoma (MZL). The study demonstrates key landmarks for neurosurgical planning, including the relationship between the lesion, the sella turcica, and the visual pathways.

Reading File
Reading File
Loading Image
Here is a thorough explanation drawing directly from two authoritative ENT/skull-base surgery textbooks.

Why Contrast is Used to Visualise the Pituitary Gland

The Core Reason: No Blood-Brain Barrier

Most of the brain is protected by the blood-brain barrier (BBB) - a system of tight junctions between endothelial cells in cerebral capillaries that prevents large molecules (including contrast agents) from leaking out of the bloodstream into neural tissue. Because of this, normal brain tissue does not enhance after contrast administration.
The pituitary gland (and its stalk, the infundibulum) is a circumventricular organ - it lies anatomically outside the BBB. Its capillaries lack the tight junctions that form the barrier. This means:
  • Iodinated contrast (CT) or gadolinium (MRI) freely diffuses out of pituitary capillaries into the gland parenchyma
  • The gland therefore enhances rapidly and intensely after contrast is given
As stated directly in Scott-Brown's Otorhinolaryngology Head & Neck Surgery:
"The pituitary gland and infundibulum lack a blood-brain barrier therefore enhance rapidly and intensely after contrast is given."
And from Shambaugh Surgery of the Ear:
"The contrast material does not penetrate the intact blood-brain barrier, normal brain does not enhance except for structures, such as the pituitary gland and several cranial nerves that lack a complete blood-brain barrier."

Practical Implications for Imaging

SituationWhat you see
Normal pituitaryBright, homogeneous enhancement - because no BBB is present
Pituitary microadenomaRelative hypoenhancement - adenoma cells have abnormal vascularity and enhance more slowly than the normal gland
MacroadenomaVariable enhancement, may show necrotic/haemorrhagic areas (as in pituitary apoplexy)
HypophysitisHeterogeneous, patchy enhancement indicating inflammatory disruption
This is why dynamic contrast-enhanced MRI (rapid sequential acquisitions) is the gold standard for detecting microadenomas: the normal gland lights up first, and the adenoma appears as a dark "filling defect" relative to the brightly enhancing surrounding tissue.

The Dynamic MRI Sequence (illustrated below)

Dynamic contrast-enhanced T1-weighted sagittal MRI of the pituitary gland showing progressive contrast wash-in from early arterial phase (left) to late venous phase (right). Red arrows indicate the pituitary gland.
The four frames show the contrast washing into the pituitary stalk and posterior pituitary first, then spreading to homogeneous enhancement of the adenohypophysis - a normal pattern. Any microadenoma would appear as a persistent dark spot within this brightly enhancing tissue.

Other structures that also lack a BBB

The pituitary is not unique in this property - other circumventricular organs also enhance with contrast: the pineal gland, the choroid plexus, the area postrema, and certain cranial nerves. Extra-axial lesions like meningiomas and schwannomas similarly lack a BBB and enhance strongly.
  • Scott-Brown's Otorhinolaryngology Head & Neck Surgery, p. 693 (Enhancement Patterns section)
  • Shambaugh Surgery of the Ear, p. 282
This is a shared conversation. Sign in to Orris to start your own chat.