
Telomeres and telomerase
telomere structure chromosome end replication
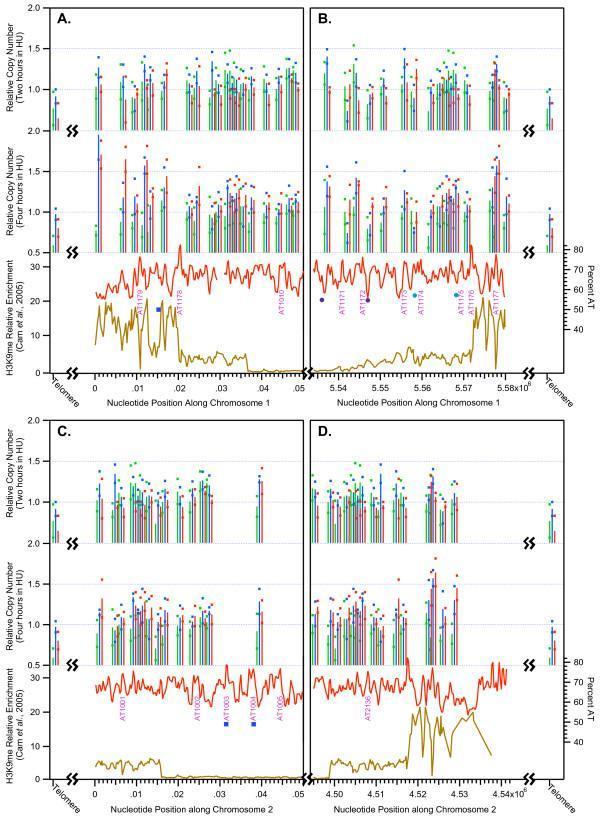
A scientific infographic containing four multi-panel line and bar graphs (A, B, C, D) illustrating DNA replication data for chromosomes 1 and 2 in Schizosaccharomyces pombe. Each graph represents a chromosome end: (A) left end of chromosome 1, (B) right end of chromosome 1, (C) left end of chromosome 2, and (D) right end of chromosome 2. The Y-axes track three primary variables: relative DNA copy number at two hours and four hours in hydroxyurea (HU), H3K9me relative enrichment (a marker for heterochromatin, shown as gold lines), and percent AT content (shown as red lines). The X-axis represents the nucleotide position along the chromosome, beginning with the telomere. The graphs demonstrate a significant correlation between high H3K9me levels in subtelomeric regions and restrained DNA replication, which is further analyzed in wild-type versus checkpoint-mutant strains (indicated by blue, red, and green data points). These diagrams provide a visual comparative analysis of the epigenetic and genetic factors, such as high AT-islands and heterochromatin markers, that influence the timing and efficiency of replication origins across different chromosomal domains.
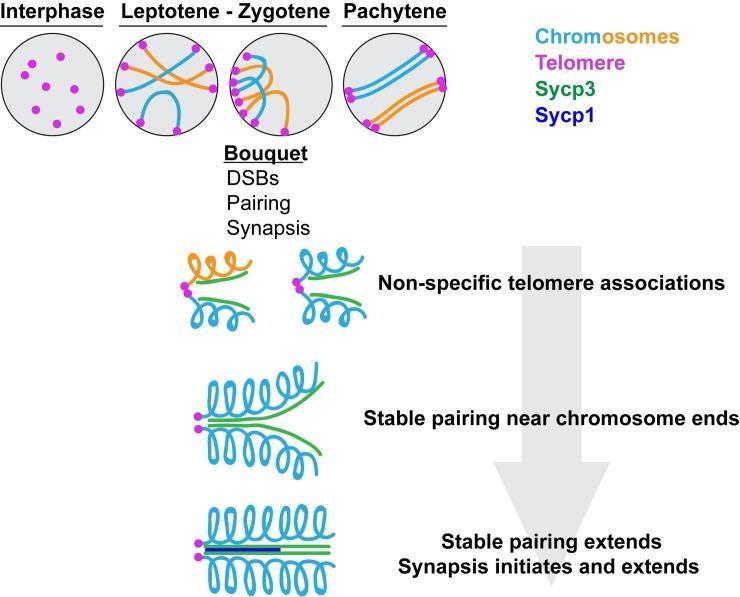
A pathophysiology diagram illustrating the progression of homologous chromosome pairing and synapsis during meiotic prophase I. The visual is divided into three primary stages: Interphase, Leptotene-Zygotene, and Pachytene. During Interphase, chromosomes are dispersed with randomly distributed telomeres (purple dots). The transition to Leptotene-Zygotene shows the formation of a 'bouquet' structure, where telomeres cluster at one side of the nuclear envelope. This stage highlights the initiation of double-strand breaks (DSBs) and pairing. A sequential flow demonstrates the molecular mechanism: 1) Non-specific telomere associations bringing chromosome ends together; 2) Recruitment of Sycp3 (green), a lateral element of the synaptonemal complex, facilitating stable pairing near chromosome ends; and 3) Recruitment of Sycp1 (blue), representing the central region, as synapsis initiates and extends along the chromosome length. By the Pachytene stage, chromosomes are fully aligned and synapsed in pairs. This diagram serves as an educational resource for cell biology and genetics, focusing on the structural dynamics of the synaptonemal complex and the role of telomeres in meiotic organization.
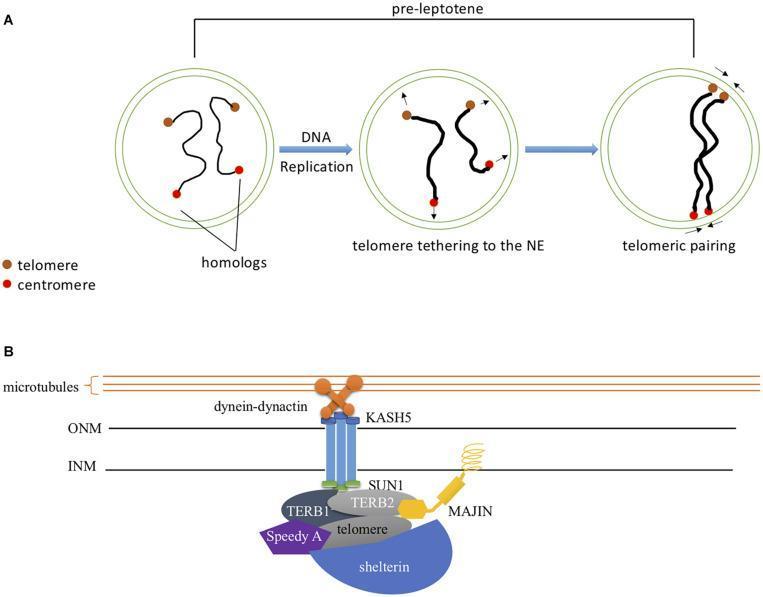
This medical illustration consists of two parts detailing the mechanisms of chromosomal pairing and nuclear envelope attachment during prophase I of meiosis. Figure A is a three-stage timeline of the 'pre-leptotene' stage showing double-strand break (DSB)-independent homolog pairing. It depicts homologous chromosomes (with brown telomeres and red centromeres) undergoing DNA replication, followed by telomere tethering to the nuclear envelope (NE), and final telomeric pairing where homologs align. Figure B is a detailed molecular diagram of the LINC (Linker of Nucleoskeleton and Cytoskeleton) complex mediating telomere-NE attachment. It illustrates the spatial arrangement of proteins across the outer nuclear membrane (ONM) and inner nuclear membrane (INM). Key components shown include microtubules and the dynein-dynactin motor linked to KASH5 in the ONM. KASH5 interacts with SUN1/SUN2 in the perinuclear space. On the nucleoplasmic side, the TERB1/2-MAJIN complex and Speedy A anchor the telomere-associated shelterin complex to the INM, facilitating chromosome movement and pairing.
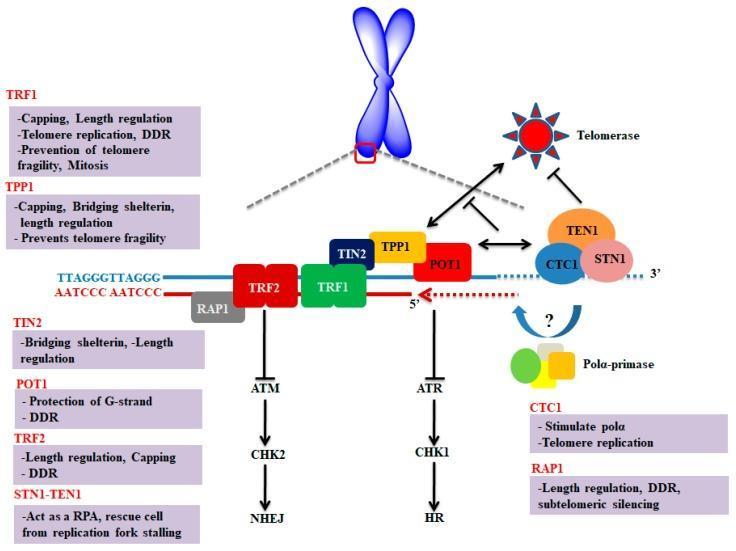
A molecular biology schematic illustrating the shelterin and CST complexes at the human telomere. The diagram depicts double-stranded telomeric DNA with hexameric repeats (TTAGGG/AATCCC). The shelterin complex is shown anchored by TRF1 and TRF2, which are bridged by TIN2 to the TPP1-POT1 subcomplex. POT1 interacts with the single-stranded 3' G-overhang. Key downstream signaling pathways are indicated: TRF2 inhibits the ATM-CHK2-NHEJ pathway, while POT1 inhibits the ATR-CHK1-HR pathway, both preventing DNA damage responses (DDR) at chromosome ends. The CST complex (CTC1, STN1, TEN1) is shown interacting with the 3' end, telomerase, and DNA polymerase alpha-primase (Polα-primase). Interaction arrows demonstrate telomerase recruitment by TPP1/POT1 and regulation of Polα-primase by the CST complex for C-strand fill-in synthesis. Accompanying text boxes summarize the functional roles of each protein in capping, length regulation, and telomere protection.
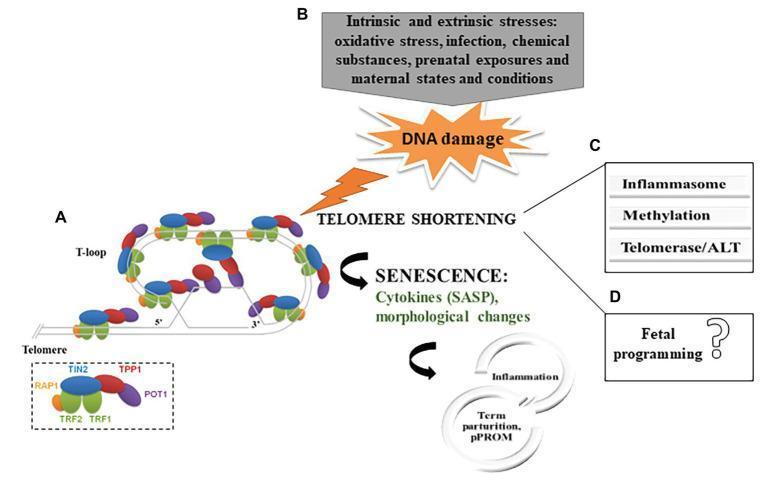
This medical infographic illustrates the role of telomere biology in parturition and gestational outcomes. Section A depicts the molecular structure of a telomere, showing the double-stranded DNA folding into a protective T-loop. It identifies the six-protein shelterin complex: TRF1, TRF2, RAP1, TIN2, TPP1, and POT1, highlighting their interaction with the 3' overhang. Section B outlines a pathophysiological pathway where intrinsic and extrinsic stressors (oxidative stress, infection, toxins) trigger DNA damage and subsequent telomere shortening. This shortening leads to cellular senescence, characterized by morphological changes and the release of cytokines (Senescence-Associated Secretory Phenotype, or SASP), ultimately driving inflammation associated with term parturition or preterm premature rupture of membranes (pPROM). Section C lists molecular consequences of telomere shortening, including inflammasome activation, altered methylation, and regulation of telomerase or Alternative Lengthening of Telomeres (ALT). Section D notes the currently uncertain link between fetal membrane telomere dysfunction and fetal programming.
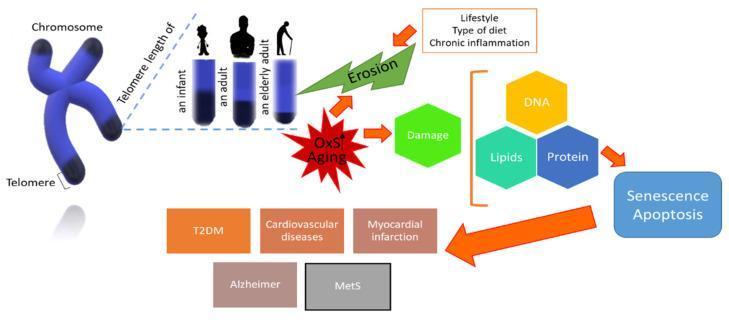
This pathophysiology diagram illustrates the process of telomere attrition and its clinical consequences during human aging. The visual is divided into three functional areas: cellular mechanisms, biomolecular damage, and clinical outcomes. On the left, an anatomical diagram of a chromosome highlights telomeres at the sister chromatid tips. A bar graph demonstrates progressive telomere shortening from infancy through adulthood to the elderly stage. Centrally, the diagram identifies Oxidative Stress (OxS), aging, and lifestyle factors (diet, chronic inflammation) as primary drivers of telomeric erosion. The central pathway shows how OxS leads to biomolecular damage of DNA, lipids, and proteins. This damage triggers cellular responses—senescence and apoptosis—depicted in a terminal flow node. The rightmost section links these cellular changes to a spectrum of age-related metabolic and systemic diseases, including Type 2 Diabetes Mellitus (T2DM), cardiovascular diseases, myocardial infarction, Alzheimer's disease, and Metabolic Syndrome (MetS). The diagram serves as an educational summary of the geroscience hypothesis, connecting molecular instability to chronic clinical pathologies.
telomere telomerase aging cancer
Telomeres and Telomerase
1. Telomere Structure
| Protein | Key Role |
|---|---|
| TRF1 | Binds double-stranded TTAGGG; regulates length, mitosis |
| TRF2 | Binds dsDNA; caps telomere and inhibits ATM-CHK2-NHEJ pathway |
| POT1 | Binds single-stranded G-overhang; inhibits ATR-CHK1-HR pathway; modulates telomerase access |
| TIN2 | Bridges TRF1/TRF2 to TPP1-POT1; length regulation |
| TPP1 | Bridges TIN2 to POT1; recruits telomerase |
| RAP1 | Subtelomeric silencing, DDR, length regulation |
2. The End-Replication Problem
- At birth: telomeres ~15 kb (germline cells)
- Normal somatic loss: ~40-60 bp/year in peripheral blood leukocytes
- When telomeres become critically short: p53 pathway activation → proliferative arrest and apoptosis
- If arrest is bypassed: chromosome end-to-end fusions, aneuploidy, chromosomal instability
3. Telomerase: Structure and Mechanism
| Component | Gene | Function |
|---|---|---|
| TERT (telomerase reverse transcriptase) | TERT | Catalytic subunit; synthesizes new TTAGGG repeats |
| TERC (telomerase RNA component) | TERC | Built-in ~450-nt RNA template |
| Dyskerin | DKC1 | Stabilizes the holoenzyme complex |
| TCAB1 | WRAP53 | Directs telomerase to Cajal bodies for processing and elongation |
- Stimulated by: MYC, sex hormones, and numerous growth factors
- Repressed in most differentiated somatic cells - the TERT gene is highly silenced
- Active in: embryonic stem cells, germ cells, highly proliferative adult stem cells (bone marrow, lymphocytes), and ~85-90% of cancer cells
4. Telomere Length Over a Lifetime
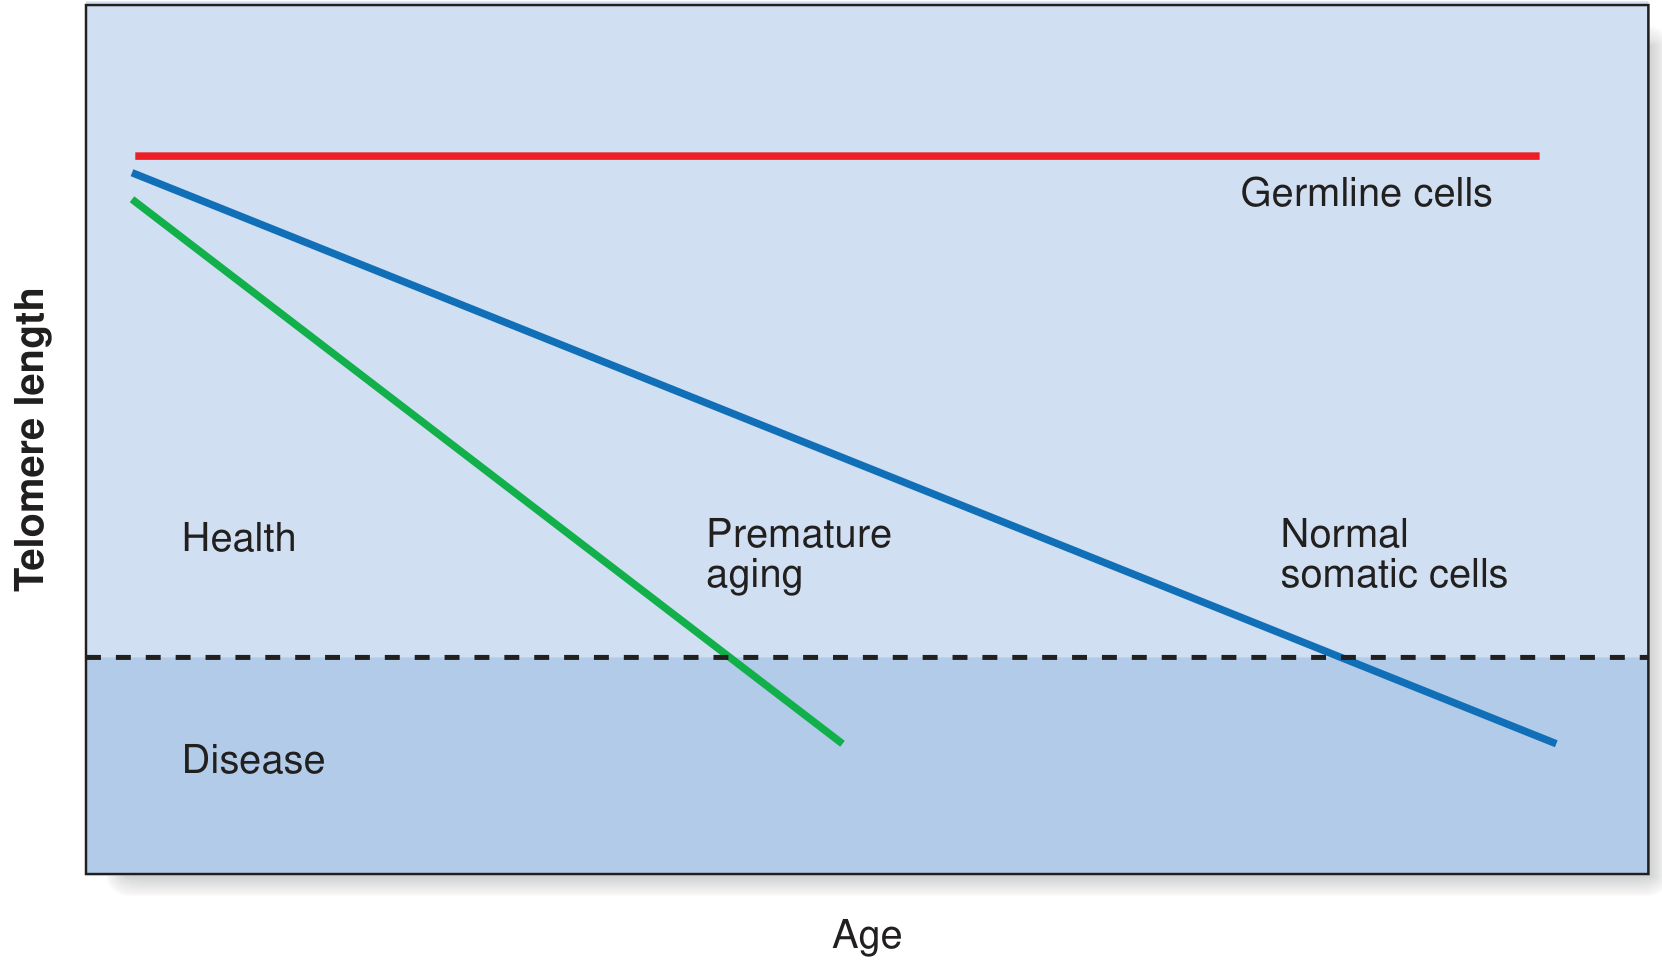
- Germline cells: telomere length maintained throughout life (high telomerase)
- Normal somatic cells: slow progressive shortening - disease risk rises in elderly
- Premature aging syndromes (e.g., dyskeratosis congenita, ataxia telangiectasia): accelerated shortening - cancer risk high from early adulthood
5. Telomere Biology and Cancer
Early carcinogenesis - Telomere shortening promotes instability
Established cancer - Telomerase reactivation sustains proliferation
6. Telomere Diseases (Telomeropathies)
| Disease | Gene(s) Most Commonly Mutated | Main Features |
|---|---|---|
| Dyskeratosis congenita | DKC1, TERT, TERC, TINF2 | Skin pigmentation, nail dystrophy, oral leukoplakia, aplastic anemia, pulmonary fibrosis |
| Idiopathic pulmonary fibrosis | TERT, TERC | Progressive lung scarring |
| Aplastic anemia | TERT, TERC, RTEL1 | Bone marrow failure |
| Liver disease/cirrhosis | TERT, TERC | Cryptogenic liver fibrosis |
| Long telomere syndrome | POT1 (loss-of-function) | Excessively long telomeres, clonal hematopoiesis, predisposition to benign and malignant tumors |
7. Telomere Length Measurement
- Short: below 10th percentile for age
- Very short: below 1st percentile
- Very long: above 99th percentile
- Flow-FISH (flow cytometry + fluorescence in situ hybridization) - cell-by-cell measurement, preferred for clinical diagnosis
- qPCR - higher throughput, suitable for epidemiologic studies
Note: Despite commercial claims, telomere length testing has not been validated as a measure of biological age or a guide to lifestyle interventions in the absence of a genetic telomere disease (Harrison's 22E).
8. Aging, Disease, and Telomere Attrition
9. Therapeutic Implications
- Telomerase inhibitors (e.g., imetelstat, GRN163L) are being studied in cancer, targeting the 85-90% of tumors that depend on telomerase
- Telomerase activators (e.g., TA-65, a cycloastragenol compound) are marketed for anti-aging but lack robust clinical evidence
- Androgens (danazol, others) increase TERT transcription and are used in some telomeropathies (aplastic anemia, dyskeratosis congenita) to modestly boost telomere maintenance