
Hi
Abg
What would you like to know about ABG?
arterial blood gas interpretation acid base disorders flowchart
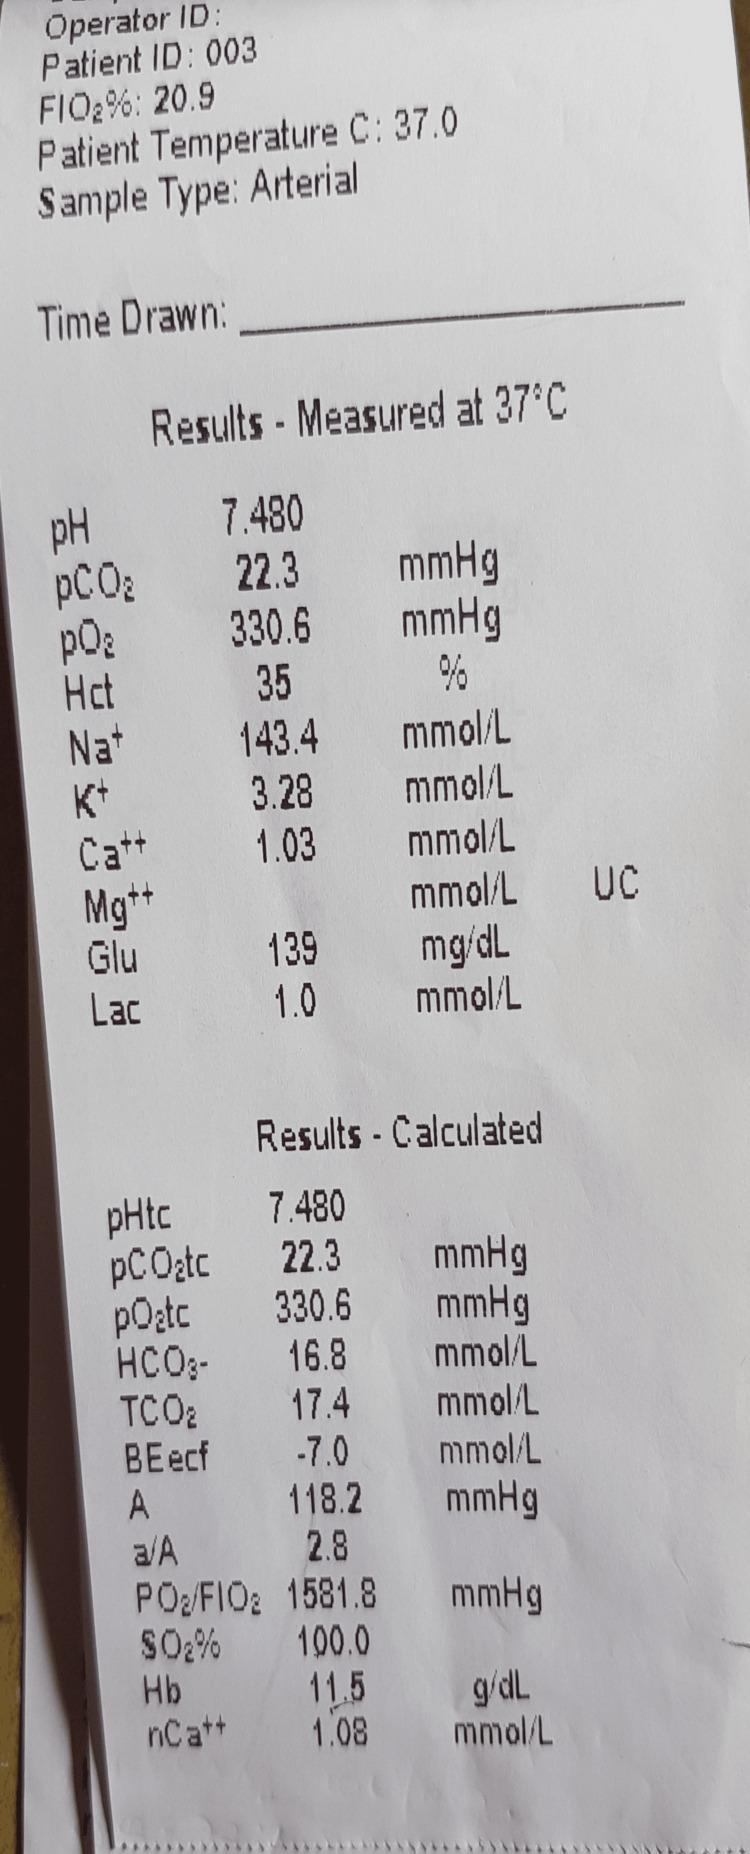
A clinical photograph of a printed arterial blood gas (ABG) analysis report. The document displays measured and calculated physiological values at a patient temperature of 37.0°C. Key measured values include a pH of 7.480, pCO2 of 22.3 mmHg, pO2 of 330.6 mmHg, and electrolyte levels (Na+ 143.4 mmol/L, K+ 3.28 mmol/L, Ca++ 1.03 mmol/L). Calculated values show a bicarbonate (HCO3-) level of 16.8 mmol/L and an oxygen saturation (SO2%) of 100.0%. This visual demonstrates a 'saturation gap' characteristic of certain toxicological conditions, such as methemoglobinemia, where the calculated oxygen saturation from the ABG appears normal (100%) despite the patient potentially experiencing clinical cyanosis and low peripheral pulse oximetry readings. The image is an educational tool for critical care, emergency medicine, and clinical toxicology, illustrating the interpretation of acid-base balance and oxygenation status.
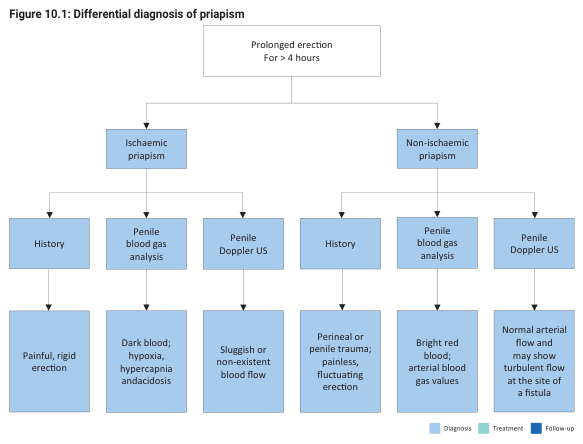
Summary : This flowchart provides a structured approach for the differential diagnosis of priapism, distinguishing between ischaemic and non-ischaemic types based on clinical history, penile blood gas analysis, and penile Doppler ultrasound findings. flowchart: # Nodes : • Prolonged erection for > 4 hours (rectangle) • Ischaemic priapism (rectangle) • Non-ischaemic priapism (rectangle) • History (rectangle, under both ischaemic and non-ischaemic) • Penile blood gas analysis (rectangle, under both ischaemic and non-ischaemic) • Penile Doppler US (rectangle, under both ischaemic and non-ischaemic) • Painful, rigid erection (rectangle, under ischaemic history) • Dark blood; hypoxia, hypercapnia and acidosis (rectangle, under ischaemic blood gas) • Sluggish or non-existent blood flow (rectangle, under ischaemic Doppler) • Perineal or penile trauma; painless, fluctuating erection (rectangle, under non-ischaemic history) • Bright red blood; arterial blood gas values (rectangle, under non-ischaemic blood gas) • Normal arterial flow and may show turbulent flow at the site of a fistula (rectangle, under non-ischaemic Doppler) # Connectors : • Prolonged erection for > 4 hours splits into Ischaemic priapism and Non-ischaemic priapism. • Each type (ischaemic, non-ischaemic) branches into three parallel diagnostic steps: History, Penile blood gas analysis, Penile Doppler US. • Each diagnostic step leads to a specific clinical finding node. # Layout : • Top-down hierarchical structure. • Two main branches (ischaemic vs. non-ischaemic) with three parallel sub-branches each. • All nodes are rectangles. • Colour coding: Diagnosis (light blue), Treatment (teal, not present in this crop), Follow-up (dark blue, not present in this crop). # Analysis : • The flowchart clearly separates ischaemic from non-ischaemic priapism based on history, blood gas, and Doppler findings. • Ischaemic priapism is associated with pain, dark blood, and poor blood flow, indicating a low-oxygen, high-carbon dioxide, and acidic environment. • Non-ischaemic priapism is typically painless, associated with trauma, bright red blood, and normal or turbulent arterial flow, suggesting an arterial fistula. • The chart provides a logical, stepwise approach for clinicians to differentiate between the two types using clinical and laboratory data.
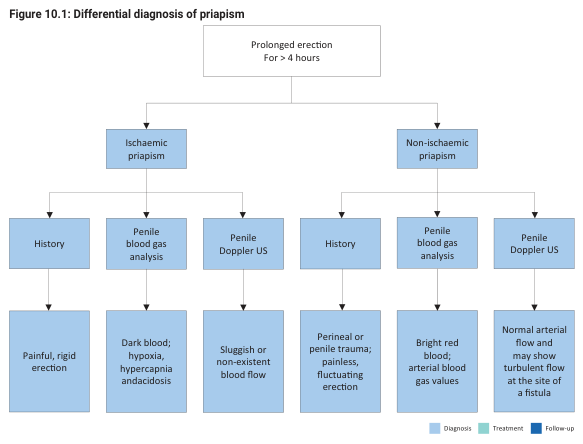
Summary : This flowchart provides a differential diagnosis pathway for priapism, distinguishing between ischaemic and non-ischaemic types based on clinical history, penile blood gas analysis, and penile Doppler ultrasound findings. flowchart: # Nodes : • Start (rectangle): "Prolonged erection For > 4 hours" • Decision (rectangle): "Ischaemic priapism" • Decision (rectangle): "Non-ischaemic priapism" • History (rectangle, under Ischaemic): "History" • Penile blood gas analysis (rectangle, under Ischaemic): "Penile blood gas analysis" • Penile Doppler US (rectangle, under Ischaemic): "Penile Doppler US" • History (rectangle, under Non-ischaemic): "History" • Penile blood gas analysis (rectangle, under Non-ischaemic): "Penile blood gas analysis" • Penile Doppler US (rectangle, under Non-ischaemic): "Penile Doppler US" • Outcome (rectangle, under Ischaemic History): "Painful, rigid erection" • Outcome (rectangle, under Ischaemic Blood Gas): "Dark blood; hypoxia, hypercapnia and acidosis" • Outcome (rectangle, under Ischaemic Doppler): "Sluggish or non-existent blood flow" • Outcome (rectangle, under Non-ischaemic History): "Perineal or penile trauma; painless, fluctuating erection" • Outcome (rectangle, under Non-ischaemic Blood Gas): "Bright red blood; arterial blood gas values" • Outcome (rectangle, under Non-ischaemic Doppler): "Normal arterial flow and may show turbulent flow at the site of a fistula" # Connectors : • "Prolonged erection For > 4 hours" splits into two branches: "Ischaemic priapism" and "Non-ischaemic priapism". • Each type (ischaemic/non-ischaemic) branches into three diagnostic modalities: History, Penile blood gas analysis, Penile Doppler US. • Each diagnostic modality leads to a specific outcome node describing findings. # Layout : • The flowchart is organized as a top-down tree. • The initial node splits horizontally into two main branches (ischaemic vs. non-ischaemic). • Each branch further splits into three parallel diagnostic pathways, each with its own outcome. # Analysis : • The flowchart clearly distinguishes ischaemic priapism (painful, rigid, with dark blood and poor flow) from non-ischaemic priapism (often trauma-related, painless, with bright red blood and normal/turbulent flow). • Diagnostic steps are parallel for both types, emphasizing the importance of history, blood gas analysis, and Doppler ultrasound in differentiation. • Colour coding (blue for diagnosis, teal for treatment, grey for follow-up) is present but not detailed in the text.
Arterial Blood Gas (ABG) - Complete Overview
What is an ABG?
Normal Values
| Parameter | Normal Value | Range |
|---|---|---|
| pH | 7.40 | 7.35 - 7.45 |
| PaCO2 | 40 mmHg | 38 - 42 mmHg |
| PaO2 | 100 mmHg | 75 - 100 mmHg |
| HCO3- | 24 mEq/L | 22 - 26 mEq/L |
| Base Excess | 0 | -4 to +4 |
Step-by-Step ABG Interpretation
- pH < 7.35 = Acidemia
- pH > 7.45 = Alkalemia
- In respiratory disorders: PaCO2 moves opposite to pH
- PaCO2 high + pH low = Respiratory acidosis
- PaCO2 low + pH high = Respiratory alkalosis
- In metabolic disorders: PaCO2 moves same direction as pH (compensation)
- HCO3- low = Metabolic acidosis
- HCO3- high = Metabolic alkalosis
- Values > +4 = Alkalosis
- Values < -4 = Acidosis (base deficit)
- Bicarbonate deficit = 1/3 x body weight (kg) x base deficit
- Assess for hypoxemia (may coexist with any acid-base disorder)
The 4 Primary Disorders + Compensation
| Disorder | pH | PaCO2 | HCO3- | Compensation |
|---|---|---|---|---|
| Respiratory Acidosis | ↓ | ↑ | ↑ (renal) | HCO3- rises ~1 mEq/L per 10 mmHg CO2 rise (acute); ~3.5 (chronic) |
| Respiratory Alkalosis | ↑ | ↓ | ↓ (renal) | HCO3- falls ~2 mEq/L per 10 mmHg CO2 drop (acute); ~5 (chronic) |
| Metabolic Acidosis | ↓ | ↓ (respiratory) | ↓ | Winter's formula: Expected PaCO2 = 1.5 x HCO3- + 8 ± 2 |
| Metabolic Alkalosis | ↑ | ↑ (respiratory) | ↑ | Expected PaCO2 = 0.7 x HCO3- + 21 ± 2 |
Anion Gap (in Metabolic Acidosis)
- M - Methanol, Metformin, Muscle injury (rhabdomyolysis)
- U - Uremia
- D - DKA / other ketoacidosis
- P - Propylene glycol, Paraldehyde
- I - Isoniazid, Iron
- L - Lactic acidosis
- E - Ethanol, Ethylene glycol
- S - Salicylates, Short gut
- Diarrhea, renal tubular acidosis, excess normal saline administration, GI fistulas
Oxygenation Assessment
Pulse oximetry vs ABG: The pulse oximeter cannot detect hypercapnia, and in a patient on supplemental oxygen, it cannot detect hypoventilation at all - because supplemental O2 shifts PaO2 onto the flat portion of the oxyhemoglobin dissociation curve. ABG is mandatory when CO2 status matters. - Murray & Nadel's Respiratory Medicine
Sample ABG Report (for reference)