
Somatosesnsory evoked potential for 5 marks anesthesia residency
somatosensory evoked potential SSEP anesthesia intraoperative monitoring components clinical significance
https://www.ncbi.nlm.nih.gov/books/NBK544358
somatosensory evoked potential SSEP waveform components diagram
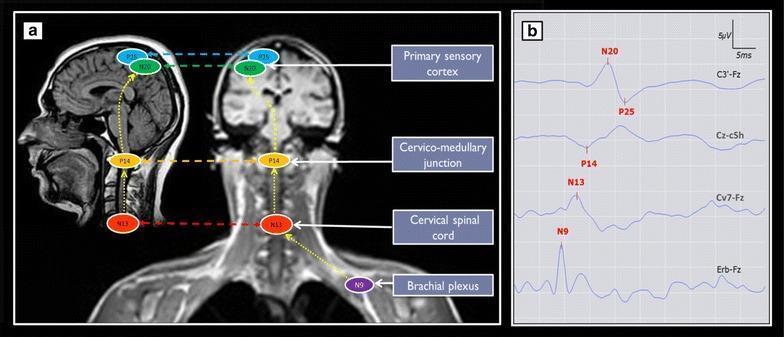
This dual-panel educational graphic illustrates the neuroanatomical origins and typical waveforms of median nerve somatosensory evoked potentials (SSEPs). Panel (a) features sagittal and coronal MRI sections of the head and neck, mapping specific SSEP components to their anatomical generators. Key markers include N9 at the brachial plexus (Erb's point), N13 at the cervical spinal cord, P14 at the cervico-medullary junction, and N20/P25 at the primary sensory cortex. Yellow dashed lines represent the ascending somatosensory pathway from the peripheral nerve to the cortex. Panel (b) displays corresponding normal physiological waveforms across four standard recording montages: Erb-Fz (showing the N9 peak), Cv7-Fz (N13 peak), Cz-cSh (P14 subcortical potential), and C3'-Fz (cortical N20 peak and P25 trough). The graphic provides a clinical correlation between neuroimaging and neurophysiological monitoring, useful for identifying site-specific conduction delays or signal abolishment in neurology and intensive care settings.
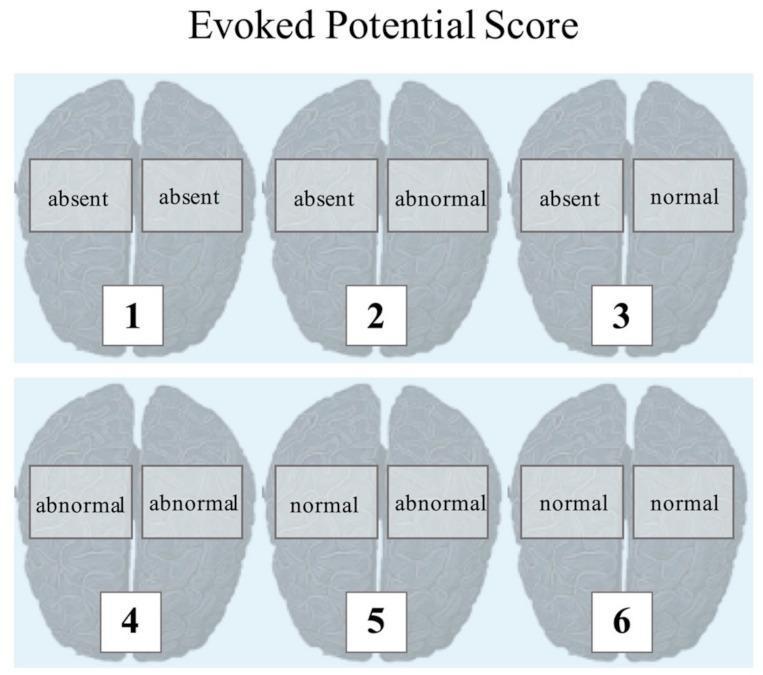
This medical infographic illustrates the scoring system for the Evoked Potential Score (EPS), used in assessing Somatosensory Evoked Potentials (SSEP) and Brainstem Auditory Evoked Potentials (BAEP) in neurological patients. The layout features six anatomical diagrams of the human brain from a superior (top-down) view, arranged in a 2x3 grid. Each brain is divided into left and right hemispheres, each labeled with a qualitative assessment: 'absent', 'abnormal', or 'normal'. Each diagram corresponds to a numerical EPS value from 1 to 6. The sequence demonstrates a hierarchical progression of electrophysiological recovery or function: (1) Bilateral absent, (2) Left absent/Right abnormal, (3) Left absent/Right normal, (4) Bilateral abnormal, (5) Left normal/Right abnormal, and (6) Bilateral normal. This grading system provides a standardized method for clinicians to quantify neurophysiological status, specifically in contexts like poor-grade subarachnoid hemorrhage (SAH) or ventilator weaning, where prognostic markers for neurological improvement and the modified Rankin Scale (mRS) are evaluated.
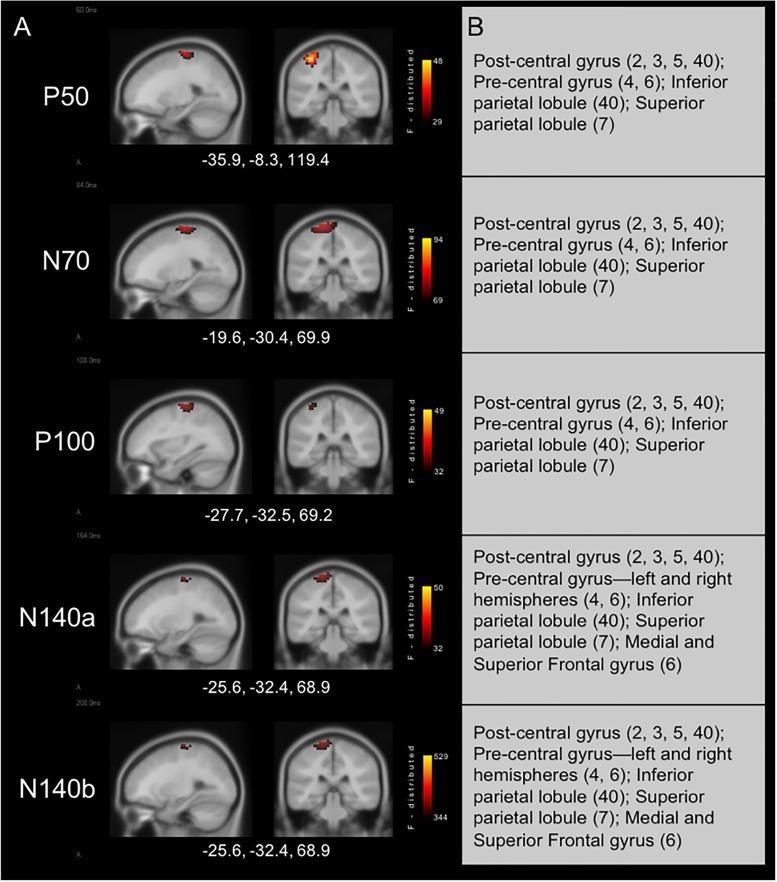
This medical figure presents current density reconstructions (CDR) and corresponding anatomical localizations for cortical somatosensory evoked potential (CSEP) waveform components (P50, N70, P100, N140a, and N140b) in children with normal hearing. Panel A displays sLORETA-derived cortical activations mapped onto sagittal and coronal MRI slices, accompanied by MNI coordinates. The likelihood of activation is indicated by an F-distribution color scale ranging from black (minimum) to yellow (maximum). Panel B provides a summary table of the significant brain regions involved. For the early components (P50, N70, P100), activation is primarily localized to the left hemisphere within the post-central gyrus (Brodmann areas 2, 3, 5, 40), pre-central gyrus (BA 4, 6), and the inferior/superior parietal lobules (BA 40, 7). Late components (N140a, N140b) demonstrate similar parietal activity but show additional involvement of the medial and superior frontal gyri (BA 6) and bilateral activation of the pre-central gyrus. These maps illustrate the typical spatio-temporal progression of cortical processing following right-sided vibrotactile stimulation.
Somatosensory Evoked Potentials (SSEP)
Definition
Neural Pathway Monitored
- Peripheral nerve → dorsal root ganglion
- Ipsilateral dorsal columns of spinal cord
- Dorsal column nuclei (nucleus gracilis/cuneatus) at the medulla
- Medial lemniscus (decussates here) → brainstem
- Ventroposterolateral (VPL) nucleus of thalamus
- Contralateral primary somatosensory cortex (S1)
Note: SSEPs monitor the posterior (sensory) cord only, NOT the anterior motor pathways.
Waveform Components (Median Nerve Stimulation)
| Peak | Generator | Recording Site |
|---|---|---|
| N9 (Erb's point) | Brachial plexus | Shoulder (Erb's point) |
| N11 | Cervical posterior columns/spinal roots | Cervical spine |
| N13/P13 | Dorsal column nuclei (cervicomedullary junction) | C5-C7 electrode |
| N14/N15 | Brainstem / thalamus | Subcortical |
| N19/N20 (P22) | Primary somatosensory cortex (S1) | Contralateral scalp (C3'/C4') |
Critical Change Criteria (Alert Values)
- Amplitude decrease ≥ 50% from baseline (most sensitive indicator)
- Latency increase ≥ 10% from baseline
Surgical Indications for SSEP Monitoring
- Scoliosis / spinal deformity correction (standard of care)
- Spinal cord tumor resection
- Cervical and thoracic spine surgery
- Aortic surgery (thoracic aortic cross-clamping)
- Carotid endarterectomy (cerebral ischemia detection)
- Brainstem and skull base surgeries
- Cerebral aneurysm clipping
Effects of Anesthetic Agents on SSEP
| Agent | Amplitude | Latency | Clinical Note |
|---|---|---|---|
| Volatile agents (halothane, isoflurane, sevoflurane, desflurane) | ↓↓ (dose-dependent) | ↑↑ | Most potent depression; isoflurane > halothane; avoid > 0.5 MAC |
| Nitrous oxide (60-70%) | ↓ ~50% (cortical) | Minimal change | Subcortical waveforms preserved; best avoided |
| Propofol | Minimal | Minimal | Drug of choice for SSEP monitoring; early cortical SSEPs well preserved |
| Barbiturates (thiopental) | Transient ↓ | Transient ↑ (<10 min) | Recovers; early cortical preserved even at isoelectric EEG doses |
| Etomidate | ↑ (increases) | ↑ (bolus) | Unique - enhances cortical amplitude; useful in poor-baseline patients |
| Opioids | Minimal | Minimal | Safe; do not significantly affect SSEPs |
| Benzodiazepines | ↓ mild | ↑ mild | Moderate effect; use with caution |
| Ketamine | ↑ | Variable | May enhance amplitude |
| Dexmedetomidine | Minimal | Minimal | Compatible with all evoked potential monitoring |
| Neuromuscular blockers | No effect | No effect | Have no direct effect on neural recording |
Optimal Anesthetic Technique for SSEP Monitoring
- Propofol infusion + opioid (remifentanil/fentanyl) ± low-dose dexmedetomidine
- Avoid nitrous oxide and high-dose volatile agents
- Maintain constant anesthetic depth (avoid boluses or concentration changes during critical monitoring periods)
- Keep physiological parameters stable: normotension, normothermia, normocapnia, adequate hemoglobin
Physiological Factors Altering SSEPs
- Hypothermia - increases latency, decreases amplitude
- Hypotension / reduced spinal cord perfusion - critical cause of amplitude loss
- Hypoxia / anemia - reduces amplitude
- Hypercapnia - variable effects
- Hyperthermia - decreases latency
Limitations of SSEP
- Monitors only dorsal columns - cannot detect isolated anterior cord injury (motor system)
- False negatives: rare but documented (preserved SSEP with postoperative motor deficit)
- False positives: from anesthetic changes, technical artifacts, cautery interference
- Not reliable in patients with severe pre-existing peripheral neuropathy
- Requires signal averaging (multiple stimuli) - introduces time delay
SSEP vs. MEP - Key Comparison
| Feature | SSEP | MEP |
|---|---|---|
| Pathway | Dorsal column (sensory) | Corticospinal (motor) |
| Alert criteria | Amplitude ↓50%, latency ↑10% | Amplitude ↓50-80% |
| Effect of NMBs | None | Significant - muscle relaxants abolished |
| Hypotension sensitivity | Moderate | High (more sensitive) |
Key Points for Exam
- SSEP stimulation is typically at 3-5 Hz, with 200-1000 repetitions averaged to extract signal from noise
- The N20 cortical response is the most clinically used waveform
- Propofol-based TIVA is the anesthetic of choice
- Etomidate uniquely increases cortical SSEP amplitude - used as a rescue agent
- The scoliosis research society endorses SSEP as standard of care for scoliosis surgery
- Combined SSEP + MEP monitoring has largely replaced the wake-up test (Stagnara test)