Multiple myeloma radiological and clinical d
Reading File
Finding Sources
Finding Sources
Searching PubMed
"multiple myeloma"[MeSH Terms] AND "diagnosis"[MeSH Terms]
Reading File
Reading File
Reading File
Reading File
Finding Sources
Loading Image
Reading File
Loading Image
Loading Image
Reading File
I now have all the key material needed. Here is a comprehensive overview of multiple myeloma covering both its clinical and radiological features.
Multiple Myeloma: Clinical and Radiological Features
Overview
Multiple myeloma (MM) is the most common primary malignant neoplasm of bone and accounts for approximately 1.3% of all malignant disease and 15% of haematological malignancies. About 30,000 new cases are diagnosed annually in the United States. The median age at diagnosis is 66-70 years; 75% of patients are over 50, and only ~3% present before age 40. There is a male predominance of up to 2:1, and it occurs more frequently in people of African descent.
- Grainger & Allison's Diagnostic Radiology, p. 1700
- Robbins & Kumar Basic Pathology, p. 421
Pathogenesis
Myeloma arises from clonal plasma cells in the bone marrow. Common molecular events include:
- Chromosomal translocations fusing the IgH locus (chromosome 14) to oncogenes such as cyclin D1 and cyclin D3, driving cell proliferation
- IL-6 produced by bone marrow stromal cells is the primary proliferative cytokine
- RANKL upregulation by myeloma-derived factors activates osteoclasts while simultaneously inhibiting osteoblasts - the net result is bone resorption, hypercalcemia, and pathological fractures
- Late-stage disease may show MYC translocations
The M protein produced is most commonly IgG (60%), followed by IgA (20-25%). The remainder secrete only κ or λ light chains (Bence Jones proteins).
- Robbins & Kumar Basic Pathology, p. 421
Clinical Features ("CRAB" Criteria)
The hallmark end-organ manifestations are summarised as CRAB:
| Feature | Details |
|---|---|
| C - Hypercalcemia | Serum calcium >2.75 mmol/L (>11 mg/dL), from osteoclast-driven bone resorption |
| R - Renal insufficiency | Creatinine clearance <40 mL/min or serum creatinine ≥177 µmol/L (≥2 mg/dL) |
| A - Anemia | Hemoglobin <10 g/dL or >2 g/dL below lower limit of normal |
| B - Bone lesions | ≥1 lytic lesion on imaging (skeletal survey, CT, PET/CT, or MRI) |
Additional "SLiM" biomarkers (added 2014 IMWG criteria) that also define myeloma requiring treatment:
- Serum free light chain ratio ≥100 (involved/uninvolved)
- Light chain: ≥60% clonal plasma cells in bone marrow
- MRI: >1 focal lesion ≥5 mm
- Goldman-Cecil Medicine, Table 173-2 (IMWG 2014 criteria)
Symptoms at Presentation
- Bone pain and backache - most common presenting symptom
- Weakness and fatigue - from anemia
- Pathological fracture - presents this way in ~1/5 of cases, most often axial skeleton
- Recurrent bacterial infections - from hypogammaglobulinemia (functional antibody production is profoundly depressed despite high total Ig)
- Renal dysfunction - from light chain cast nephropathy (Bence Jones proteins in distal tubules/collecting ducts), light chain amyloid deposits, hypercalcemia, and dehydration
- Amyloidosis - reported in approximately 20% of patients
- Hyperviscosity syndrome - particularly with IgA or IgM types
- Grainger & Allison's, p. 1700; Robbins p. 422
Diagnostic Criteria (IMWG 2014)
Diagnosis of active multiple myeloma requires both of the following:
- Clonal bone marrow plasma cells ≥10% OR biopsy-proven plasmacytoma
- At least one myeloma-defining event (any CRAB feature or any SLiM biomarker above)
Smoldering myeloma (no treatment yet needed): serum M protein ≥3 g/dL (IgG/IgA) or urinary M protein ≥500 mg/24h, AND clonal plasma cells 10-60%, with absence of myeloma-defining events.
- Goldman-Cecil Medicine, p. 1975
Radiological Features
Plain Radiography (Skeletal Survey)
The classic appearance is multiple well-defined "punched-out" lytic lesions, most characteristic in the skull:
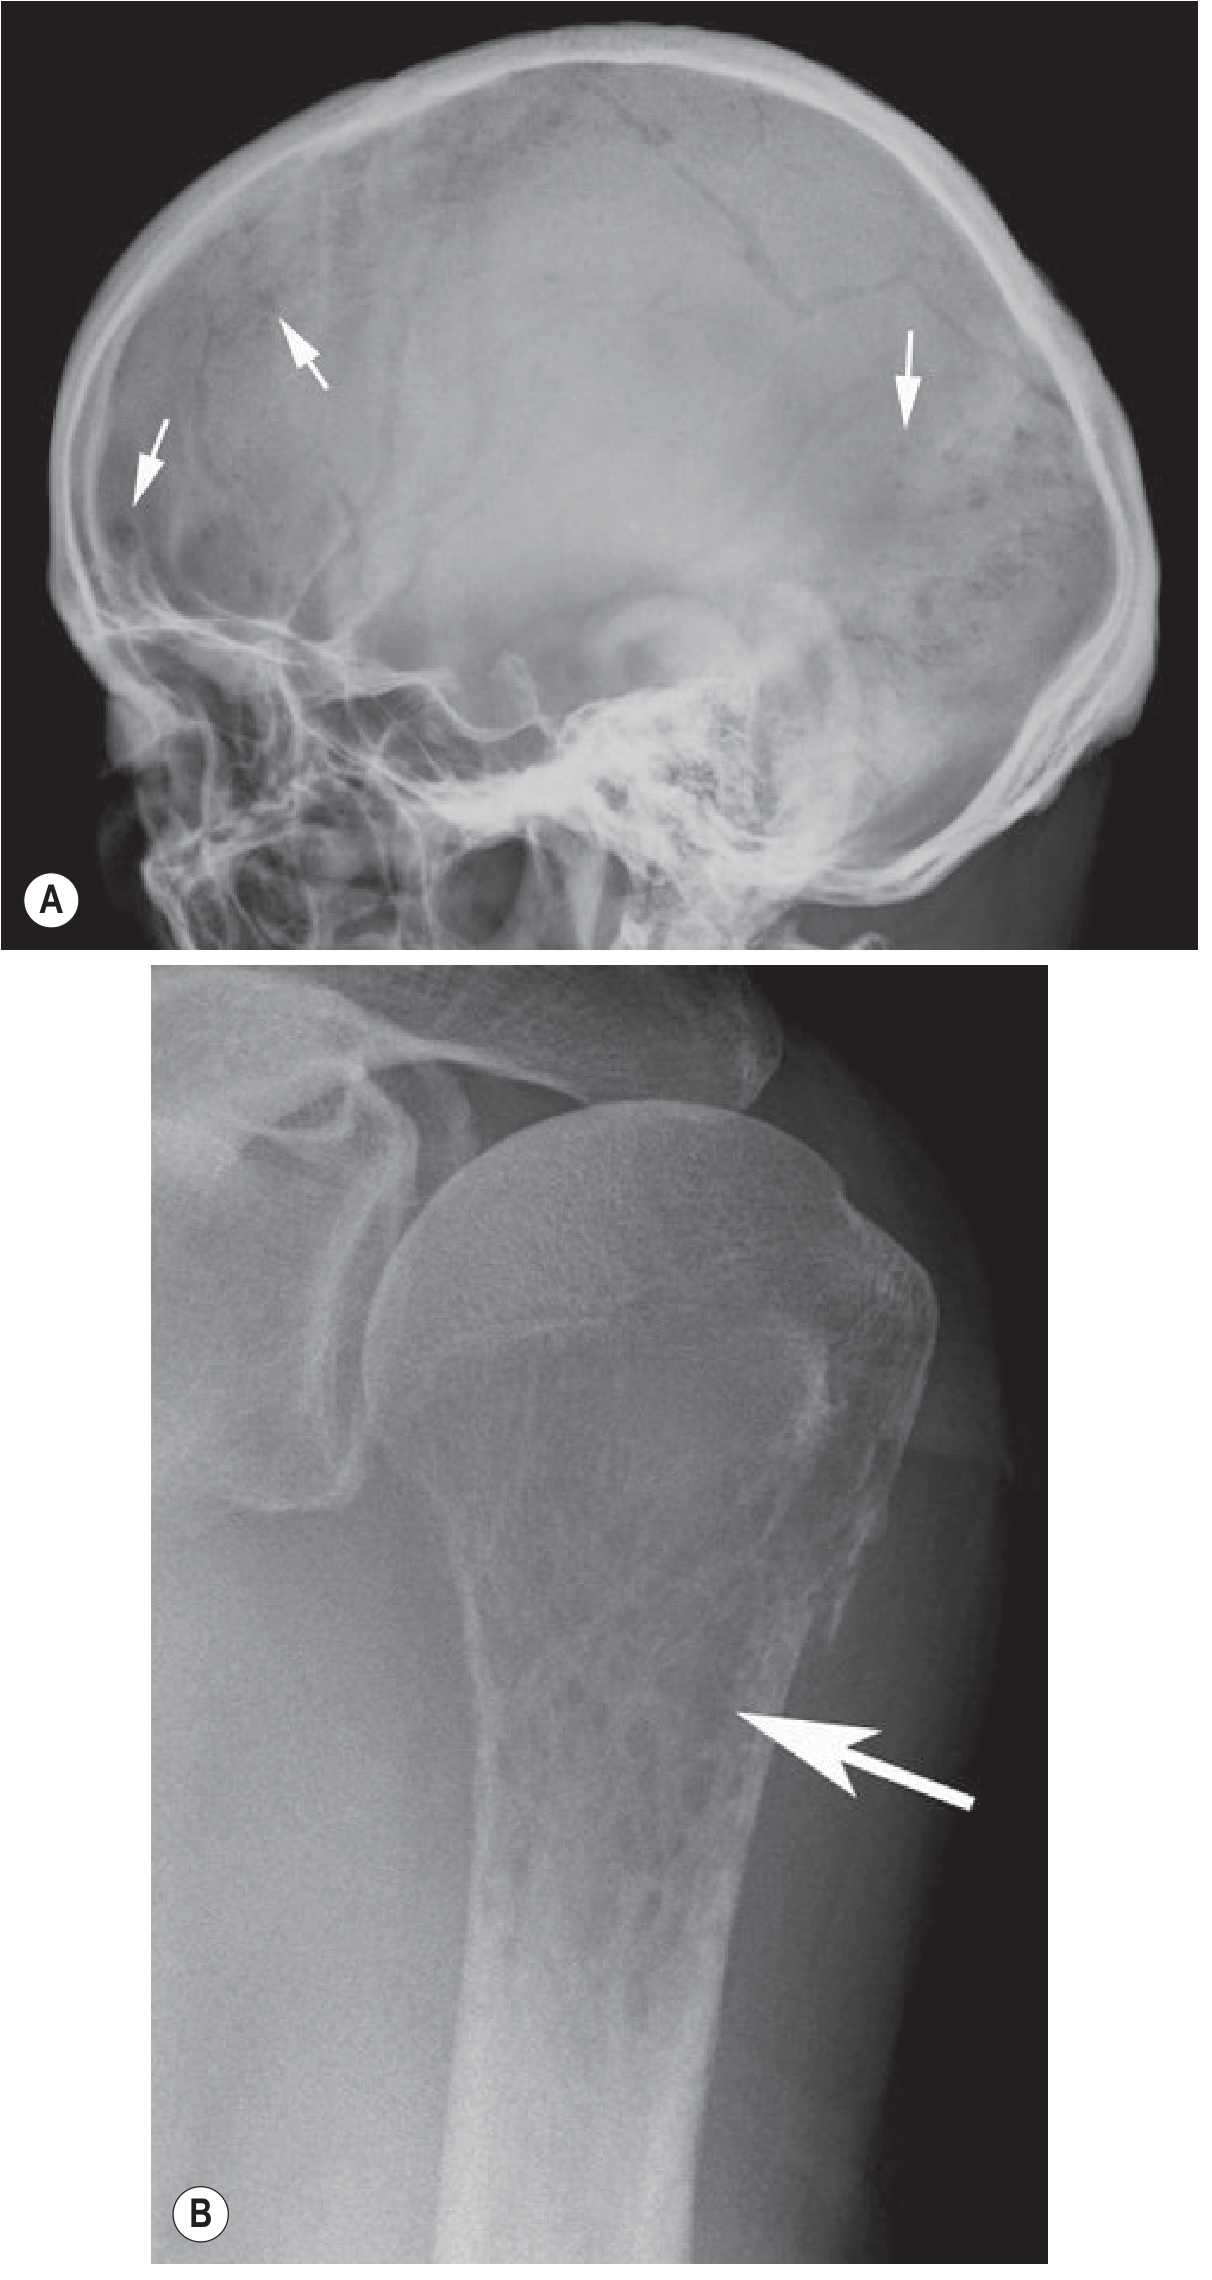
Fig. A: Skull X-ray showing the classic multiple small lytic lesions (arrows). Fig. B: Moth-eaten destruction of the proximal humerus.
Key X-ray findings:
- Punched-out lesions: well-defined, round or oval, up to 20 mm - strongly suggestive of MM (vs. metastases which tend to be larger/less defined)
- Moth-eaten or permeative destruction in more aggressive areas
- Diffuse osteopenia of the spine, often leading to vertebral compression fractures (affects ~50% of patients at some stage)
- Widespread skeletal distribution: axial skeleton and proximal long bones (vertebral column, ribs, skull, pelvis, femur, clavicle, scapula)
- No periosteal reaction - an important differentiating feature from other bone tumors
- Osteoblastic/sclerotic lesions are rare in untreated disease, but POEMS syndrome (polyneuropathy, organomegaly, endocrinopathy, M protein, skin changes) may show sclerotic myeloma
The main differential diagnosis on plain film is metastatic disease. Multiple small (<20 mm), well-defined lesions favour MM.
- Grainger & Allison's, p. 1700-1701
CT Scan (Low-Dose Whole-Body CT)
CT is far more sensitive than plain skeletal survey. Current guidelines favour whole-body low-dose CT as the first-line imaging:
- Detects purely marrow lesions appearing as focal areas of soft-tissue density
- Shows endosteal scalloping, cortical destruction, and soft-tissue masses in progressive disease
- Diffuse osteopenia of MM may be indistinguishable from osteoporosis on CT alone
MRI
MRI is the most sensitive modality for marrow involvement. Five recognised patterns:
| Pattern | Description | Frequency |
|---|---|---|
| Normal | Normal marrow signal; seen with low-grade infiltration or occasionally stage III | Minority |
| Focal | Discrete lesions >5 mm, low T1 / high T2 and STIR signal | 18-50% |
| Diffuse | Generalised T1 reduction (discs appear hyperintense relative to vertebral bodies) | Common |
| Variegated ("salt and pepper") | Mixed pattern of normal and abnormal marrow | Common |
| Combined | Focal lesions superimposed on diffuse infiltration | Less common |
MRI findings on the spine and pelvis:
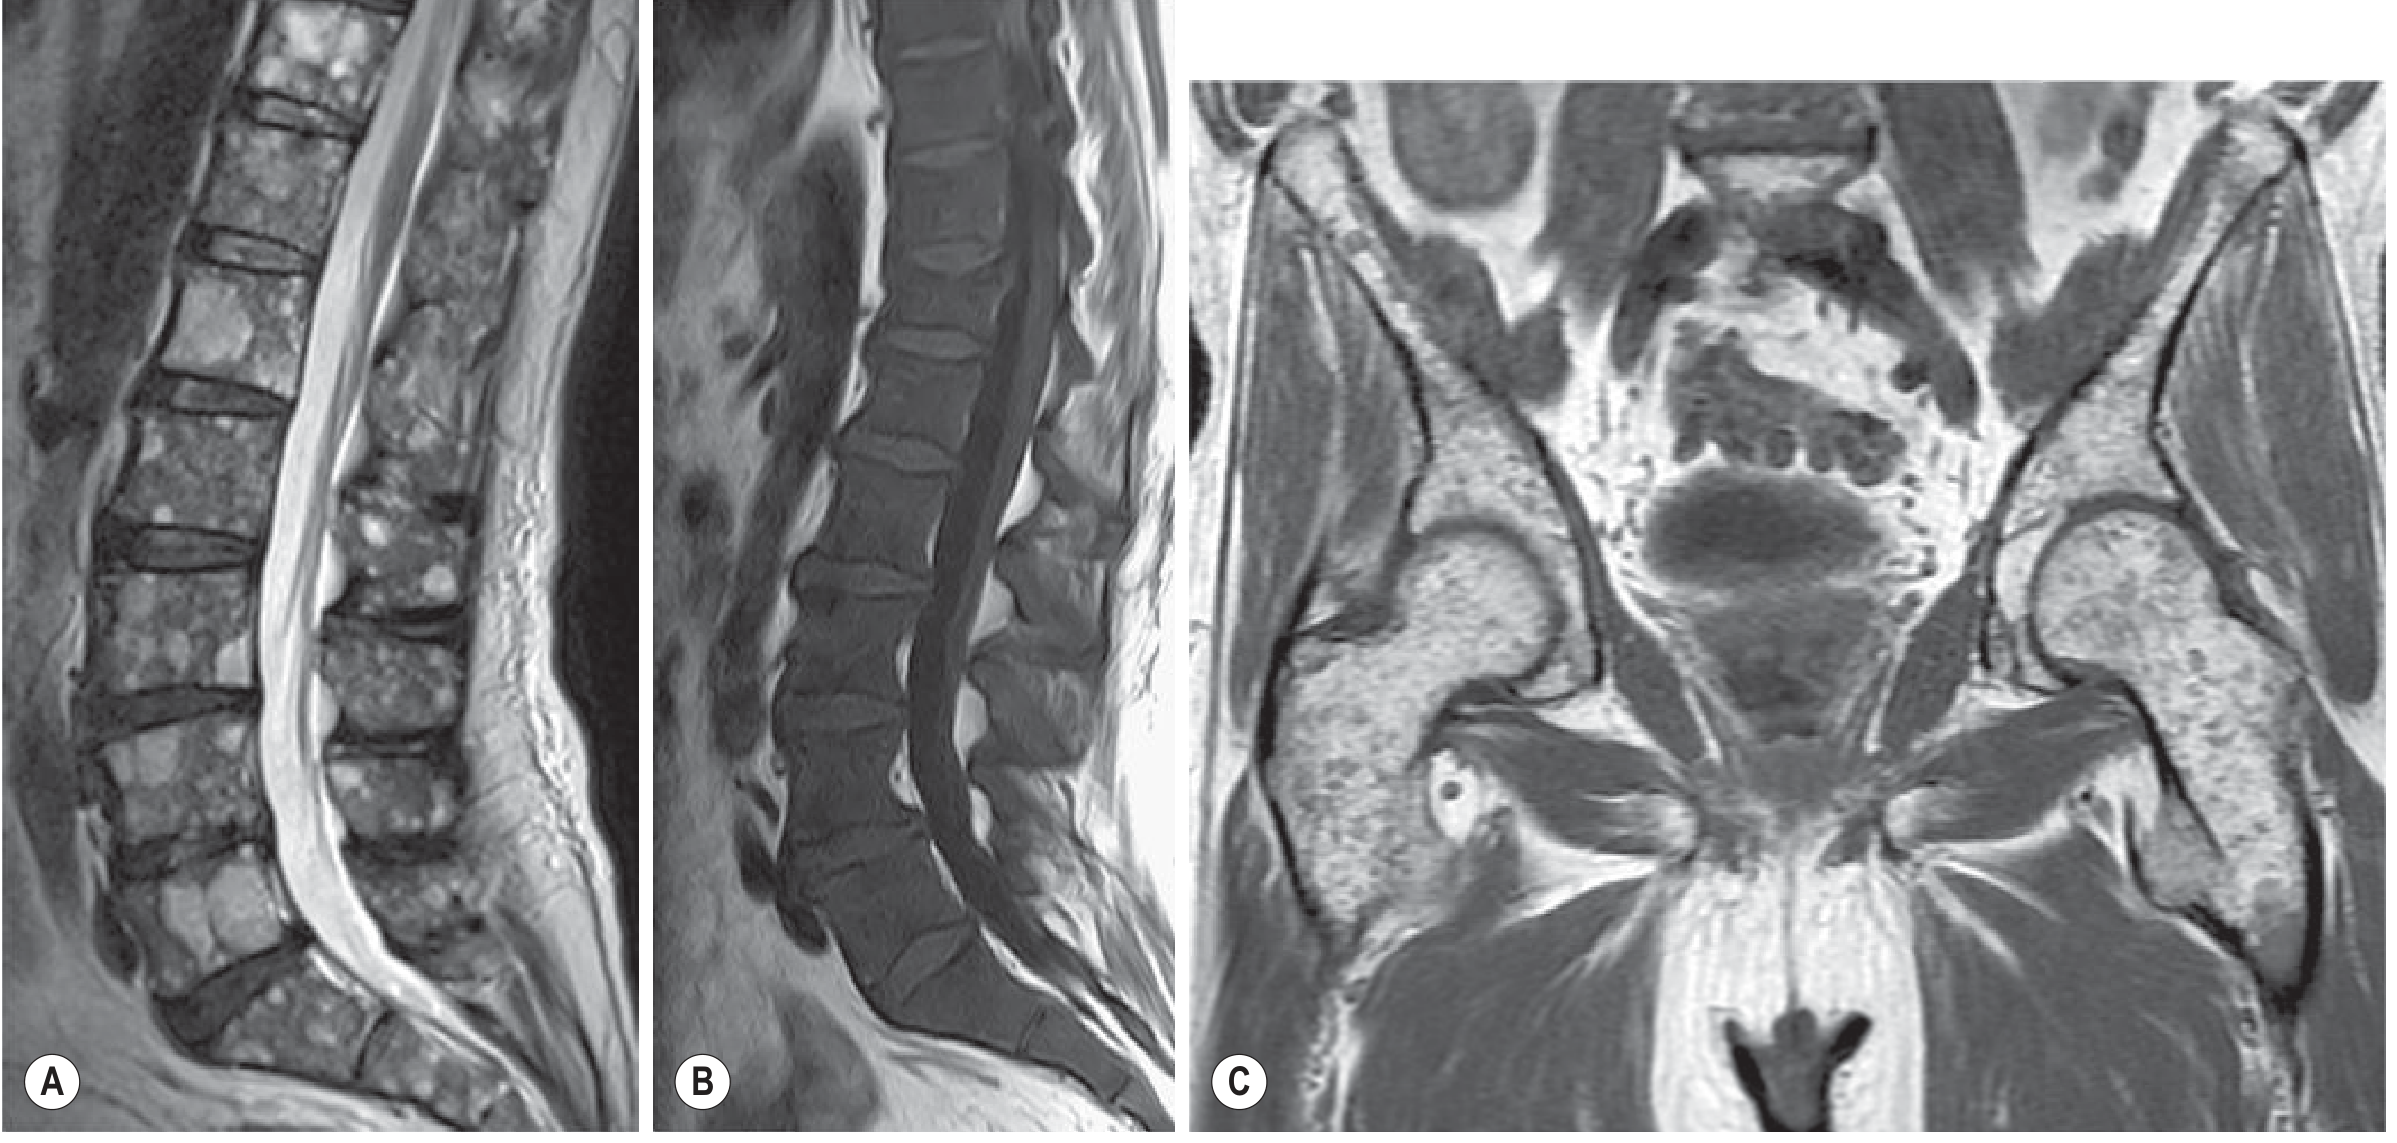
Fig. A: Sagittal T2 FSE showing multifocal high-signal marrow lesions. B: Sagittal T1 showing diffuse marrow signal reduction (vertebral bodies darker than discs). C: Coronal T1 of pelvis showing variegated marrow involvement.
MRI is better than radiography for rib and skull lesions, and is the modality of choice for spinal cord compression assessment.
PET/CT (18F-FDG)
PET/CT is superior to skeletal survey for staging and treatment response monitoring:
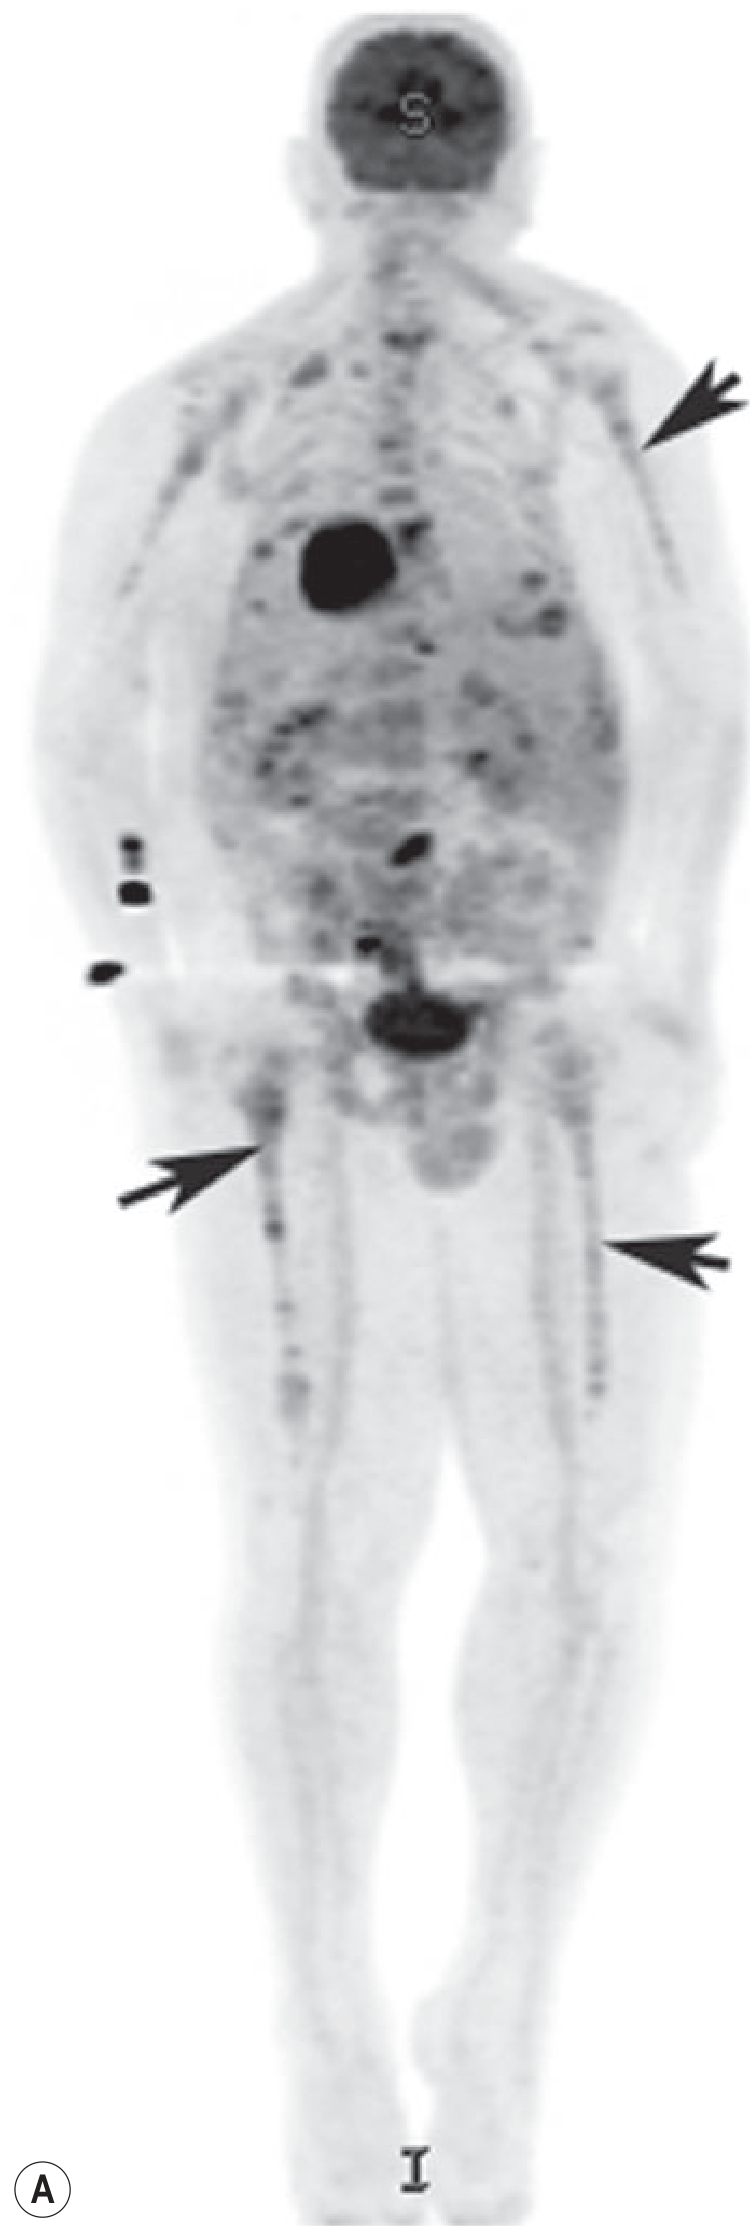
Fig: Coronal PET MIP image showing widespread FDG uptake throughout the axial and appendicular skeleton (arrows), indicating active myeloma.
- Demonstrates metabolically active disease throughout skeleton, including appendicular sites
- Identifies extramedullary disease
- Useful for monitoring treatment response
- Grainger & Allison's, pp. 1702-1704
Pathology / Bone Marrow Findings
- Plasma cells usually >30% of bone marrow cellularity (normal <5%)
- Abnormal morphology: prominent nucleoli, Russell bodies (cytoplasmic Ig inclusions)
- Bone lesions are punched-out defects 1-4 cm on gross pathology, arising from medullary cavity with progressive cortical erosion
- Robbins & Kumar Basic Pathology, p. 422
Laboratory Findings
| Test | Finding |
|---|---|
| Serum protein electrophoresis (SPEP) | Monoclonal spike ("M protein") |
| Serum immunofixation | Identifies Ig class (IgG most common) |
| Urine immunofixation | Bence Jones proteins (free light chains) |
| Serum free light chain ratio | Involved/uninvolved ratio; ≥100 is myeloma-defining |
| CBC | Normocytic normochromic anemia |
| Calcium | Elevated |
| Creatinine | Elevated in renal involvement |
| Beta-2 microglobulin | Key staging marker (ISS) |
| LDH | Elevated in aggressive disease |
Spectrum: From MGUS to Myeloma
| Condition | Plasma cells | M protein | End-organ damage |
|---|---|---|---|
| MGUS | <10% | <3 g/dL | None |
| Smoldering MM | 10-60% | ≥3 g/dL or urine ≥500 mg/24h | None |
| Active MM | ≥10% (or plasmacytoma) | Any | Yes (CRAB or SLiM) |
Summary of Imaging Modality Comparison
| Modality | Sensitivity | Key Use |
|---|---|---|
| Plain X-ray (skeletal survey) | Lowest | Historical first-line; still used |
| Low-dose whole-body CT | High | Current preferred first-line |
| MRI (whole body) | Highest for marrow | Marrow involvement, cord compression |
| PET/CT | High | Staging, treatment response, extramedullary disease |
- Grainger & Allison's Diagnostic Radiology, pp. 1700-1704
- Robbins & Kumar Basic Pathology, pp. 421-423
- Goldman-Cecil Medicine, pp. 1974-1976
This is a shared conversation. Sign in to Orris to start your own chat.