
Hematocrit in detail
I'll start by reading the medical library skill, then search for detailed hematocrit content.
Reading File
Now I'll search the library in parallel for hematocrit content across headings and paragraphs.
Finding Sources
Finding Sources
Searching PubMed
hematocrit clinical significance measurement
Now I'll read the most relevant sections in parallel - the Tietz, Henry's, Guyton & Hall, and Frameworks blocks.
Reading File
Reading File
Reading File
Reading File
Let me now read the Henry's section on micromethod and the hematocrit effect/volume displacement section, plus fetch the two key images.
Reading File
Reading File
Loading Image
Loading Image
I now have comprehensive information from multiple authoritative textbooks. Let me compile the full detailed answer.
Hematocrit - A Detailed Overview
1. Definition
Hematocrit (Hct), also called the packed cell volume (PCV), is the ratio (expressed as a percentage or decimal fraction in SI units - L/L) of the volume of erythrocytes (red blood cells) to the volume of whole blood.
- Example: a hematocrit of 40 means 40% of the blood volume is red blood cells; the remainder is mainly plasma, with white blood cells and platelets making up only ~1%.
- It is one of the most commonly used tests to assess the red cell mass, alongside hemoglobin concentration and RBC count.
"Hematocrit is the percentage of packed blood containing intact RBCs after it has been spun in a centrifuge."
- Frameworks for Internal Medicine
2. Methods of Measurement
A. Macromethod (Wintrobe)
- Blood is placed in a graduated tube (Wintrobe tube) and centrifuged.
- The packed red cell volume is read directly from the graduation.
B. Micromethod (Standard Clinical Practice)
- A capillary tube ~7 cm long with ~1 mm bore is filled by capillary action from a skin puncture or well-mixed venous sample to at least 5 cm.
- The end is sealed with modeling clay and placed radially in a microhematocrit centrifuge head, sealed end outward.
- Centrifuged at 10,000-12,000 g for 5 minutes (if Hct >50%, extend to 10 minutes to ensure complete packing).
- The red cell column length divided by total blood column length (measured with a millimeter rule and magnifying lens) gives the Hct value.
C. Automated/Calculated Method
The hematocrit can also be calculated from automated CBC parameters:
Hct (%) = RBC count × MCV / 10
Some analyzers measure it directly using impedance or optical methods. - Tietz Textbook of Laboratory Medicine, 7th Ed.
3. Reference Ranges
| Group | Reference Range |
|---|---|
| Adult males | 0.41 - 0.51 (41-51%) |
| Adult females | 0.36 - 0.45 (36-45%) |
| Average male | ~42% |
| Average female | ~38% |
These values vary with age, sex, altitude, and level of physical activity. - Henry's Clinical Diagnosis and Management by Laboratory Methods
4. The "Rule of Three"
A quick bedside cross-check:
- RBC × 3 = Hemoglobin (g/dL)
- Hemoglobin × 3 = Hematocrit (%)
The hematocrit is approximately 3 times the hemoglobin concentration. This rule is only reliable when RBCs are normal in size and shape (i.e., normocytic normochromic). - Tietz Textbook of Laboratory Medicine
5. Hematocrit Values in Health and Disease
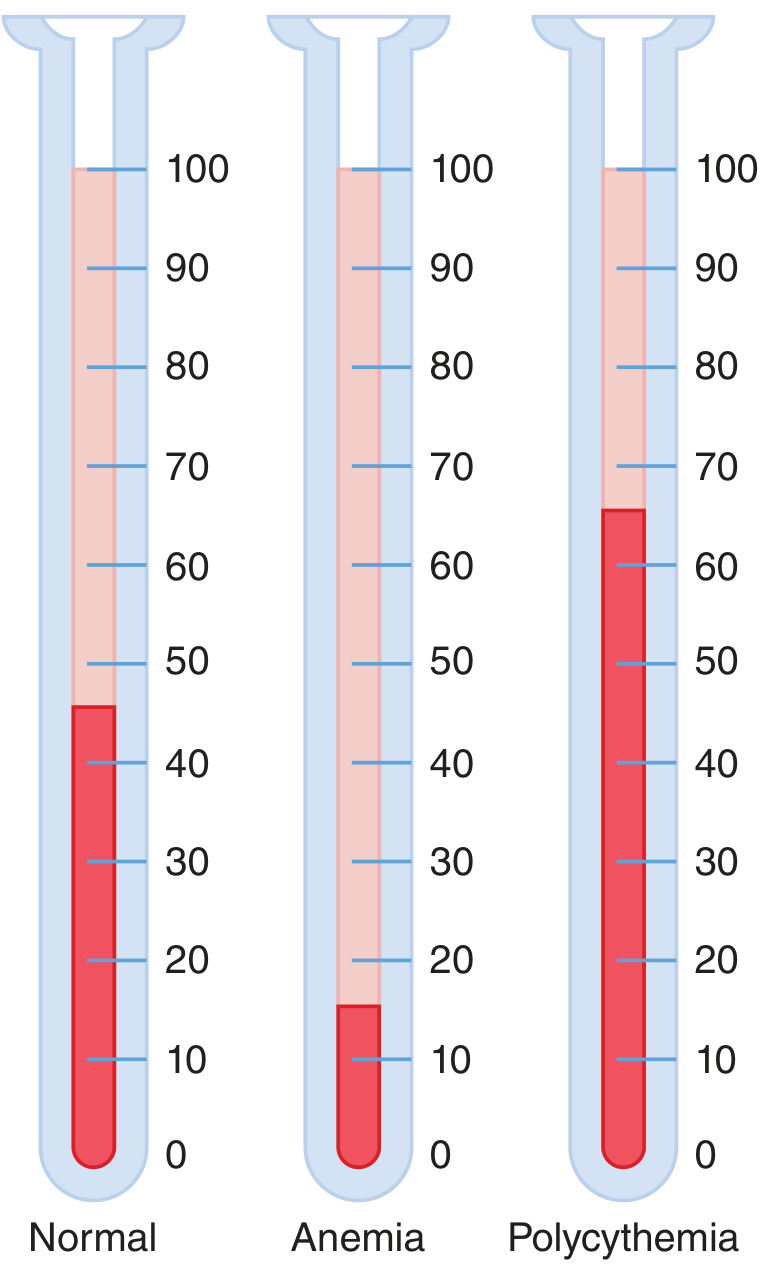
Figure: Hematocrit values by centrifugation - Normal (~40-45%), Anemia (markedly low), Polycythemia (markedly elevated). - Guyton & Hall Textbook of Medical Physiology
Decreased Hematocrit (Low Hct = Anemia)
- Iron deficiency anemia (most common cause globally)
- Vitamin B12 / Folate deficiency (megaloblastic anemia)
- Anemia of chronic disease/inflammation
- Hemolytic anemias (hereditary spherocytosis, autoimmune hemolytic anemia, sickle cell disease)
- Aplastic anemia (bone marrow failure)
- Thalassemia
- Hydremia of pregnancy (dilutional - plasma volume expands more than RBC mass; Hct falls but total RBC mass is not reduced)
- Shock with acute blood loss - Hct may be normal or even high immediately after hemorrhage (hemoconcentration); it is unreliable as an estimate of anemia immediately after blood loss or transfusion
Elevated Hematocrit (High Hct = Polycythemia/Erythrocytosis)
- Polycythemia vera (primary myeloproliferative disorder)
- Secondary polycythemia: high altitude, chronic hypoxia, COPD, sleep apnea, EPO-secreting tumors
- Dehydration / hemoconcentration (e.g., severe burns, vomiting, severe acute pancreatitis - where Hct rise is a marker of disease severity due to capillary leakage)
- Relative polycythemia (reduced plasma volume)
6. Relationship to Blood Viscosity (Physiological Importance)
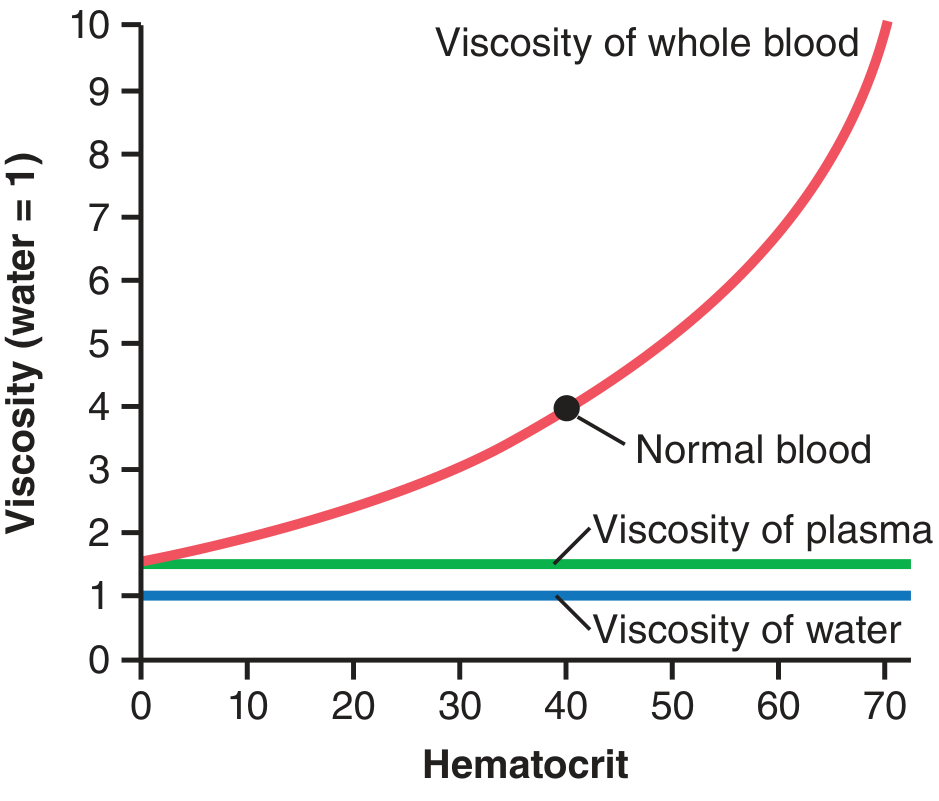
Figure: Blood viscosity rises exponentially with increasing hematocrit. - Guyton & Hall Textbook of Medical Physiology
Hematocrit is the single most important determinant of blood viscosity:
- Normal hematocrit: whole blood viscosity is 3-4 times that of water.
- Polycythemia (Hct 60-70): viscosity can be up to 10 times that of water.
- This exponentially increases vascular resistance per Poiseuille's law (resistance ∝ viscosity), severely impairing blood flow and oxygen delivery to tissues.
- Paradoxically, lowering hematocrit (hemodilution) decreases viscosity and can improve cerebral blood flow - but reduces oxygen-carrying capacity.
- Plasma viscosity itself is only ~1.5x that of water, making its contribution minor compared to RBC mass.
This is why in pulmonary vascular disease, the relationship between pulmonary vascular resistance (PVR) and hematocrit is exponential - small rises in Hct at high baseline PVR cause large further increases in resistance. - Fishman's Pulmonary Diseases and Disorders
7. Hematocrit vs. Hemoglobin vs. RBC Count
| Parameter | What it measures | Units |
|---|---|---|
| Hematocrit | % volume of blood occupied by RBCs | % or L/L |
| Hemoglobin | Concentration of Hb in blood | g/dL |
| RBC count | Number of red cells per unit volume | millions/µL |
In most anemias, all three decrease in parallel. The notable exception: in profound microcytic anemia (thalassemia trait), the RBC count may be unexpectedly normal or increased despite low Hct and Hb - an important diagnostic clue. - Frameworks for Internal Medicine
8. Hematocrit in Automated Analyzers - The Hematocrit Effect (POCT)
This is a critical source of analytical error in point-of-care testing (POCT):
- POCT systems (e.g., glucometers, bedside analyzers) use whole blood on dipstick-style reagent strips.
- High hematocrit → fewer RBCs allow less plasma to pass to the reagent → falsely low results for the analyte measured.
- Low hematocrit (more common in hospitalized patients) → more plasma passes → falsely elevated results.
- Only systems with a plasma-separation step before reagent contact can avoid this error.
- Patients should calibrate their POCT meter results with simultaneous standard laboratory plasma/serum measurements to account for this effect. - Henry's Clinical Diagnosis and Management by Laboratory Methods
9. Sources of Error in Hematocrit Measurement
- Inadequate mixing - Blood tubes need at least 60 inversions before sampling; less causes unacceptable imprecision.
- Trapped plasma - During centrifugation, ~1-3% of the red cell column contains trapped plasma (more at high Hct values), causing a slight overestimation of true Hct.
- Inadequate centrifugation speed or time - Leads to incomplete packing and falsely high values.
- Plasma abnormalities visible after spinning:
- Orange/green plasma → elevated bilirubin
- Pink/red plasma → hemoglobinemia
- Cloudy plasma → lipemia (nephrosis, cryoglobulinemia)
- Buffy coat - The grayish-red layer above the red cell column contains leukocytes and platelets; in leukocytosis or thrombocytosis, this can contribute to apparent Hct elevation.
10. Derived Red Cell Indices from Hematocrit
| Index | Formula using Hct | Clinical Use |
|---|---|---|
| MCV (fL) | 10 × Hct (%) / RBC (millions/µL) | Classifies anemia: micro/normo/macrocytic |
| MCHC (%) | Hb (g/dL) × 100 / Hct (%) | Detects hypochromia (low = iron deficiency), elevated in spherocytosis/sickle cell/Hb C |
11. Special Situations
Pregnancy
- Plasma volume expands by ~40-50% while RBC mass expands by only ~20-30% → physiological dilutional anemia (Hct ~32-34%).
- Total RBC mass is NOT reduced, so this is not true anemia.
Shock and Hemorrhage
- Hct is unreliable immediately after acute blood loss because both red cells and plasma are lost proportionally.
- Hemodilution by fluid shifts or IV fluids takes hours to fully manifest, after which Hct falls to reflect true losses.
- Conversely, with dehydration/hemoconcentration (e.g., severe burns, acute pancreatitis), rising Hct indicates severity of volume depletion.
Anesthesia / Cardiac Surgery
- Hemodilution on cardiopulmonary bypass deliberately lowers Hct by adding crystalloid prime to the circuit.
- Mixed Hct post-bypass = (patient blood volume × patient Hct + total prime volume × 0) / (patient BV + total prime volume).
- Target Hct during CPB is typically 21-28%; lower values are associated with neurodevelopmental consequences in infants.
Summary Table
| Feature | Detail |
|---|---|
| Definition | % blood volume occupied by RBCs |
| Normal (male) | 41-51% |
| Normal (female) | 36-45% |
| Measurement | Microhematocrit: centrifuge at 10,000-12,000 g × 5 min |
| Calculation | RBC × MCV / 10 |
| Rule of Three | Hct ≈ 3 × Hb |
| Low Hct | Anemia, dilution (pregnancy), fluid overload |
| High Hct | Polycythemia, dehydration, altitude |
| Viscosity link | Exponential - key determinant of blood rheology |
| POCT error | Hematocrit effect - alters analyte results on dipstick systems |
Sources:
- Guyton & Hall Textbook of Medical Physiology, Chapters 14 & 33
- Henry's Clinical Diagnosis and Management by Laboratory Methods, Chapters 31 & 10
- Tietz Textbook of Laboratory Medicine, 7th Ed., Chapter 74
- Frameworks for Internal Medicine
- Fishman's Pulmonary Diseases and Disorders
Alcohol withdrawal symptoms treatment
Reading File
This is a broad clinical topic. Running parallel searches across headings, paragraphs, and PubMed simultaneously.
Finding Sources
Finding Sources
Searching PubMed
"alcohol withdrawal" AND treatment
Excellent sources found. Now reading the most comprehensive sections in parallel - Harrison's, Rosen's EM, Washington Manual, Maudsley, and Kaplan & Sadock's.
Reading File
Reading File
Reading File
Reading File
Now reading the Washington Manual for treatment protocols, Goldman-Cecil for management, and Rosen's for the treatment section and CIWA-Ar scale.
Reading File
Reading File
Reading File
Now let me read the Washington Manual's second section (lines 6455+) for detailed pharmacologic protocols, and also get the Rosen's treatment detail for phenobarbital and adjuncts.
Reading File
Reading File
I now have comprehensive, multi-source content. Let me compile the full detailed response.
Alcohol Withdrawal Syndrome - Symptoms and Treatment
1. Pathophysiology
Alcohol is a CNS depressant that acts primarily by potentiating GABA (inhibitory) receptors and inhibiting NMDA glutamate (excitatory) receptors. With chronic heavy use, the brain neuroadapts:
- GABA receptors are downregulated (less inhibition)
- NMDA/glutamate receptors are upregulated (more excitation)
- The dopaminergic reward pathway is disinhibited
When alcohol is suddenly removed, the brain is left in a hyper-excited, unbalanced state - manifest as the alcohol withdrawal syndrome (AWS). Only a reduction, not necessarily complete cessation, of alcohol intake can trigger withdrawal. - Rosen's Emergency Medicine
2. DSM-5 Diagnostic Criteria
Alcohol withdrawal requires:
- Cessation or reduction of heavy, prolonged alcohol use
- At least 2 of the following symptoms within hours to days:
- Autonomic hyperactivity (sweating, tachycardia >100 bpm)
- Hand tremor
- Insomnia
- Nausea or vomiting
- Transient hallucinations or illusions
- Psychomotor agitation
- Anxiety
- Generalized tonic-clonic seizures
- The symptoms cause clinically significant distress or impairment
- Not attributable to another medical condition or substance
Specifier: "With perceptual disturbances"
3. Clinical Stages and Timeline
AWS is a continuum that typically progresses through stages, though it can skip stages or go directly to DTs:
| Stage | Symptoms | Onset After Last Drink |
|---|---|---|
| Minor / Mild | Tremulousness, anxiety, irritability, anorexia, nausea/vomiting, diaphoresis, tachycardia, hypertension, insomnia | 6-12 hours (peaks 24-48 h) |
| Alcoholic Hallucinosis | Visual/auditory/tactile hallucinations; patient retains clear sensorium (distinguishes from DTs) | 8-48 hours |
| Withdrawal Seizures | Generalized tonic-clonic seizures (brief, self-limited; 3-5 may occur); may occur without other withdrawal signs | 12-48 hours (peak ~24 h) |
| Delirium Tremens (DTs) | Severe agitated delirium, disorientation, autonomic storm (hyperthermia, marked tachycardia/hypertension, diaphoresis), hallucinations, seizures | 48-72 hours (up to 5 days) |
- Mild symptoms may persist for 4-6 months as a protracted abstinence syndrome
- ~2% of patients with alcohol use disorder experience withdrawal seizures
- ~1% develop DTs
- DTs carry an estimated mortality of 5-15% if untreated
"AWS is a continuum of syndromes that begins after a decrease in the amount of intake of ethanol. Therefore, only a reduction, not the abrupt cessation, of ethanol intake may result in withdrawal."
- Rosen's Emergency Medicine
4. Risk Factors for Severe Withdrawal
- Previous history of DTs or withdrawal seizures (most important risk factor)
- Older age
- Concurrent medical illness (infection, liver failure, GI bleeding)
- Polydrug use
- Higher quantity and duration of alcohol use
- Prior alcohol withdrawal episodes (kindling phenomenon - each episode lowers the seizure threshold)
- Electrolyte or metabolic imbalances
5. Severity Assessment - The CIWA-Ar Scale
The Clinical Institute Withdrawal Assessment for Alcohol, Revised (CIWA-Ar) is the validated standard tool for guiding symptom-triggered benzodiazepine dosing. Score range: 0-67:
| CIWA-Ar Score | Severity | Implications |
|---|---|---|
| < 8 | Mild | Rarely requires medication; supportive care |
| 8-15 | Moderate | Likely to respond to moderate BZD doses |
| > 15 | Severe | Close monitoring required; high risk for seizures and DTs |
Symptom-triggered dosing (giving medication only when CIWA-Ar rises above threshold) is superior to fixed-dose schedules - it reduces total benzodiazepine used and length of treatment. - Rosen's Emergency Medicine, Goldman-Cecil Medicine
6. Treatment
A. General Supportive Measures (All Patients)
- Thiamine (Vitamin B1): 250-500 mg IM/IV for 3-5 days, then 100-250 mg PO daily
- Give BEFORE glucose - if glucose is given first to a thiamine-deficient patient, it can precipitate Wernicke encephalopathy
- Multivitamins containing folic acid
- Hydration: Most alcohol withdrawal patients are normally or mildly overhydrated - avoid routine IV fluids unless there is significant bleeding, vomiting, diarrhea, or fever/diaphoresis
- Electrolyte correction: Alcoholics are particularly prone to:
- Hypomagnesemia
- Hypokalemia
- Hypoglycemia
- Balanced diet as tolerated
- Reassurance and a quiet, calm environment
- Screen for co-existing conditions: Hepatic failure, GI bleeding, cardiac arrhythmias, infections, traumatic injuries, pancreatitis
B. Pharmacologic Treatment
First-Line: Benzodiazepines (BZDs)
BZDs are the mainstay of treatment - they substitute for alcohol's GABA-potentiating effect, suppress autonomic hyperactivity, and have anticonvulsant activity. No single BZD is proven superior to another.
Dosing strategies:
- Symptom-triggered (preferred): Dose only when CIWA-Ar exceeds threshold; reduces total BZD dose and duration
- Fixed/scheduled taper: Less preferred; risk of under- or over-treatment
- Front-loading: Large initial doses titrated to sedation; useful in severe withdrawal
| Drug | Dose | Notes |
|---|---|---|
| Chlordiazepoxide (Librium) | 25-50 mg PO q4-6h Day 1; taper to zero over 5 days (max 300 mg/day) | Long-acting; smooth withdrawal; avoid in liver disease |
| Diazepam (Valium) | 10 mg IV q5-20 min (severe); 30 mg PO daily tapered over 5 days (outpatient) | Fastest IV onset (1-3 min); long active metabolites; avoid in liver disease |
| Lorazepam (Ativan) | 1-4 mg IV q5-15 min (severe); 1-2 mg TID tapered over 3-6 days (outpatient) | Preferred in liver disease and elderly (no active metabolites, minimal hepatic metabolism); IM route available |
| Oxazepam (Serax) | 15-30 mg PO q6-8h PRN | Preferred in severe hepatic failure - renally excreted; short-acting |
Liver disease rule: Long-acting BZDs (chlordiazepoxide, diazepam) are hepatically cleared - accumulation causes prolonged sedation in cirrhotic patients. Use lorazepam or oxazepam (the "LOT" drugs - Lorazepam, Oxazepam, Temazepam) which undergo direct glucuronidation only.
For severe withdrawal/DTs: high-dose BZDs may be needed (up to 800 mg/day chlordiazepoxide reported for DTs). - Harrison's Principles of Internal Medicine 22e
Second-Line / Alternative: Phenobarbital
Phenobarbital has emerged as a significant alternative or adjunct to BZDs, with growing evidence:
- Long half-life (~4-5 days) providing a self-tapering effect
- Direct GABA-A receptor activation at a different site than BZDs
- Anticonvulsant properties
- Two recent 2024 systematic reviews (Lee CM et al., Acad Emerg Med 2024) and (Punia K et al., SAEM GRACE 2024) found phenobarbital effective and safe for AWS management in the ED, with comparable or lower rates of ICU admission vs. BZDs alone
- A 2024 network meta-analysis (Qu L et al., Int Clin Psychopharmacol) compared multiple pharmacologic treatments for AWS
Typical dosing: 10 mg/kg IV loading dose (or 65-130 mg IM/IV q4-6h for less severe cases).
Adjunctive Agents
| Drug | Role | Notes |
|---|---|---|
| Carbamazepine | Adjunct anticonvulsant; alternative to BZDs for mild-moderate withdrawal | As effective as BZDs in some studies; does not prevent delirium; not sedating; not adequate as monotherapy for severe withdrawal |
| Gabapentin | Adjunct for mild-moderate symptoms | Up to 1200 mg/day PO; may reduce BZD requirements |
| Beta-blockers (atenolol, propranolol) | Reduce autonomic symptoms (tachycardia, hypertension, tremor) | Adjunctive only - do not prevent seizures or DTs; mask clinical signs used to monitor severity |
| Clonidine (alpha-2 agonist) | Reduces autonomic hyperactivity | Adjunctive only; no anticonvulsant effect |
| Baclofen (GABA-B agonist) | High-dose (50-150 mg/day) may reduce agitation in ventilated patients | Not standard therapy; requires further trials |
| Phenytoin | NOT effective for alcohol withdrawal seizures | Does not prevent alcohol withdrawal seizures alone or with BZDs; do not use |
| Propofol / Ketamine | Refractory DTs in ICU | Used when BZDs fail in severe, mechanically ventilated patients |
"Phenytoin does not prevent alcohol withdrawal-related seizures when used on its own or in combination with benzodiazepines. There is no need to continue anticonvulsants long term when used to prevent seizures in alcohol withdrawal."
- Maudsley Prescribing Guidelines in Psychiatry, 15th Ed.
On Dexmedetomidine: Does NOT target GABAergic/glutamatergic systems; may mask autonomic signs without preventing seizures; has not improved patient-centered outcomes or length of stay in clinical trials - not recommended as primary treatment. - Washington Manual of Medical Therapeutics
C. Treatment by Severity Level
Mild Withdrawal (CIWA-Ar < 8)
- Supportive care: hydration, nutrition, reassurance
- Thiamine + multivitamins
- Monitor vitals serially
- Oral BZD only if symptoms worsen
- Outpatient management possible with 1-2 day medication supply, daily follow-up
Moderate Withdrawal (CIWA-Ar 8-15)
- Oral BZD taper (chlordiazepoxide 25-50 mg q6-8h or lorazepam 1-2 mg TID)
- Thiamine, electrolyte replacement
- Consider inpatient if co-morbidities, no social support, or prior severe withdrawal
Severe Withdrawal / DTs (CIWA-Ar > 15)
- ICU admission for DTs
- IV benzodiazepines (diazepam 10 mg IV q5-10 min OR lorazepam 2-4 mg IV q15 min) titrated to symptom control
- Phenobarbital for BZD-refractory cases
- Propofol infusion or intubation for extreme cases
- Continuous cardiac and hemodynamic monitoring
- Aggressive electrolyte/fluid management
Alcohol Withdrawal Seizures
- Treat actively with IV diazepam or lorazepam
- Antiepileptic drugs (AEDs) are not indicated for routine alcohol withdrawal seizures (seizures are self-limited)
- Head CT to rule out structural cause (hemorrhage, trauma)
- Thiamine must be given before glucose
- Long-acting BZD prophylaxis in patients with prior seizure history
- Observe for at least 6 hours after last seizure before discharge consideration; admit if ≥ 2 seizures in 6 hours
7. Disposition Criteria
| Setting | Criteria |
|---|---|
| Outpatient | Mild withdrawal, good social support, no prior DTs/seizures, clinically well, reliable follow-up |
| Inpatient (general ward) | Moderate-severe withdrawal, significant comorbidities, prior seizures, psychiatric instability |
| ICU | DTs, hemodynamic instability, refractory seizures / status epilepticus, hyperthermia, rhabdomyolysis, severe metabolic disturbances, BZD-refractory agitation |
8. Prevention of Relapse (Post-Withdrawal)
Once stabilized, pharmacotherapy for alcohol use disorder:
- Naltrexone (50 mg/day PO or monthly IM injection "Vivitrol") - blocks opioid-mediated reward from alcohol; reduces craving and heavy drinking days
- Acamprosate - reduces glutamate-driven craving and protracted withdrawal symptoms
- Disulfiram - aversion therapy (causes severe flushing/nausea with alcohol via acetaldehyde accumulation)
Psychotherapy adjuncts: Motivational Enhancement Therapy, 12-step facilitation (AA), Cognitive-Behavioral Coping Skills Therapy. - Goldman-Cecil Medicine
Summary
| Feature | Key Point |
|---|---|
| Mechanism | GABAergic downregulation + glutamatergic upregulation with chronic alcohol |
| Timeline | Starts 6-12h; DTs peak 48-72h |
| Severity tool | CIWA-Ar (0-67 scale) |
| First-line drug | Benzodiazepines (symptom-triggered preferred) |
| Liver disease | Use lorazepam or oxazepam |
| Severe/DTs | IV BZDs, ICU, possibly phenobarbital |
| Don't use | Phenytoin (ineffective for alcohol withdrawal seizures), dexmedetomidine as monotherapy |
| Always give | Thiamine BEFORE glucose |
| Mortality (DTs) | Up to 5-15% untreated |
Sources:
- Harrison's Principles of Internal Medicine, 22e - Chapter on Alcohol and Alcoholism
- Rosen's Emergency Medicine, 9th Ed. - Chapter 137
- The Washington Manual of Medical Therapeutics
- Goldman-Cecil Medicine, International Ed. - Chapter 364
- Maudsley Prescribing Guidelines in Psychiatry, 15th Ed.
- Kaplan & Sadock's Synopsis of Psychiatry
- Recent evidence: Phenobarbital for AWS - SR/MA, Acad Emerg Med 2024 | Network meta-analysis of AWS pharmacotherapy, 2024 | GRACE-4 ED Guidelines 2024
Explain cbc in detail and how to analyze cbc in detail
Reading File
This is a broad, multi-component topic. Running parallel searches across headings and paragraphs simultaneously.
Finding Sources
Finding Sources
Finding Sources
Good. Now let me search specifically in the Tietz and Henry's textbooks which are the authoritative lab medicine sources, and also search for CBC components (RBC indices, WBC differential, platelets).
Finding Sources
Finding Sources
Finding Sources
Now reading the key sections in parallel - Tietz CBC, Henry's hematology profile, Washington Manual CBC labs, and the Tietz RBC parameters section.
Reading File
Reading File
Reading File
Excellent. Now reading the Henry's abnormalities in hematology profile section (the actual content, not the TOC), and the Tietz WBC/platelet sections.
Reading File
Reading File
Excellent content. Now reading the WBC section from Tietz and the platelet/differential sections from Henry's, plus fetching the RBC distribution curve image.
Reading File
Reading File
Loading Image
Now reading the WBC differential and platelet content from Tietz block 32, and the WBC abnormalities from Henry's.
Reading File
Reading File
I now have comprehensive, multi-source content. Let me compile the full detailed answer.
Complete Blood Count (CBC) - Full Explanation and Analysis Guide
1. What Is a CBC?
A Complete Blood Count (CBC) - also called a Full Blood Count (FBC), Full Blood Examination (FBE), or Blood Panel - is the most commonly ordered laboratory test in clinical medicine. It provides a quantitative assessment of the three major cellular components of blood:
- Red blood cells (RBCs / erythrocytes) - oxygen transport
- White blood cells (WBCs / leukocytes) - immune defense
- Platelets (thrombocytes) - hemostasis
A standard CBC typically reports 15-20 parameters, covering counts, concentrations, sizes, and distribution widths. Modern automated hematology analyzers measure these using impedance (cell size/count), light scatter (cell shape/granularity), and fluorescence (nucleic acid content for reticulocytes, WBC subpopulations). - Tietz Textbook of Laboratory Medicine, 7th Ed.
2. CBC Components - The Complete Parameter List
A. RED BLOOD CELL PARAMETERS
1. RBC Count
- What it measures: Number of red blood cells per microliter (µL) of blood
- Normal ranges:
- Adult males: 4.5-5.9 × 10⁶/µL (4.5-5.9 × 10¹²/L)
- Adult females: 4.0-5.2 × 10⁶/µL
- Newborns: Higher (relative hypoxia in utero stimulates more RBC production)
- ↑ Erythrocytosis: Polycythemia vera, high altitude, chronic hypoxia (COPD, sleep apnea), smoking, EPO-producing tumors
- ↓ Low count: Anemia (various causes)
2. Hemoglobin (Hgb / Hb)
- What it measures: Concentration of hemoglobin in whole blood (g/dL)
- Normal ranges:
- Adult males: 13.5-17.5 g/dL
- Adult females: 12.0-15.5 g/dL
- Anemia defined as: Hb < 13.0 g/dL (male), < 12.0 g/dL (female)
- The single most important indicator of oxygen-carrying capacity
- Caution: Unreliable immediately after acute hemorrhage (plasma and RBCs lost together; dilution effect takes hours)
3. Hematocrit (Hct / PCV)
- What it measures: Percentage of blood volume occupied by RBCs
- Normal: Males 41-51%, Females 36-45%
- Rule of Three: Hct ≈ 3 × Hb ≈ 9 × RBC count (valid only for normocytic cells)
- Calculated: Hct = RBC × MCV / 10
4. Mean Corpuscular Volume (MCV) ← Most Important Red Cell Index
- What it measures: Average volume (size) of a single RBC, in femtoliters (fL)
- Normal: 80-100 fL
- Classification of anemia by MCV:
| MCV | Classification | Common Causes |
|---|---|---|
| < 80 fL | Microcytic | Iron deficiency, thalassemia, anemia of chronic disease (sometimes), sideroblastic anemia |
| 80-100 fL | Normocytic | Anemia of chronic disease, acute blood loss, hemolytic anemia, renal disease, aplastic anemia, mixed deficiency |
| > 100 fL | Macrocytic | B12/folate deficiency (megaloblastic), hypothyroidism, liver disease, alcohol, medications (methotrexate, hydroxyurea, AZT), reticulocytosis |
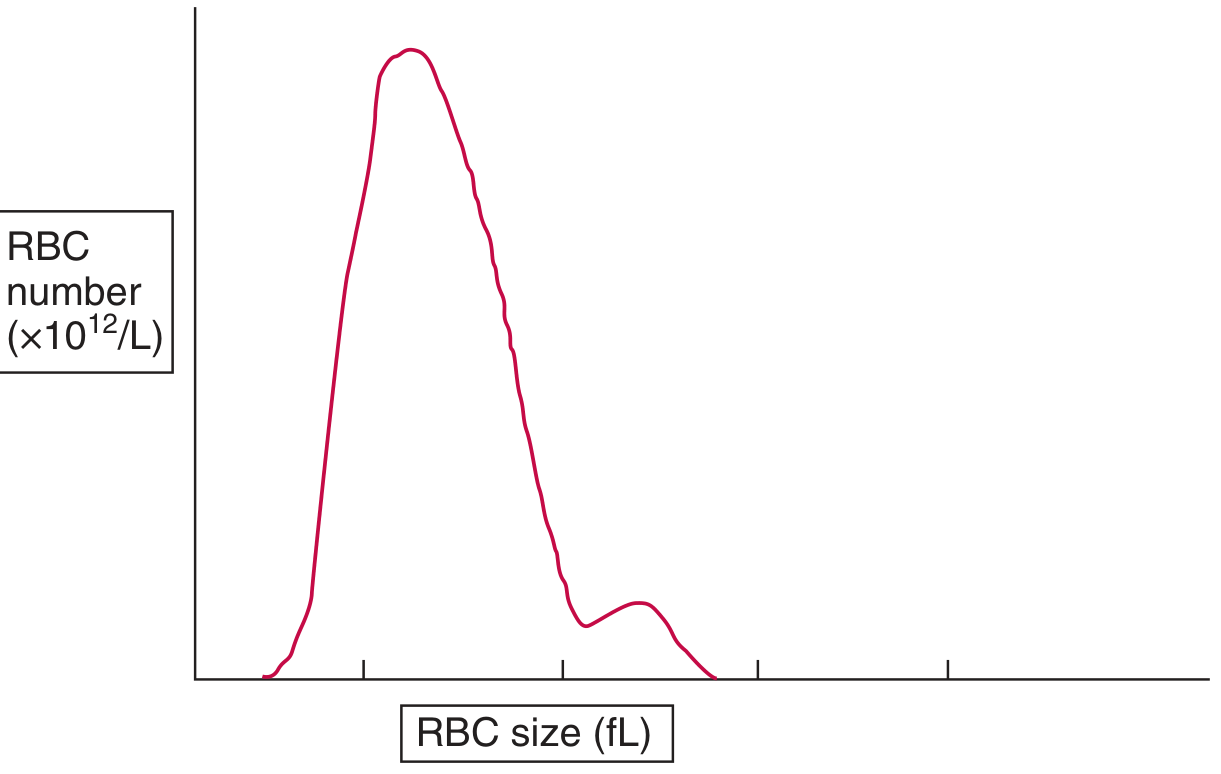
Figure: Red cell size distribution histogram. The MCV is the mean of this distribution. The RDW is the coefficient of variation. A dimorphic curve (two peaks) suggests two RBC populations (e.g., partially treated iron deficiency, post-transfusion). - Tietz Textbook of Laboratory Medicine
Important MCV pitfalls:
- Concurrent megaloblastic anemia + thalassemia can normalize MCV - check RDW and smear
- MCV rises spuriously if EDTA sample is analyzed >2-3 days old (RBCs swell)
- In infancy and early childhood, normal MCV is lower than adults - do not over-investigate
5. Mean Corpuscular Hemoglobin (MCH)
- What it measures: Average Hb content per single RBC (picograms, pg)
- Calculated: MCH = Hb (g/dL) × 10 / RBC (millions/µL)
- Normal: 27-33 pg
- Parallels MCV (larger cells generally contain more Hb)
- ↓ Low MCH: Hypochromia (iron deficiency, thalassemia)
- ↑ High MCH: Hyperchromia (spherocytes, sickle cell, Hb C disease)
- More stable than MCV with sample storage - preferred for thalassemia screening in some countries (UK)
6. Mean Corpuscular Hemoglobin Concentration (MCHC)
- What it measures: Average Hb concentration per unit volume of RBCs (g/dL or %)
- Calculated: MCHC = Hb (g/dL) × 100 / Hct (%)
- Normal: 32-36 g/dL
- ↓ Low MCHC: Hypochromia - most sensitive indicator for iron deficiency
- ↑ Elevated MCHC: Strongly suggests hereditary spherocytosis or autoimmune hemolytic anemia (spherocytes have less surface area relative to volume → more concentrated Hb); also elevated in homozygous sickle cell or Hb C disease
- MCHC is unaffected by MCV, making it useful to independently assess chromicity
7. Red Cell Distribution Width (RDW)
- What it measures: Coefficient of variation (CV%) of RBC volume - reflects size variability (anisocytosis)
- Normal: 11.5-14.5% (CV method)
- ↑ Elevated RDW (high anisocytosis): Indicates two or more cell populations of different sizes
- Iron deficiency anemia (characteristic - high RDW with low MCV)
- Mixed deficiency (B12/folate + iron)
- Post-transfusion
- Early nutritional deficiency
- Reticulocytosis (reticulocytes are larger)
- Normal RDW with low MCV: Suggests thalassemia trait (all cells uniformly small; RDW low or normal) - helps distinguish from iron deficiency
RDW + MCV diagnostic grid (Bessman classification):
| MCV | RDW Normal | RDW High |
|---|---|---|
| Low (microcytic) | Thalassemia trait | Iron deficiency anemia |
| Normal (normocytic) | Chronic disease, renal, acute blood loss | Mixed deficiency, early iron deficiency, sickle cell |
| High (macrocytic) | Aplastic anemia, liver disease | Megaloblastic anemia (B12/folate) |
B. RETICULOCYTE PARAMETERS
8. Reticulocyte Count
- What it measures: Percentage of immature RBCs (reticulocytes) in blood
- Normal: 0.4-2.9% (or 25,000-75,000/µL absolute count)
- Reticulocytes are newly formed RBCs that retain cytosolic mRNA for 1 day after losing their nucleus; stain blue with methylene blue (polychromasia on Wright stain)
- Reflects bone marrow erythropoietic activity
Reticulocyte Index (RI) / Reticulocyte Production Index (RPI):
RI = (Reticulocyte % / maturation correction factor) × (Patient Hct / Normal Hct [45])
Maturation correction: 1.0 for Hct >30%; 1.5 for Hct 24-30%; 2.0 for 20-24%; 2.5 for <20%
| RI/RPI | Interpretation |
|---|---|
| < 2 | Hypoproliferative anemia - bone marrow not responding (iron deficiency, B12/folate deficiency, aplastic anemia, renal disease) |
| > 2-3 | Hyperproliferative - marrow responding (hemolytic anemia, hemorrhage, treatment response) |
C. WHITE BLOOD CELL PARAMETERS
9. Total WBC Count (Leukocyte Count)
- Normal: 4,000-11,000/µL (4-11 × 10⁹/L)
- Automated analyzers count all nucleated WBCs; abnormal cells (blasts, atypical lymphocytes) are flagged
- Leukocytosis (>11,000/µL): Infection, inflammation, stress, steroids, leukemia
- Leukopenia (<4,000/µL): Viral infections, sepsis (paradoxically), bone marrow suppression, autoimmune destruction
- Critical: Always interpret using absolute counts, not just percentages
10. WBC Differential Count (Five-Part Differential)
Modern analyzers generate a five-part differential using combined impedance + light scatter + fluorescence:
| Cell Type | Normal % | Normal Absolute Count | Function |
|---|---|---|---|
| Neutrophils | 50-70% | 1,800-7,500/µL | Phagocytosis of bacteria, fungi |
| Lymphocytes | 20-40% | 1,000-4,800/µL | T-cell (cellular immunity), B-cell (antibody production) |
| Monocytes | 2-8% | 200-800/µL | Phagocytosis, antigen presentation, tissue macrophage precursor |
| Eosinophils | 1-4% | 100-400/µL | Parasitic defense, allergic reactions |
| Basophils | 0-1% | 0-100/µL | Allergic reactions, IgE-mediated hypersensitivity |
Differential Interpretation Guide
Neutrophilia (neutrophils > 7,500/µL):
- Bacterial infection (most common)
- Inflammation, surgery, trauma, burns
- Corticosteroids (demarginate neutrophils)
- Myeloproliferative disorders
- Physiologic (exercise, stress, pregnancy)
- "Left shift": Increased band forms (immature neutrophils) - indicates acute bacterial infection or bone marrow stress; if metamyelocytes/myelocytes appear = "severe left shift"
Neutropenia (neutrophils < 1,500/µL):
- Viral infections (common), sepsis
- Drug-induced (chemotherapy, clozapine, methimazole, carbimazole)
- Autoimmune (SLE, Felty syndrome)
- Bone marrow failure
- Absolute Neutrophil Count (ANC) < 500/µL = severe neutropenia → risk of life-threatening infections
Lymphocytosis (lymphocytes > 4,000/µL adults):
- Viral infections: Infectious mononucleosis (EBV), CMV, hepatitis, HIV, pertussis
- Chronic infections: TB, brucellosis
- Chronic lymphocytic leukemia (CLL) - sustained high lymphocytes in older adults
- Atypical lymphocytes on smear = EBV/CMV/viral hepatitis
Lymphocytopenia (< 1,000/µL):
- HIV/AIDS (specifically CD4 T-cell depletion)
- Corticosteroids
- Autoimmune diseases (SLE)
- Malignancy, chemotherapy, radiation
Eosinophilia (> 500/µL):
- NAACP mnemonic: Neoplastic, Addison's disease, Allergic/Asthma/Atopy, Collagen vascular disease, Parasitic infection
- Also: Drugs, Churg-Strauss syndrome (eosinophilic granulomatosis with polyangiitis)
- Hypereosinophilic syndrome: Eosinophils > 1,500/µL with organ damage
Basophilia (> 100/µL):
- Chronic myelogenous leukemia (CML) - classic finding (basophilia + leukocytosis + splenomegaly)
- Myeloproliferative disorders, inflammatory conditions, allergic reactions
Monocytosis (> 800/µL):
- Bacterial infections: TB, subacute bacterial endocarditis, brucellosis, Listeria
- Chronic inflammatory diseases
- Monocytic leukemias (AML-M5, CMML)
- Recovery phase after chemotherapy
Note: WBC >100,000/µL ("leukostasis") is a medical emergency causing microvascular sludging, CNS symptoms, pulmonary failure.
D. PLATELET PARAMETERS
11. Platelet Count (PLT)
- Normal: 150,000-400,000/µL (150-400 × 10⁹/L)
- Thrombocytopenia (< 150,000/µL):
| PLT Count | Clinical Risk |
|---|---|
| 100,000-150,000 | Mild; usually no spontaneous bleeding |
| 50,000-100,000 | Bleeding with significant trauma or surgery |
| 20,000-50,000 | Risk of minor spontaneous bleeding |
| < 20,000 | Risk of spontaneous intracranial hemorrhage |
| < 10,000 | Critical - prophylactic transfusion threshold |
Causes: ITP, TTP/HUS, DIC, heparin-induced (HIT), bone marrow failure, hypersplenism, viral infections (dengue, HIV), drugs
- Thrombocytosis (> 400,000/µL):
- Reactive (most common): Iron deficiency, infection, inflammation, post-splenectomy
- Primary (essential thrombocythemia): Myeloproliferative disorder; thrombosis risk when PLT > 1,000,000/µL
12. Mean Platelet Volume (MPV)
- What it measures: Average platelet size (fL)
- Normal: 7.5-12.5 fL
- Larger platelets are younger and more metabolically active
- ↑ High MPV with low PLT count: Increased peripheral platelet destruction (ITP - immune-mediated; platelets consumed, marrow releases larger, younger platelets)
- ↓ Low MPV with low PLT count: Decreased platelet production (bone marrow failure, chemotherapy)
- Technical caution: MPV increases in EDTA-anticoagulated samples over time; standardize to 2-hour measurement
13. Immature Platelet Fraction (IPF)
- Quantifies reticulated (youngest) platelets with high RNA content
- ↑ High IPF: Peripheral destruction (ITP) - marrow compensating
- Useful for: monitoring thrombopoiesis recovery post-transplant/chemotherapy, differentiating destructive vs. hypoproliferative thrombocytopenia
3. How to Systematically Analyze a CBC
Step-by-Step Approach
STEP 1 - Screen for Critical Values First
| Parameter | Critical Low | Critical High |
|---|---|---|
| Hgb | < 7 g/dL | > 20 g/dL |
| WBC | < 2,000/µL | > 30,000/µL (or > 100,000 = emergency) |
| Platelets | < 20,000/µL | > 1,000,000/µL |
| ANC | < 500/µL | - |
STEP 2 - Analyze the Red Cell Line
Is there anemia? (Hgb below normal for age/sex)
- If YES → classify by MCV (microcytic/normocytic/macrocytic)
- Check RDW (elevated = mixed population or nutritional deficiency; normal = uniform cell population like thalassemia)
- Check reticulocyte count/RI (< 2 = hypoproliferative; > 2 = hyperproliferative/hemolytic)
- Check MCHC (low = hypochromia → iron deficiency; high → spherocytes)
- Request peripheral blood smear for morphology
Is there polycythemia? (Hgb/Hct elevated)
- Primary (polycythemia vera) vs. secondary (hypoxia, EPO-producing tumor)
STEP 3 - Analyze the White Cell Line
- Is the total WBC count normal, elevated, or low?
- Look at the differential - which cell type is abnormal?
- Use absolute counts, not percentages
- Check for a "left shift" (band neutrophils >10% or presence of metamyelocytes/myelocytes = acute bacterial infection or bone marrow stress)
- Look for blasts (circulating immature cells = leukemia until proven otherwise)
- Correlate with clinical context (fever, infection, drug history, lymphadenopathy)
Leukemoid reaction vs. leukemia:
- Leukemoid: WBC 50,000-100,000 with left shift but no blasts; LAP (leukocyte alkaline phosphatase) stain is HIGH; reactive condition
- CML: WBC very high, basophilia, all stages of maturation; LAP is LOW; BCR-ABL positive
STEP 4 - Analyze Platelets
- Is PLT count normal, low, or high?
- If low: check MPV and IPF (peripheral destruction vs. reduced production)
- Check for platelet clumping on smear (can cause falsely low automated count = pseudothrombocytopenia - use citrate tube or smear to verify)
- Rule out HIT if on heparin
- If very high: reactive vs. myeloproliferative
STEP 5 - Integrate ALL Three Cell Lines
| Pattern | Likely Diagnosis |
|---|---|
| Low RBC + Low WBC + Low PLT (pancytopenia) | Aplastic anemia, megaloblastic anemia (B12/folate), bone marrow infiltration (leukemia, myeloma, metastases), hypersplenism, MDS |
| High RBC + High WBC + High PLT (panmyelosis) | Polycythemia vera |
| Low WBC + Low PLT, normal RBC | Viral infection, early bone marrow failure |
| High WBC + Low PLT | Leukemia (acute or chronic) |
| Leukoerythroblastic picture (nucleated RBCs + blasts + teardrops) | Bone marrow infiltration/myelophthisis |
STEP 6 - Peripheral Blood Smear Review (Always for Abnormal CBC)
RBC morphology flags:
| Morphology | Associated Conditions |
|---|---|
| Schistocytes (fragmented cells) | TTP, HUS, DIC, prosthetic heart valve, MAHA |
| Spherocytes | Hereditary spherocytosis, AIHA |
| Target cells (codocytes) | Thalassemia, liver disease, Hb C, iron deficiency |
| Sickle cells | Sickle cell disease |
| Teardrop cells (dacrocytes) | Myelofibrosis, bone marrow infiltration |
| Bite cells / Heinz bodies | G6PD deficiency (oxidative hemolysis) |
| Hypersegmented neutrophils | Megaloblastic anemia (B12/folate deficiency) - ≥5 lobes |
| Rouleaux formation | Multiple myeloma, elevated fibrinogen/globulins |
| Basophilic stippling | Lead poisoning, thalassemia, sideroblastic anemia |
| Acanthocytes (spur cells) | Severe liver disease, abetalipoproteinemia |
| Elliptocytes | Hereditary elliptocytosis (or minor finding in iron deficiency) |
4. Four Basic Anemia Patterns to Recognize
"There are basically four types of anemia: iron deficiency, anemia of chronic disease, hemolytic anemia, and macrocytic/nutritionally deficient anemia. These can be readily distinguished from one another both by the hematologic profile and simple laboratory testing."
- Henry's Clinical Diagnosis and Management by Laboratory Methods
| Feature | Iron Deficiency | Anemia of Chronic Disease | Hemolytic Anemia | Megaloblastic (B12/Folate) |
|---|---|---|---|---|
| MCV | ↓ (microcytic) | Normal or ↓ | Normal | ↑ (macrocytic) |
| RDW | ↑ (high) | Normal | Variable | ↑ |
| Reticulocyte count | ↓ (low) | ↓ | ↑ (high) | ↓ |
| MCHC | ↓ | Normal | Variable | Normal |
| Ferritin | ↓↓ | Normal or ↑ | Normal | Normal |
| Serum iron | ↓ | ↓ | Normal | Normal |
| TIBC | ↑ | ↓ or Normal | Normal | Normal |
| LDH | Normal | Normal | ↑↑ | ↑ |
| Indirect bilirubin | Normal | Normal | ↑ | Mildly ↑ |
| Smear | Hypochromic, microcytic, pencil cells | Normochromic or mild hypochromia | Spherocytes/schistocytes/sickle cells | Macro-ovalocytes, hypersegmented neutrophils |
| Special tests | Ferritin, iron studies | CRP, ESR | Coombs, LDH, haptoglobin | B12, folate levels |
5. Reference Ranges Summary Table
| Parameter | Male | Female | Units |
|---|---|---|---|
| RBC | 4.5-5.9 | 4.0-5.2 | × 10⁶/µL |
| Hemoglobin | 13.5-17.5 | 12.0-15.5 | g/dL |
| Hematocrit | 41-51 | 36-45 | % |
| MCV | 80-100 | 80-100 | fL |
| MCH | 27-33 | 27-33 | pg |
| MCHC | 32-36 | 32-36 | g/dL |
| RDW | 11.5-14.5 | 11.5-14.5 | % |
| WBC | 4.0-11.0 | 4.0-11.0 | × 10³/µL |
| Neutrophils | 1.8-7.5 | 1.8-7.5 | × 10³/µL |
| Lymphocytes | 1.0-4.8 | 1.0-4.8 | × 10³/µL |
| Monocytes | 0.2-0.8 | 0.2-0.8 | × 10³/µL |
| Eosinophils | 0.1-0.4 | 0.1-0.4 | × 10³/µL |
| Basophils | 0-0.1 | 0-0.1 | × 10³/µL |
| Platelets | 150-400 | 150-400 | × 10³/µL |
| MPV | 7.5-12.5 | 7.5-12.5 | fL |
| Reticulocytes | 0.4-2.9 | 0.4-2.9 | % |
6. Pre-Analytical Considerations (Sources of Error)
- Anticoagulant: EDTA (K2 or K3) is standard - causes platelet swelling (MPV rises over time), but is best for morphology preservation
- Sample timing: Analyze within 4-6 hours for most reliable results; MCV rises with prolonged EDTA storage (>24 h)
- Mixing: At least 8-10 gentle inversions before analysis; inadequate mixing causes microclots and erroneous counts
- Pseudothrombocytopenia: EDTA-induced platelet clumping (platelet satellitism) causes falsely low automated PLT count; verify with peripheral smear or citrated sample
- Lipemia: High triglycerides scatter light, may falsely elevate Hgb (optical method)
- Hemolysis: Free Hgb in plasma falsely elevates Hgb; also lyses RBCs, affecting count
Sources:
- Tietz Textbook of Laboratory Medicine, 7th Ed. - Chapters 74, 77
- Henry's Clinical Diagnosis and Management by Laboratory Methods - Chapters 2, 31
- The Washington Manual of Medical Therapeutics - Hematology Chapter
- Goldman-Cecil Medicine, International Ed.
- Frameworks for Internal Medicine
This is a shared conversation. Sign in to Orris to start your own chat.