Mention all Ecg changes , there abnormalities alone with image including normal ecg and how to read each of them in detail
Reading File
Finding Sources
Finding Sources
Finding Sources
Finding Sources
Reading File
Reading File
Reading File
Reading File
Loading Image
Reading File
Reading File
Loading Image
Loading Image
Loading Image
Reading File
Reading File
Reading File
Loading Image
Reading File
Reading File
Loading Image
Loading Image
Now I have everything needed. Let me compile the comprehensive ECG guide.
Complete ECG Guide: Normal ECG, How to Read It, and All Major Abnormalities
Part 1 - The Cardiac Conduction System (Foundation)
Before reading an ECG, you must understand what generates each wave.
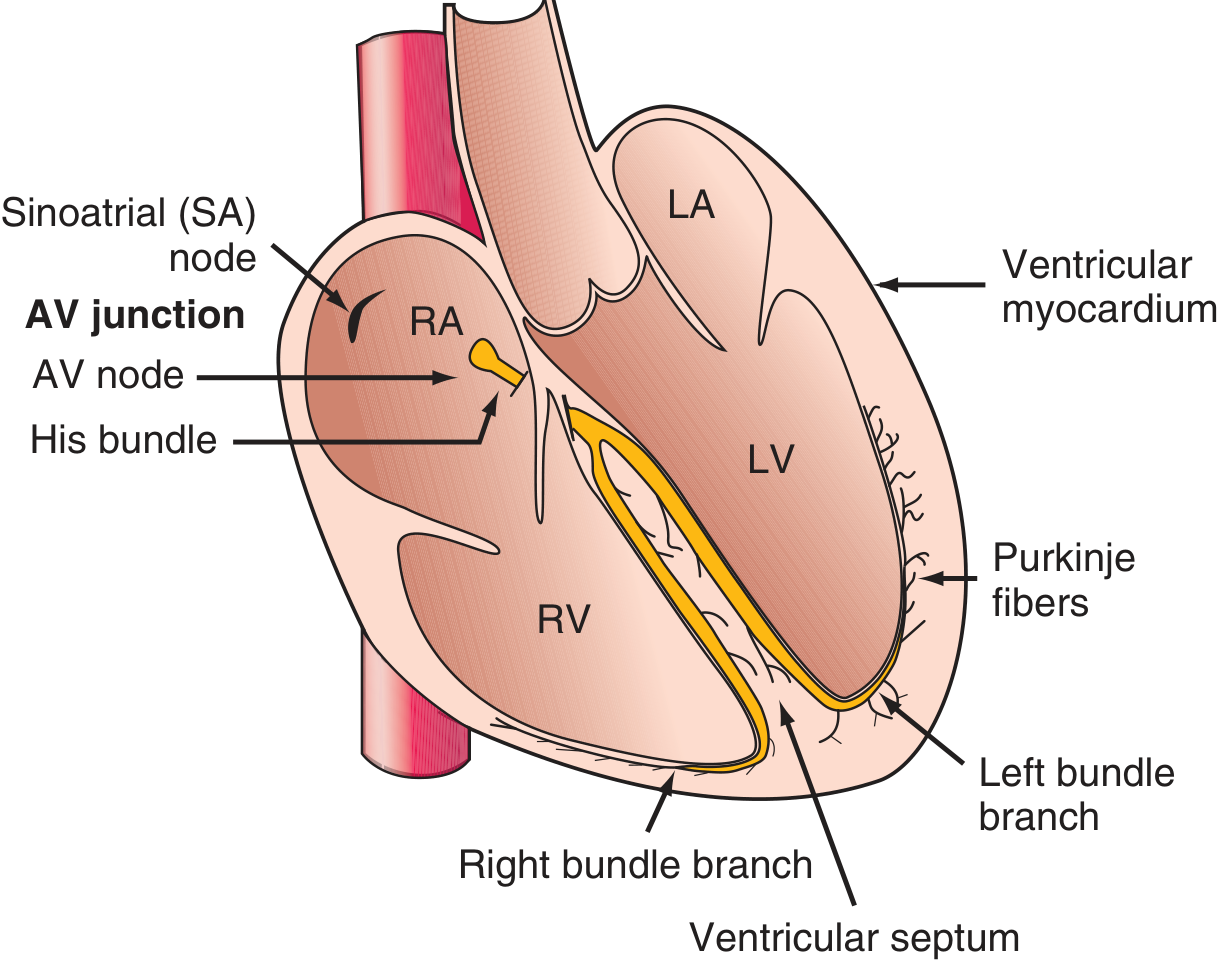
The heart's electrical highway: SA node → AV node → Bundle of His → Right and Left bundle branches → Purkinje fibers → ventricular muscle.
The SA node fires spontaneously and is the dominant pacemaker. Electrical current spreads through both atria (generating the P wave), then slows at the AV node (the PR interval delay), then races down the His-Purkinje system to depolarize the ventricles (QRS), followed by ventricular recovery (T wave). - Harrison's Principles of Internal Medicine, 22E
Part 2 - The ECG Paper and Basic Calibration
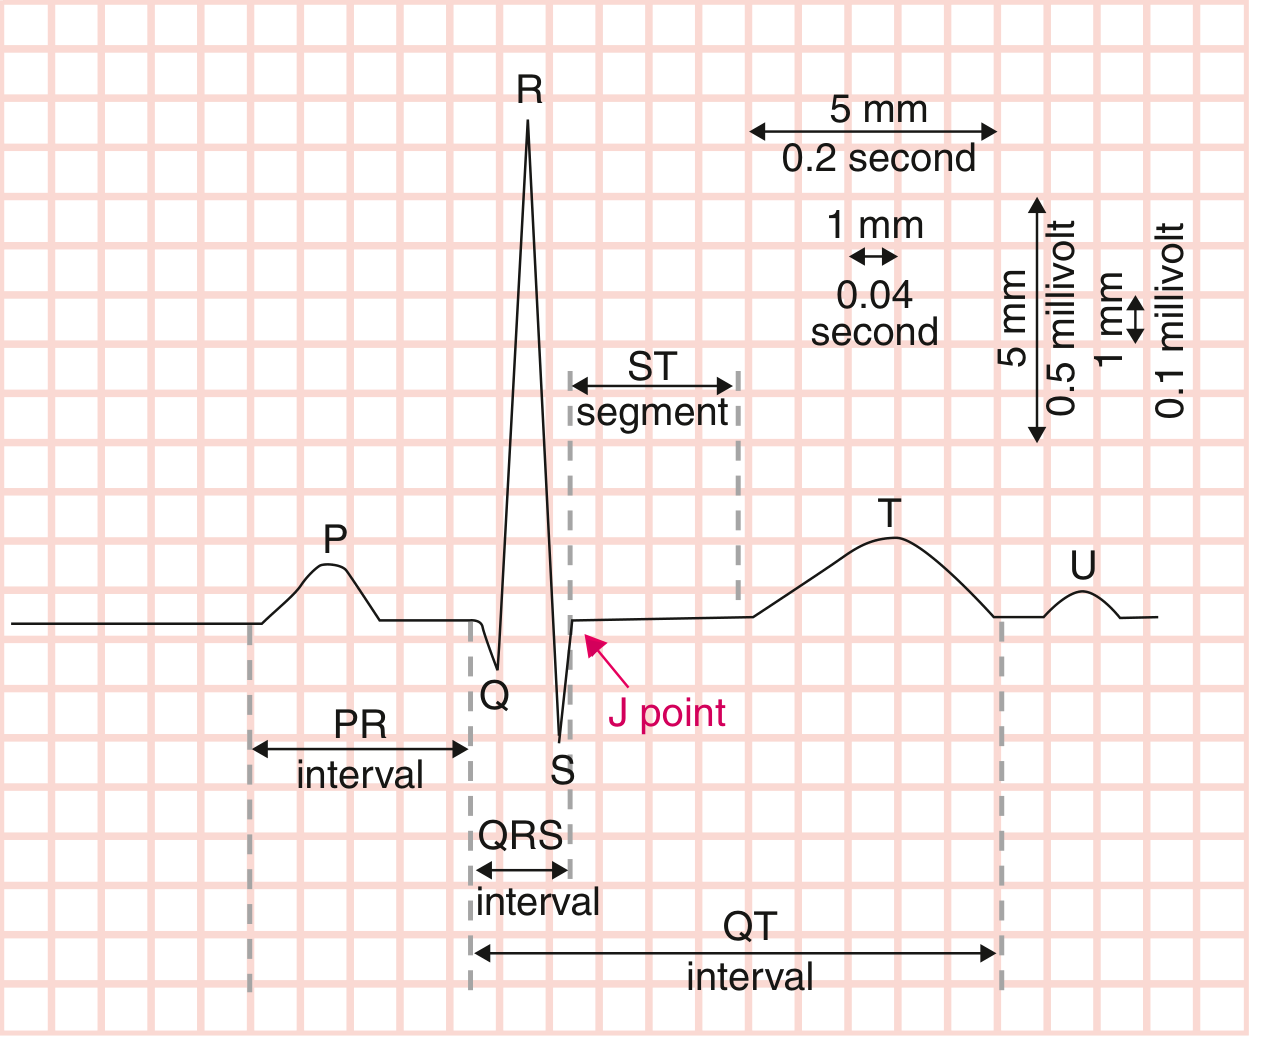
| Dimension | Small box (1 mm) | Large box (5 mm) |
|---|---|---|
| Time (horizontal) | 0.04 sec (40 ms) | 0.20 sec (200 ms) |
| Voltage (vertical) | 0.1 mV | 0.5 mV |
Standard: 25 mm/s paper speed, 1 mV = 10 mm calibration. - Goldman-Cecil Medicine
Heart rate calculation:
- Regular rhythm: divide 300 by the number of large boxes between two R waves
- Alternatively: count R waves in 10-second strip and multiply by 6
Part 3 - Normal ECG Waveforms and What They Mean
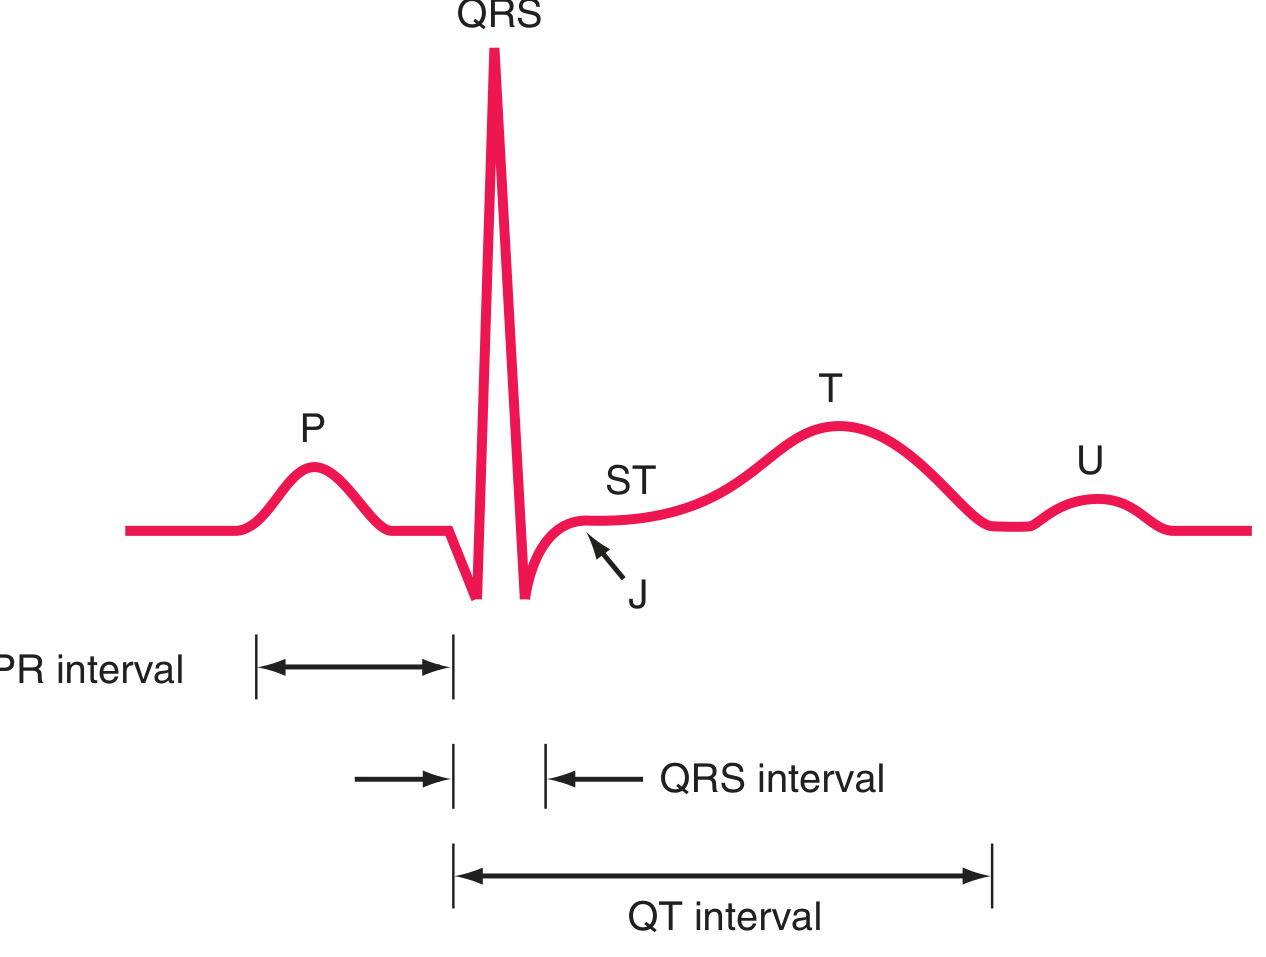
The Waves
| Wave | What it represents | Normal appearance |
|---|---|---|
| P wave | Atrial depolarization | Small, rounded, upright in II and aVF; negative in aVR; duration <120 ms; amplitude <2.5 mm |
| PR interval | AV conduction time (atria + AV node + His bundle) | 120-200 ms (3-5 small boxes) |
| QRS complex | Ventricular depolarization | Duration ≤110 ms; narrow and sharp |
| Q wave | Initial septal depolarization (left-to-right) | Small and narrow (septal q); pathological if >40 ms wide or >25% of R wave height |
| J point | Junction of QRS end and ST segment beginning | At baseline |
| ST segment | Ventricular plateau (phase 2 of action potential) | Isoelectric (flat at baseline) |
| T wave | Ventricular repolarization | Upright in I, II, V3-V6; inverted normally in aVR |
| U wave | Possibly slow repolarization of His-Purkinje system | Small, same direction as T wave; prominent in hypokalemia |
| QT interval | Total ventricular depolarization + repolarization | <450 ms (men), <460 ms (women); rate-corrected QTc |
- Guyton and Hall Textbook of Medical Physiology; Harrison's Principles of Internal Medicine, 22E
Part 4 - The 12 ECG Leads
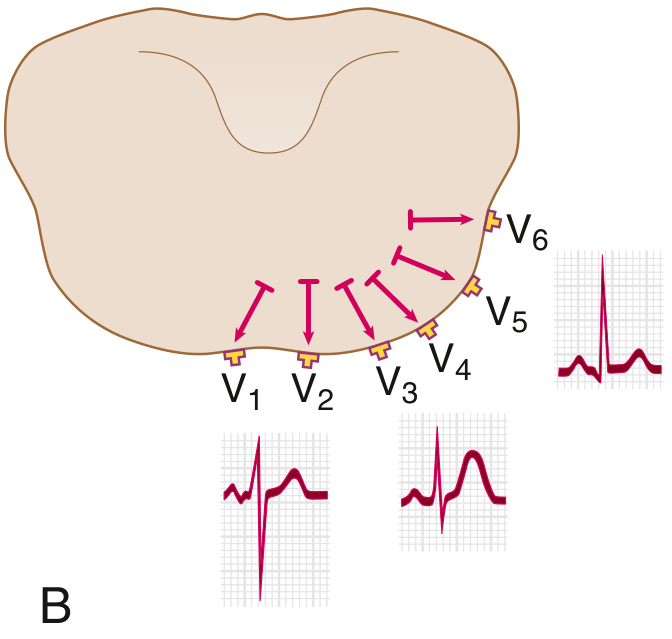
6 Limb leads (frontal plane): I, II, III, aVR, aVL, aVF
6 Precordial leads (horizontal plane): V1-V6
Normal QRS in precordial leads: small r wave in V1, progressively taller R wave towards V5/V6, with R/S transition around V3-V4. This is called normal R wave progression.
Part 5 - How to Read an ECG Systematically (Step-by-Step)
Use this stepwise approach every time:
- Rate - calculate heart rate (normal: 60-100 bpm)
- Rhythm - regular vs. irregular; is there a P before every QRS?
- P wave - present? Upright in II? Each P followed by QRS?
- PR interval - 120-200 ms?
- QRS duration - ≤110 ms? Wide or narrow?
- QRS axis - normal (-30 to +90°)?
- R wave progression - V1 to V6 transition normal?
- ST segments - elevation or depression?
- T waves - concordant with QRS? Inverted?
- QT interval - prolonged?
- U waves - present?
Part 6 - Example of a Normal 12-Lead ECG
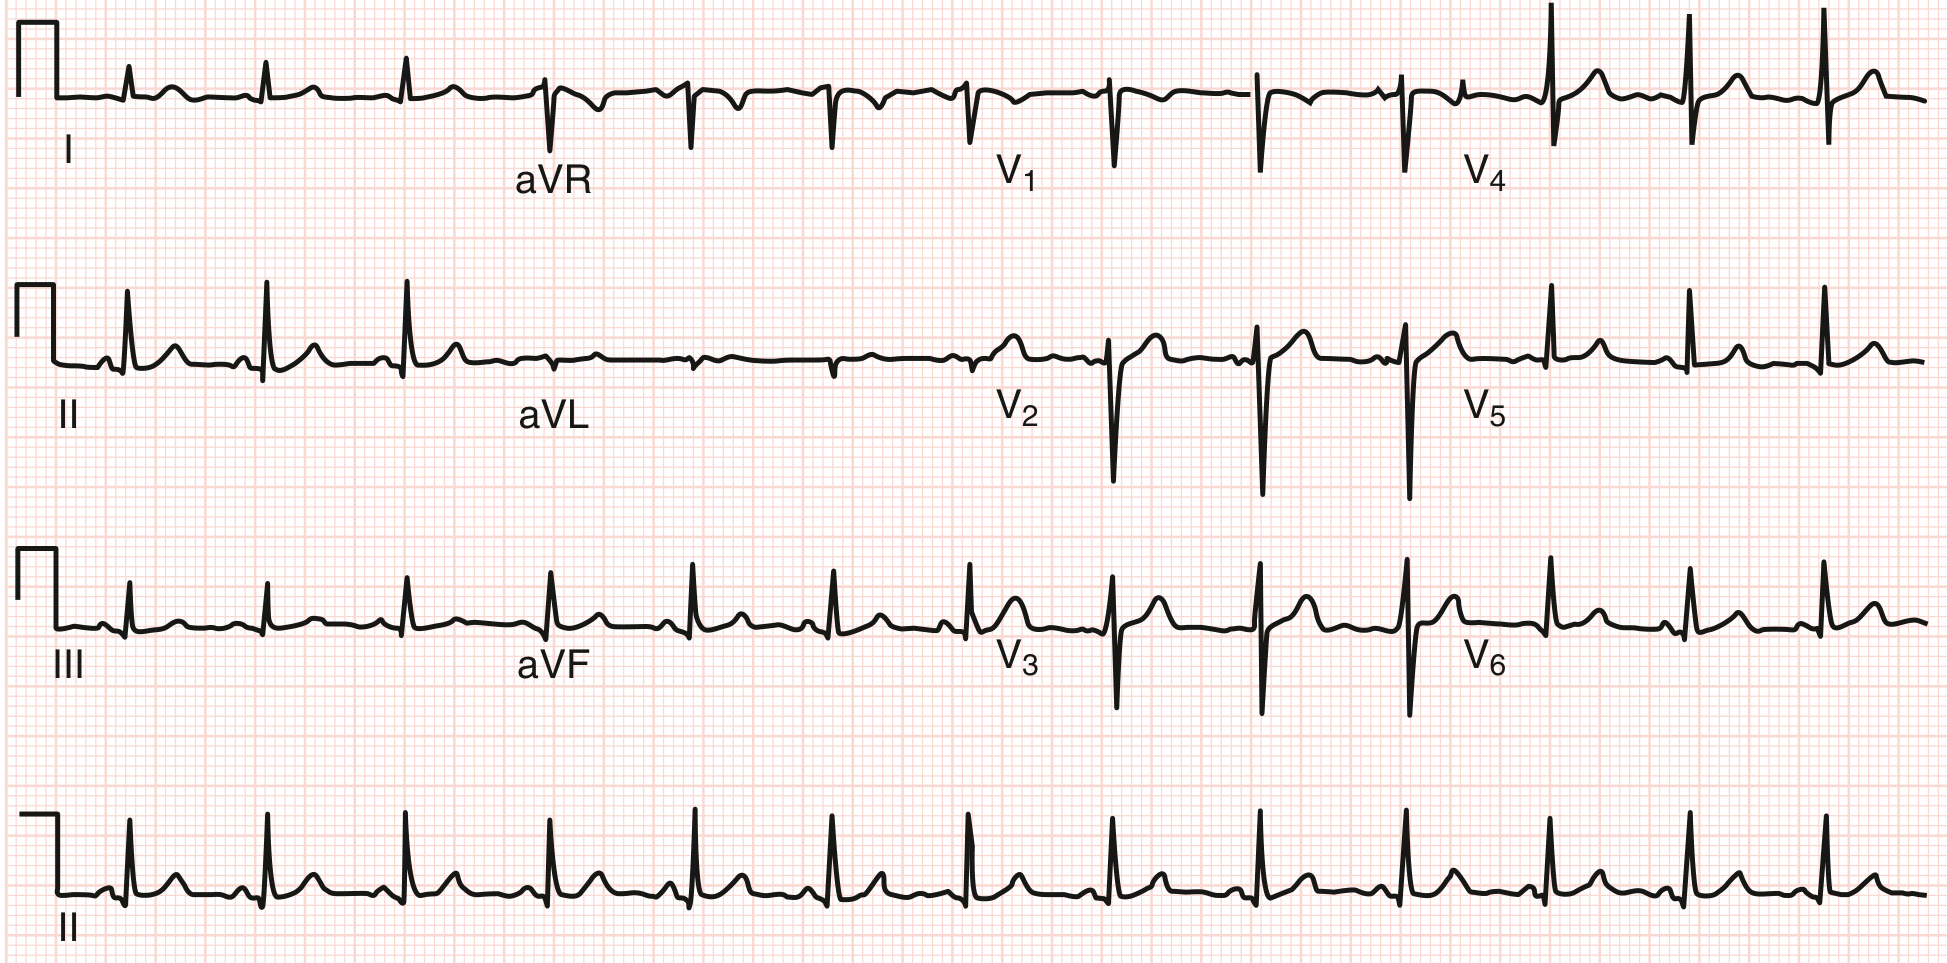
How to read this normal ECG:
- Rate ~78 bpm, slightly irregular (sinus arrhythmia - normal variant)
- Axis approximately +60 degrees (QRS positive in I and II)
- PR ~140 ms, QRS ~90 ms, QTc normal
- Upright P waves in II; negative in aVR
- Transition at V3-V4; septal q waves in V5-V6 (normal)
- Isoelectric ST segments; concordant T waves
- Goldman-Cecil Medicine
Part 7 - ECG Abnormalities (Comprehensive)
7A - P Wave Abnormalities
Right Atrial Enlargement (P pulmonale)
- Mechanism: Increased right atrial mass causes larger, taller P waves
- ECG changes: P wave amplitude >2.5 mm (tall, peaked) in leads II, III, aVF; P wave axis >75°
- Seen in: COPD, pulmonary hypertension, tricuspid stenosis
Left Atrial Enlargement (P mitrale)
- Mechanism: Delayed left atrial depolarization
- ECG changes: P wave duration >120 ms; bifid (notched) P wave in lead II ("M-shaped"); in V1, terminal negative component of P >1 mm wide and >1 mm deep
- Seen in: Mitral stenosis/regurgitation, hypertension
Absent P waves
- Causes: Atrial fibrillation (replaced by irregular fibrillatory baseline), sinoatrial block, junctional rhythm (P may be retrograde - negative in II, positive in aVR)
7B - PR Interval Abnormalities
First-Degree AV Block
- ECG: PR interval >200 ms (>1 large box), constant, every P conducts
- Meaning: Slow AV node conduction; benign in isolation
- Causes: Increased vagal tone, AV nodal disease, digoxin, inferior MI
Second-Degree AV Block - Mobitz Type I (Wenckebach)
- ECG: Progressive PR lengthening with each beat until a QRS is dropped, then resets
- Pattern: "Longer, longer, longer, drop"
- Location: Usually AV node; often reversible
- Causes: Inferior MI, increased vagal tone
Second-Degree AV Block - Mobitz Type II
- ECG: Constant PR interval (normal or prolonged), then sudden non-conducted P wave (QRS drop without warning PR lengthening)
- Location: Below AV node (His bundle or bundle branches); more serious
- Risk: Can progress to complete heart block
- Causes: Anterior MI, fibrosis
Third-Degree (Complete) Heart Block
- ECG: Complete dissociation - P waves and QRS complexes have no relationship to each other; P-P interval regular, R-R interval regular but different rate
- Escape rhythm: If junctional (narrow QRS, rate 40-60 bpm) or ventricular (wide QRS, rate 20-40 bpm)
- Emergency when due to inferior MI or acquired
Short PR Interval (<120 ms)
- Causes: WPW syndrome (with delta wave), AV nodal bypass tract, accelerated junctional rhythm, Lown-Ganong-Levine syndrome
7C - QRS Abnormalities
Right Bundle Branch Block (RBBB)
ECG criteria:
- QRS duration ≥120 ms
- RSR' ("rabbit ears") pattern in V1 (rSR' or rsR' morphology)
- Wide, slurred S wave in leads I, V5, V6
- Secondary T-wave inversions in V1-V2 (discordant to last QRS deflection)
Memory aid: "WiLLiaM MoRRoW" - LBBB: Wide in I, RBBB: Wide in V1 (last deflection to the right)
Causes: Right heart strain, pulmonary embolism, right ventricular hypertrophy, congenital heart disease, normal variant in young adults
Left Bundle Branch Block (LBBB)
ECG criteria:
- QRS duration ≥120 ms
- Broad, notched R wave (no q) in leads I, aVL, V5, V6
- rS or QS pattern in V1-V2 (wide, deep, notched S wave)
- Discordant ST-T changes across all precordial leads (ST and T wave opposite to QRS direction)
- NEVER a normal finding - always investigate
Important: LBBB makes interpretation of ischemia very difficult. Modified Sgarbossa criteria help diagnose STEMI in the presence of LBBB.
Causes: Ischemic heart disease, hypertensive heart disease, aortic valve disease, cardiomyopathy
Left Anterior Fascicular Block (LAFB)
- ECG: QRS <120 ms; marked left axis deviation (more negative than -45°); qR pattern in aVL; rS in II, III, aVF
- Most common cause of left axis deviation in adults
Left Posterior Fascicular Block (LPFB)
- ECG: QRS <120 ms; right axis deviation >+110°; rS in I, aVL; qR in III, aVF
- Rare as isolated finding; must exclude RVH and pulmonary disease first
Wolff-Parkinson-White (WPW) Pattern
- ECG: Short PR (<120 ms), delta wave (slurred upstroke of QRS), wide QRS, secondary ST-T changes
- Mechanism: Accessory pathway (Bundle of Kent) bypasses AV node, pre-excites ventricle
- Risk: Can conduct rapidly in AF causing ventricular fibrillation
7D - Axis Deviation
| Axis | Degrees | ECG clue |
|---|---|---|
| Normal | -30° to +90° | Positive QRS in I and II |
| Left axis deviation | -30° to -90° | Positive in I, negative in aVF; LAFB, LVH, inferior MI |
| Right axis deviation | +90° to +180° | Negative in I, positive in aVF; RVH, PE, LPFB, lateral MI |
| Extreme axis ("northwest") | -90° to ±180° | Negative in both I and aVF; ventricular tachycardia |
7E - Ventricular Hypertrophy
Left Ventricular Hypertrophy (LVH)
- ECG voltage criteria (Sokolow-Lyon): S in V1 + R in V5 or V6 ≥35 mm
- Cornell criteria: R in aVL + S in V3 >28 mm (men) or >20 mm (women)
- Repolarization abnormality: ST depression and T-wave inversion ("strain pattern") in V5, V6, I, aVL
- Causes: Hypertension, aortic stenosis, hypertrophic cardiomyopathy
Right Ventricular Hypertrophy (RVH)
- ECG: Right axis deviation; R>S in V1 (tall R wave in V1); deep S waves in V5, V6; ST-T changes V1-V3
- Causes: Pulmonary hypertension, COPD, mitral stenosis, congenital heart disease
7F - Ischemia and Infarction
This is the most clinically important ECG domain.
Subendocardial Ischemia (NSTEMI/UA pattern)
- ECG: ST-segment depression (horizontal or downsloping ≥1 mm in two contiguous leads); T-wave inversions
- Mechanism: Ischemia confined to subendocardium; ST vector shifts toward cavity
Transmural Ischemia (STEMI pattern)
- ECG: ST-segment elevation (≥1 mm in limb leads, ≥2 mm in precordial leads in two contiguous leads)
- Mechanism: Complete epicardial vessel occlusion; ST vector shifts toward injured epicardium
- Early sign: Hyperacute (tall, peaked, broad) T waves - often first sign before ST elevation
Evolution of Q-wave MI
| Stage | Timing | ECG findings |
|---|---|---|
| Hyperacute | Minutes | Tall, broad, symmetrical T waves |
| Acute | Hours | ST elevation, loss of R wave |
| Evolving | Hours-days | ST elevation peaks; Q waves develop; T wave inversions appear |
| Old/established | Weeks-months | ST returns to baseline; Q waves persist; T waves may normalize or remain inverted |
Pathological Q waves = >40 ms (1 small box) wide OR >25% amplitude of R wave. They represent electrically silent dead myocardium.
Localizing the Territory of Infarction
| Leads with changes | Territory | Artery |
|---|---|---|
| II, III, aVF | Inferior | RCA (right coronary artery) |
| V1-V4 | Anterior | LAD (left anterior descending) |
| I, aVL, V5, V6 | Lateral | LCx (left circumflex) |
| V1-V6 (tall R in V1, V2) | Posterior | RCA or LCx |
| V1-V2 + inferior leads | Right ventricle | RCA proximal |
Reciprocal ST depression in the opposite leads confirms the pattern (e.g., ST elevation in inferior leads + ST depression in anterior leads).
7G - Conduction Timing Abnormalities
Prolonged QT Interval (QTc)
- Definition: QTc >450 ms (men), >460 ms (women)
- Risk: Torsades de pointes (polymorphic VT) leading to ventricular fibrillation
- Causes:
- Congenital: Long QT syndrome types 1-3 (KCNQ1, HERG, SCN5A mutations)
- Drugs: Antiarrhythmics (amiodarone, sotalol, quinidine), antipsychotics (haloperidol, ziprasidone), antibiotics (azithromycin, moxifloxacin), antiemetics (ondansetron), methadone
- Electrolytes: Hypokalemia, hypomagnesemia, hypocalcemia
- Others: Hypothyroidism, hypothermia, intracranial hemorrhage
Shortened QT Interval
- Definition: QTc <340 ms
- Causes: Hypercalcemia, digoxin, short QT syndrome
- Risk: Atrial/ventricular fibrillation
7H - Electrolyte and Metabolic Changes
Hyperkalemia (sequence of changes as K+ rises)
| K+ level | ECG change |
|---|---|
| 5.5-6.5 mEq/L | Narrow, peaked ("tented") T waves; shortened QT |
| 6.5-7.5 mEq/L | PR prolongation; P wave flattening/loss; QRS widening |
| >7.5 mEq/L | Sine wave pattern (QRS merges with T) |
| >8.0 mEq/L | Ventricular fibrillation / asystole |
Hypokalemia
- ECG: Flattening/inversion of T waves; prominent U waves (U wave amplitude > T wave amplitude); apparent QT prolongation (actually QU prolongation); ST depression
Hypercalcemia
- ECG: Shortened QT interval; short ST segment; J waves (rarely)
Hypocalcemia
- ECG: Prolonged QT interval (due to long ST segment); T wave normal duration
Digitalis (Digoxin) Effect (not toxicity)
- ECG: Scooped ("Salvador Dali moustache") ST depression, especially in lateral leads; shortened QT; T wave changes
Digitalis Toxicity
- ECG: Any arrhythmia, but classically: frequent PVCs (bigeminy), junctional tachycardia, paroxysmal atrial tachycardia with block
Hypothermia
- ECG: Sinus bradycardia; prolonged all intervals; Osborn wave (J wave) - a positive hump at the J point between QRS and ST segment, best seen in V3-V4 and inferior leads. Pathognomonic of hypothermia.
7I - Pericarditis
Acute Pericarditis
-
ECG (4 stages):
- Stage I (hours-days): Diffuse ST elevation (concave up, "saddle-shaped") in multiple leads except aVR and V1; PR depression (PR elevation in aVR - highly specific sign)
- Stage II: ST and PR normalize; T waves flatten
- Stage III: Diffuse T-wave inversions
- Stage IV (weeks-months): Normalization
-
How to distinguish from STEMI: Pericarditis ST elevation is diffuse (not territorial), concave (not convex), with PR depression, and lacks reciprocal changes (except aVR)
7J - ST Elevation: Key Causes to Distinguish
| Condition | ST shape | Distribution | Key clue |
|---|---|---|---|
| STEMI | Convex ("tombstone") | Territorial (regional) | Reciprocal depression; Q waves evolving |
| Pericarditis | Concave (saddle-shaped) | Diffuse, multi-lead | PR depression |
| Early repolarization | Concave | V3-V5 especially | Notch at J point; normal young person |
| LBBB | Discordant | All precordials | Wide QRS |
| Brugada | "Coved" type 1 | V1-V2 (V1-V3) | RBBB-like; SCD risk |
7K - Specific Syndromes
Brugada Pattern
- ECG: RBBB-like morphology with coved-type (type 1) ST elevation in V1-V2 (and V3 with high leads)
- Risk: Sudden cardiac death due to ventricular fibrillation, typically during sleep or fever
- Mechanism: Loss-of-function SCN5A mutation (sodium channel)
Early Repolarization
- ECG: Concave ST elevation with a notch or slur at the J point, typically in V3-V5; often in young athletic individuals
- Mostly benign, but high-risk pattern associated with idiopathic VF exists
Pulmonary Embolism (PE)
- Classic ECG (S1Q3T3):
- S wave in lead I
- Q wave + T-wave inversion in lead III
- Present in only ~20% of PE cases; most common ECG findings are sinus tachycardia and right heart strain changes
- Other PE ECG changes: New RBBB, right axis deviation, T-wave inversions in V1-V4, P pulmonale, AF
7L - Arrhythmias (ECG Recognition)
Sinus Tachycardia
- Rate >100 bpm; normal P-QRS relationship; gradual onset/offset; look for cause (fever, pain, PE, thyrotoxicosis, hypovolemia)
Sinus Bradycardia
- Rate <60 bpm; normal P-QRS; causes: athletes, vagal tone, hypothyroidism, inferior MI, drugs (beta-blockers, digoxin)
Atrial Fibrillation (AF)
- ECG: Irregularly irregular rhythm; absence of distinct P waves (replaced by fibrillatory f-waves); narrow QRS (unless aberrant conduction)
- Rate varies; ventricular response typically 100-180 bpm if untreated
Atrial Flutter
- ECG: "Sawtooth" flutter waves (F waves) at ~300/min in leads II, III, aVF; regular ventricular response at 2:1 (150 bpm), 3:1, or 4:1 conduction
Supraventricular Tachycardia (SVT)
- ECG: Regular, narrow QRS tachycardia (rate 150-250 bpm); P waves may be buried in QRS or appear just after
- Types: AVNRT (most common), AVRT (in WPW), atrial tachycardia
Ventricular Tachycardia (VT)
- ECG: Wide QRS tachycardia (QRS >120 ms), rate >100 bpm; AV dissociation (P waves march independently); fusion beats; capture beats
- Distinguishing VT from SVT with aberrancy: Brugada criteria, AV dissociation = VT until proven otherwise
Ventricular Fibrillation (VF)
- ECG: Chaotic, completely irregular, no recognizable QRS complexes; coarse or fine undulations
- Immediately life-threatening; requires defibrillation
Torsades de Pointes (TdP)
- ECG: Polymorphic VT with QRS complexes that "twist around the isoelectric line"; associated with prolonged QT interval
- Trigger: long-short RR sequence
- Treatment: IV magnesium, correct QT-prolonging cause
Premature Atrial Contractions (PACs)
- ECG: Early P wave with different morphology; may conduct with normal or aberrant QRS; incomplete compensatory pause
Premature Ventricular Contractions (PVCs)
- ECG: Wide, bizarre QRS not preceded by P wave; T wave opposite to QRS; full compensatory pause
- Bigeminy: PVC alternating with normal beat
- Trigeminy: PVC every third beat
- Couplet: Two consecutive PVCs
Junctional Rhythms
- ECG: Narrow QRS without preceding P wave (P absent, retrograde/inverted in II, or buried in QRS); rate 40-60 bpm
- Seen in digoxin toxicity, inferior MI, increased vagal tone
7M - Pacemaker ECG
- Pacing spike followed by wide QRS (LBBB pattern if right ventricular pacing)
- Failure to capture: Pacing spike without subsequent QRS
- Failure to sense: Pacer fires even when native beat is present
Quick Reference Summary Table
| Finding | What it means | Key leads |
|---|---|---|
| Peaked T waves | Hyperkalemia (early) | All leads |
| Flattened T + prominent U | Hypokalemia | II, V3-V5 |
| Short QT | Hypercalcemia, digoxin | All leads |
| Long QT | Hypokalemia, drugs, congenital | All leads |
| Delta wave + short PR | WPW | Variable |
| rSR' in V1 + wide S in I | RBBB | V1, I |
| Broad notched R in V5-V6 | LBBB | V5-V6, I |
| ST elevation (territorial, convex) | STEMI | Regional |
| ST elevation (diffuse, concave) + PR depression | Pericarditis | Diffuse |
| ST depression + T inversion | Subendocardial ischemia, NSTEMI | Regional |
| Pathological Q waves | Old infarction | Regional |
| Irregularly irregular, no P waves | Atrial fibrillation | All leads |
| Sawtooth F waves at 300/min | Atrial flutter | II, III, aVF |
| Wide QRS tachycardia + AV dissociation | Ventricular tachycardia | All leads |
| Twisting wide QRS + long QT | Torsades de pointes | All leads |
| J (Osborn) waves | Hypothermia | V3-V4, inferior |
| Coved ST elevation in V1-V2 | Brugada pattern | V1-V2 |
| S1Q3T3 + sinus tach | Pulmonary embolism | I, III |
Sources: Harrison's Principles of Internal Medicine 22E (2025); Goldman-Cecil Medicine International Edition, 2-Volume Set; Guyton and Hall Textbook of Medical Physiology; all accessed via the medical textbook library.
This is a shared conversation. Sign in to Orris to start your own chat.