I now have comprehensive content from Costanzo (a standard physiology textbook very aligned with GK Pal's topics). I have enough to compile thorough notes. Let me now write the complete respiratory physiology notes.
🫁 Respiratory System Physiology - Complete Notes
(Based on Standard Physiology - GK Pal / Ganong / Costanzo)
1. STRUCTURE OF THE RESPIRATORY SYSTEM
Conducting Zone
The conducting zone includes: Nose → Nasopharynx → Larynx → Trachea → Bronchi → Bronchioles → Terminal bronchioles
- Functions: Carries air to/from the gas exchange zone; warms, humidifies, and filters inhaled air
- The trachea is generation 0; there are 23 bifurcations total
- Lined with mucus-secreting and ciliated cells - particles are trapped in mucus and swept upward (mucociliary escalator)
- Walls contain smooth muscle with dual innervation:
- Sympathetic (β2 receptors): Bronchodilation (epinephrine, albuterol)
- Parasympathetic (muscarinic receptors): Bronchoconstriction
- No gas exchange occurs in the conducting zone - constitutes anatomical dead space (~150 mL)
Respiratory Zone
Includes: Respiratory bronchioles → Alveolar ducts → Alveolar sacs
- Lined with alveoli; gas exchange occurs here
- ~300 million alveoli in adult lungs; total surface area ≈ 70-80 m²
- Alveolar wall contains:
- Type I pneumocytes: Thin, flat cells lining the alveolar surface; facilitate gas diffusion
- Type II pneumocytes: Cuboidal cells; produce surfactant (dipalmitoylphosphatidylcholine - DPPC)
- Alveolar macrophages: Defense cells
2. LUNG VOLUMES AND CAPACITIES
Key Volumes (Measured by Spirometry)
| Volume | Definition | Normal Value |
|---|
| Tidal Volume (TV) | Volume breathed in one normal breath | 500 mL |
| Inspiratory Reserve Volume (IRV) | Extra volume above TV by max inspiration | 3000 mL |
| Expiratory Reserve Volume (ERV) | Extra volume expelled by forced expiration | 1200 mL |
| Residual Volume (RV) | Air remaining after max expiration | 1200 mL |
RV cannot be measured by spirometry - requires helium dilution or body plethysmography.
Key Capacities (Sum of two or more volumes)
| Capacity | Components | Normal Value |
|---|
| Total Lung Capacity (TLC) | TV + IRV + ERV + RV | 5900 mL |
| Vital Capacity (VC) | TV + IRV + ERV | 4700 mL |
| Inspiratory Capacity (IC) | TV + IRV | 3500 mL |
| Functional Residual Capacity (FRC) | ERV + RV | 2400 mL |
- FRC = resting equilibrium point where lung elastic recoil inward = chest wall recoil outward
- FRC cannot be measured by spirometry (contains RV)
3. LUNG MECHANICS - PRESSURES
Pressure Definitions
- Atmospheric pressure (Patm): 760 mm Hg at sea level
- Intrapleural pressure (Pip): Pressure in pleural space = -5 cm H₂O at rest (sub-atmospheric, due to lung recoil pulling inward + chest wall pulling outward)
- Alveolar pressure (PA): Equals Patm at rest (no airflow). During inspiration: becomes negative (-1 cm H₂O) to drive air in. During expiration: becomes positive (+1 cm H₂O)
- Transpulmonary pressure = Palv - Pip = distending pressure keeping lungs open
Events During Normal Breathing
Inspiration (active process):
- Diaphragm contracts → thoracic volume increases
- Intrapleural pressure falls (becomes more negative: -7 cm H₂O)
- Lung volume increases → alveolar pressure falls below atmospheric
- Air flows in down pressure gradient
Expiration (passive at rest):
- Diaphragm relaxes → elastic recoil of lungs
- Intrapleural pressure returns to -5 cm H₂O
- Alveolar pressure rises above atmospheric
- Air flows out
Muscles of inspiration: Diaphragm (primary), external intercostals, accessory muscles (sternocleidomastoid, scalene) during exercise
Muscles of expiration: At rest = passive. Forced expiration = abdominal muscles + internal intercostals
4. SPIROMETRY - FVC & FEV₁
| Parameter | Definition |
|---|
| FVC (Forced Vital Capacity) | Total volume expelled by forced maximal expiration |
| FEV₁ | Volume expelled in first second of FVC maneuver |
| FEV₁/FVC ratio | Normally ~0.80 (80%) |
Obstructive vs Restrictive Pattern
| Pattern | Examples | FVC | FEV₁ | FEV₁/FVC |
|---|
| Obstructive | Asthma, COPD, emphysema | ↓ | ↓↓ (more) | < 0.70 (↓) |
| Restrictive | Fibrosis, obesity, kyphoscoliosis | ↓↓ | ↓ (less) | > 0.80 (↑ or normal) |
Key distinction: In obstruction, FEV₁ falls disproportionately because airway resistance is increased. In restriction, the lung is smaller but empties at normal speed, so FEV₁/FVC ratio is preserved or increased.
5. COMPLIANCE
Compliance = ΔVolume / ΔPressure (mL/cm H₂O)
- Normal lung compliance ≈ 200 mL/cm H₂O
- High compliance = lungs are easily distended (e.g., emphysema - elastic tissue destruction)
- Low compliance = lungs are stiff, hard to inflate (e.g., pulmonary fibrosis, infant respiratory distress syndrome - IRDS)
Factors Affecting Compliance
- Surface tension (major determinant) - reduces compliance (opposes inflation)
- Surfactant - reduces surface tension → increases compliance
- Elastic tissue - increased elastin/collagen = decreased compliance
Surfactant
- Produced by Type II pneumocytes (mature at ~35 weeks gestation)
- Composition: Dipalmitoylphosphatidylcholine (DPPC) - main component
- Role: Reduces surface tension at air-liquid interface of alveoli
- Effect on Laplace's Law: P = 2T/r - without surfactant, small alveoli (small r) would collapse into large alveoli (high pressure). Surfactant prevents this by reducing T more in smaller alveoli
- Absent in premature babies → Respiratory Distress Syndrome (RDS) / Hyaline membrane disease
- Treatment: Exogenous surfactant (beractant, poractant)
6. AIRWAY RESISTANCE
Resistance = Driving pressure / Flow rate (R = ΔP/V̇)
- The medium-sized bronchi (2nd-5th generation) contribute most to airway resistance
- The trachea is large (low resistance); terminal bronchioles are numerous (large collective cross-section = low resistance)
Factors Increasing Resistance (Bronchoconstriction)
- Parasympathetic stimulation (muscarinic receptors)
- Histamine, leukotrienes, thromboxane A₂
- Airway inflammation (asthma)
- Mucus plugging
Factors Decreasing Resistance (Bronchodilation)
- Sympathetic stimulation (β₂ receptor activation)
- Epinephrine, albuterol, theophylline
- Increased lung volume (airways are "pulled open" by the surrounding lung tissue)
7. GAS LAWS (Applied to Lungs)
| Law | Statement | Application |
|---|
| Boyle's Law | P₁V₁ = P₂V₂ (constant T) | ↑ lung volume → ↓ alveolar pressure → air flows in |
| Dalton's Law | Partial pressure = Total P × Fractional conc. | Calculating PO₂, PCO₂ in alveolar gas |
| Henry's Law | [Gas dissolved] = P × solubility | CO₂ is 20× more soluble than O₂ in blood |
| Fick's Law | Diffusion ∝ (A × D × ΔP) / thickness | Basis of alveolar-capillary gas exchange |
Alveolar Gas Equation
PAO₂ = PiO₂ - (PACO₂/RQ)
Where:
- PiO₂ = inspired PO₂ = (Patm - PH₂O) × FiO₂ = (760 - 47) × 0.21 = 150 mm Hg
- PACO₂ = alveolar PCO₂ ≈ arterial PCO₂ ≈ 40 mm Hg
- RQ (Respiratory Quotient) = CO₂ produced / O₂ consumed = 0.8 (mixed diet)
So: PAO₂ = 150 - (40/0.8) = 150 - 50 = 100 mm Hg
Normal Partial Pressures
| Gas | Inspired air | Alveolar | Arterial blood | Venous blood | Tissues |
|---|
| PO₂ | 159 mmHg | 100 mmHg | 95-100 mmHg | 40 mmHg | 40 mmHg |
| PCO₂ | 0.3 mmHg | 40 mmHg | 40 mmHg | 46 mmHg | 46 mmHg |
8. GAS EXCHANGE - DIFFUSION
Fick's Law of Diffusion:
Flux = (D × A × ΔP) / L
Where: D = diffusion coefficient, A = surface area, ΔP = partial pressure gradient, L = membrane thickness
Factors Impairing Gas Exchange
- ↓ Surface area (emphysema - alveolar destruction)
- ↑ Membrane thickness (fibrosis, pulmonary edema)
- ↓ Partial pressure gradient (high altitude)
Diffusion-Limited vs Perfusion-Limited Exchange
| Type | Meaning | Examples |
|---|
| Perfusion-limited | Gas equilibrates rapidly; exchange limited by blood flow | O₂ (normal), CO₂, N₂O |
| Diffusion-limited | Gas never fully equilibrates across membrane | O₂ (fibrosis, exercise at altitude), CO |
- CO is the best example of purely diffusion-limited gas (binds tightly to Hb, so no back-pressure builds)
- In fibrosis or exercise at high altitude, O₂ becomes diffusion-limited because the membrane is thickened or capillary transit time is too short
9. OXYGEN TRANSPORT IN BLOOD
Two Forms of O₂ in Blood
| Form | Amount | Key Point |
|---|
| Dissolved O₂ | ~3% of total | = PaO₂ × 0.003 mL/100 mL/mmHg; only dissolved O₂ creates partial pressure |
| Bound to Hemoglobin | ~97% of total | Does NOT contribute to PaO₂ |
At PaO₂ = 100 mmHg: Dissolved O₂ = only 0.3 mL/100 mL (grossly insufficient for 250 mL O₂/min demand)
O₂ Bound to Hemoglobin
- Each Hb molecule has 4 heme groups, each binds 1 O₂
- O₂ binding capacity = 1.34 mL O₂/g Hb (Huffner's constant)
- Normal Hb = 15 g/100 mL blood
- Max O₂ content = 15 × 1.34 = ~20 mL O₂/100 mL blood
O₂-Hemoglobin Dissociation Curve
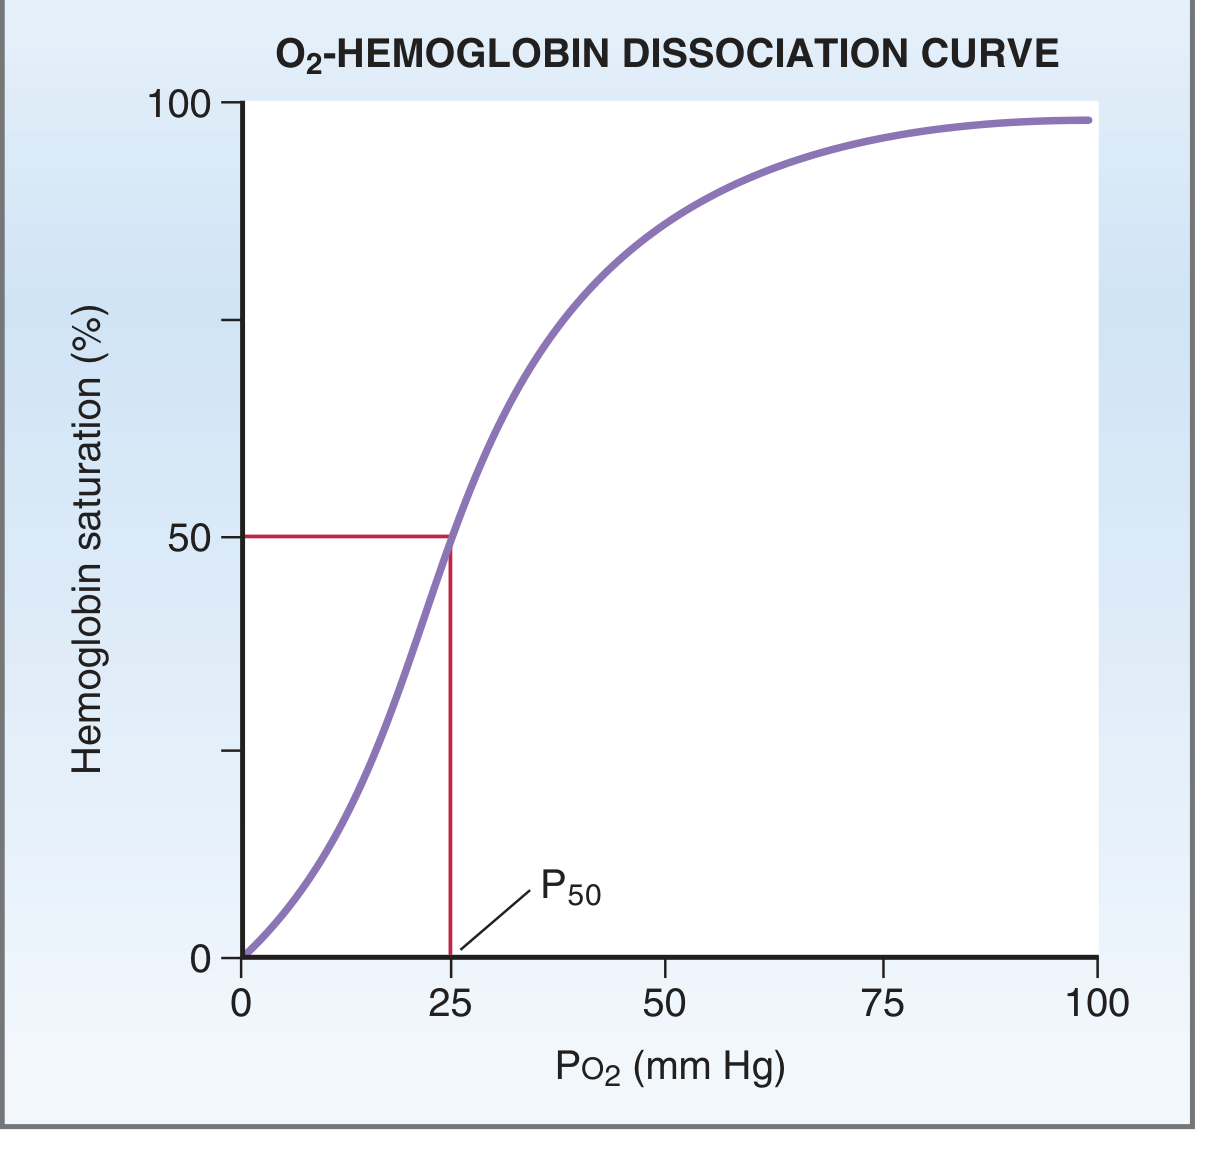
The curve is sigmoidal because of positive cooperativity: binding of first O₂ molecule to Hb increases affinity for subsequent O₂ molecules.
Key values:
- At PO₂ = 100 mmHg (arterial): Saturation ≈ 98%
- At PO₂ = 40 mmHg (venous): Saturation ≈ 75%
- P50 = PO₂ at which Hb is 50% saturated = 25-27 mmHg (normal)
Bohr Effect & Shifts of the Curve
| Shift | Cause | Effect | Physiologic significance |
|---|
| Right shift (↑ P50) | ↑ PCO₂, ↑ H⁺ (↓ pH), ↑ temperature, ↑ 2,3-BPG | ↓ O₂ affinity → releases O₂ | At tissues: high CO₂/H⁺ → O₂ unloaded to active tissues |
| Left shift (↓ P50) | ↓ PCO₂, ↓ H⁺ (↑ pH), ↓ temperature, ↓ 2,3-BPG, HbF | ↑ O₂ affinity → holds O₂ | At lungs: low CO₂ → O₂ loaded onto Hb |
- Bohr Effect: ↑ CO₂/H⁺ shifts curve right → promotes O₂ unloading in tissues
- HbF has high O₂ affinity (left shift) → draws O₂ from maternal HbA across placenta
- CO poisoning: CO binds Hb 240× more avidly than O₂; also causes left shift → impairs O₂ delivery
O₂ Delivery to Tissues
DO₂ = Cardiac output × O₂ content of blood
= 5 L/min × 20 mL/100 mL = 1000 mL O₂/min
Tissues consume ~250 mL/min at rest → extraction fraction = 25%
10. CO₂ TRANSPORT IN BLOOD
CO₂ is transported in three forms:
| Form | Percentage | Details |
|---|
| Dissolved CO₂ | ~10% | CO₂ × 0.07 mL/100 mL/mmHg |
| Carbamino compounds (bound to Hb) | ~30% | CO₂ + Hb-NH₂ → Hb-NHCOO⁻; deoxyHb carries more CO₂ |
| Bicarbonate (HCO₃⁻) | ~60% (most important) | Via carbonic anhydrase in RBCs |
Bicarbonate Mechanism (in tissues)
- CO₂ enters RBC from tissues
- CO₂ + H₂O → H₂CO₃ (carbonic anhydrase)
- H₂CO₃ → H⁺ + HCO₃⁻
- HCO₃⁻ exits RBC → plasma (in exchange for Cl⁻ = Chloride Shift via Band 3 protein)
- H⁺ is buffered by deoxyhemoglobin (Haldane effect)
Haldane Effect
Deoxygenated Hb (in tissues) is a better buffer for H⁺ and carries more CO₂ as carbamino than oxyHb. This complements the Bohr effect:
- At tissues: O₂ unloaded → HbO₂ becomes deoxyHb → buffers H⁺ from CO₂ → more CO₂ can be loaded
- At lungs: O₂ loaded → deoxyHb becomes HbO₂ → releases H⁺ and CO₂ → CO₂ expired
11. VENTILATION/PERFUSION (V/Q) RELATIONSHIPS
Normal V/Q ratio = 0.8 (ventilation ~4 L/min, blood flow ~5 L/min)
Regional V/Q Differences (Upright position)
| Lung Zone | Ventilation | Blood flow | V/Q ratio | Effect |
|---|
| Apex (Zone 1) | Less than base | Very little | V/Q > 1 (high) | Dead space-like; higher PAO₂, lower PACO₂ |
| Base (Zone 3) | Greater than apex | Greater than apex | V/Q < 1 (low) | Shunt-like; lower PAO₂, higher PACO₂ |
Blood flow increases from apex to base due to gravity (recruitment of vessels).
Extreme V/Q Values
| Situation | V/Q | Meaning |
|---|
| Dead space | V/Q = ∞ | Ventilated but not perfused; PAO₂ = 150, PACO₂ = 0 |
| Shunt | V/Q = 0 | Perfused but not ventilated; deoxygenated blood returns to left heart |
Hypoxic Vasoconstriction
- Low PAO₂ in alveoli → pulmonary vasoconstriction (unique to pulmonary circulation)
- Diverts blood away from poorly ventilated areas → optimizes V/Q matching
- Opposite to systemic circulation where hypoxia causes vasodilation
Alveolar-Arterial (A-a) Gradient
- Normal: 5-15 mm Hg (slightly increased with age)
- Formula: A-a gradient = PAO₂ - PaO₂
- ↑ A-a gradient indicates V/Q mismatch, diffusion impairment, or shunt
- Normal A-a gradient with hypoxia = hypoventilation (pure)
12. CONTROL OF BREATHING
Respiratory Centers in Brain Stem
| Center | Location | Function |
|---|
| Dorsal Respiratory Group (DRG) | Medulla | Primary inspiratory center; sets basic rhythm |
| Ventral Respiratory Group (VRG) | Medulla | Active expiration and forced inspiration |
| Pneumotaxic center | Upper Pons | Turns off inspiration; limits tidal volume |
| Apneustic center | Lower Pons | Promotes sustained inspiration; inhibited by pneumotaxic center |
Hering-Breuer reflex: Lung stretch receptors (mechanoreceptors in airways) → via vagus nerve → inhibit inspiration when lungs are over-inflated
Chemoreceptors
Central Chemoreceptors
- Location: Ventral surface of medulla (brain stem)
- Stimulus: ↑ H⁺ in CSF (caused by ↑ arterial PCO₂ diffusing across blood-brain barrier)
- CO₂ crosses blood-brain barrier → forms H⁺ in CSF → stimulates central chemoreceptors
- H⁺ and HCO₃⁻ cannot cross blood-brain barrier
- Response: ↑ Ventilation (most important day-to-day regulator)
- PCO₂ is the most important stimulus for breathing under normal conditions
Peripheral Chemoreceptors
- Location: Carotid bodies (CN IX) and Aortic bodies (CN X)
- Stimuli:
- ↓ PO₂ (most important stimulus for peripheral receptors) - respond dramatically when PaO₂ < 60 mmHg
- ↑ PCO₂
- ↓ pH (↑ H⁺)
- Relatively insensitive to PO₂ when it is between 60-100 mmHg
- In chronic lung disease (COPD with hypercapnia): CO₂ loses efficacy → hypoxic drive becomes primary stimulus
Response to CO₂ (Normal)
↑ PCO₂ → ↑ H⁺ in CSF → central chemoreceptors → ↑ ventilation → CO₂ eliminated → PCO₂ normalized
Response to O₂ (Hypoxia)
PaO₂ < 60 mmHg → peripheral chemoreceptors activated → ↑ ventilation → CO₂ blown off → respiratory alkalosis
13. ALVEOLAR VENTILATION
Dead Space
| Type | Definition | Normal Value |
|---|
| Anatomical dead space | Volume of conducting airways (no gas exchange) | ~150 mL |
| Alveolar dead space | Ventilated but non-perfused alveoli | ~0 (normally minimal) |
| Physiological dead space | Anatomical + Alveolar dead space | ~150 mL (= anatomical in health) |
Bohr Equation (measures physiological dead space):
VD/VT = (PACO₂ - PECO₂) / PACO₂
Alveolar Ventilation Equation
V̇A = (VT - VD) × RR
- Normal: VA = (500 - 150) × 12 = 4200 mL/min
Alveolar CO₂ Equation:
PACO₂ = (V̇CO₂ / V̇A) × K
- ↑ Ventilation → ↓ PACO₂ (more CO₂ blown off)
- ↓ Ventilation (hypoventilation) → ↑ PACO₂ → ↑ PaCO₂ → respiratory acidosis
14. HIGH ALTITUDE PHYSIOLOGY
Changes at high altitude (↓ barometric pressure → ↓ PO₂):
| Change | Mechanism |
|---|
| ↓ PaO₂, ↓ PAO₂ | ↓ Barometric pressure → ↓ inspired PO₂ |
| Hyperventilation | Hypoxia stimulates peripheral chemoreceptors |
| Respiratory alkalosis (acute) | Hyperventilation blows off CO₂ → ↓ PaCO₂ → ↑ pH |
| ↑ 2,3-BPG (within hours-days) | Right shift of ODC → ↑ O₂ unloading to tissues |
| ↑ EPO → Polycythemia (chronic) | Kidney detects hypoxia → ↑ erythropoietin → ↑ RBC production |
| Pulmonary hypertension | Hypoxic vasoconstriction in multiple areas → ↑ pulmonary vascular resistance |
| ↑ 2,3-DPG compensates for alkalosis | Competing effect: alkalosis causes left shift, 2,3-BPG causes right shift |
15. PULMONARY CIRCULATION
| Feature | Pulmonary | Systemic |
|---|
| Resistance | Low (PAP = 25/8 mmHg; mean ~15 mmHg) | High (MAP = 93 mmHg) |
| Flow | Equal to systemic cardiac output | Equal to pulmonary |
| Regulation to hypoxia | Vasoconstriction (unique!) | Vasodilation |
| Capillary pressure | ~10 mmHg | ~30 mmHg |
| Purpose of low pressure | Prevent pulmonary edema | Drive systemic perfusion |
West's Zones of the Lung (Blood flow distribution in upright position)
| Zone | Relationships | Flow |
|---|
| Zone 1 (apex) | Pa > Pv but PA > Pa possible | Minimal/no flow (dead space) |
| Zone 2 (mid) | Pa > PA > Pv | Intermittent flow |
| Zone 3 (base) | Pa > Pv > PA | Continuous maximum flow |
(Pa = arterial pressure, Pv = venous pressure, PA = alveolar pressure)
16. SPECIAL TOPICS
Hypoxia - Types and Causes
| Type | Mechanism | Example |
|---|
| Hypoxic hypoxia | ↓ PaO₂ | High altitude, V/Q mismatch, hypoventilation |
| Anemic hypoxia | ↓ Hb concentration or function | Anemia, CO poisoning |
| Stagnant (ischemic) hypoxia | ↓ Blood flow | Heart failure, shock |
| Histotoxic hypoxia | Cells cannot use O₂ | Cyanide poisoning (inhibits cytochrome oxidase) |
Cyanosis
- Appears when deoxygenated Hb > 5 g/dL in peripheral blood
- Central cyanosis = arterial blood is desaturated (cardiopulmonary cause)
- Peripheral cyanosis = poor perfusion (vasoconstriction, heart failure)
- Anemic patients may not show cyanosis even with severe hypoxia (not enough Hb to accumulate 5 g/dL deoxyHb)
Effects of Breathing on Lung Disease
- Asthma: Reversible airway obstruction, bronchospasm, hyperinflation (↑ RV), air trapping
- COPD/Emphysema: Destruction of alveolar walls → ↑ compliance, ↓ elastic recoil, air trapping, ↑ TLC, ↑ RV/TLC ratio
- Pulmonary Fibrosis: ↓ Compliance, ↓ TLC, ↓ FVC, ↑ FEV₁/FVC ratio
QUICK SUMMARY TABLE - Key Values
| Parameter | Normal Value |
|---|
| Tidal Volume | 500 mL |
| RR at rest | 12-16/min |
| Minute ventilation | ~6 L/min |
| Alveolar ventilation | ~4.2 L/min |
| Dead space | 150 mL |
| FRC | 2400 mL |
| TLC | 5900 mL |
| VC | 4700 mL |
| RV | 1200 mL |
| FEV₁/FVC | ≥ 0.80 |
| PaO₂ | 95-100 mmHg |
| PaCO₂ | 35-45 mmHg |
| pH (arterial) | 7.35-7.45 |
| P50 | 25-27 mmHg |
| Normal V/Q | 0.8 |
| O₂ binding capacity | 1.34 mL/g Hb |
| Normal A-a gradient | 5-15 mmHg |
EXAM-FOCUS POINTS (GK Pal Style)
- RV and FRC cannot be measured by spirometry - need body plethysmography or helium dilution
- FEV₁/FVC < 0.70 = obstructive; > 0.80 = restrictive (normal or ↑)
- Surfactant = DPPC, made by Type II pneumocytes, reduces surface tension, prevents alveolar collapse
- Central chemoreceptors respond to PCO₂ via H⁺ in CSF; peripheral respond to ↓ PO₂, ↑ PCO₂, ↓ pH
- Bohr effect: ↑ CO₂/H⁺ → right shift ODC → ↑ O₂ unloading (tissues)
- Haldane effect: Deoxygenation of Hb promotes CO₂ loading; oxygenation promotes CO₂ unloading
- CO₂ transport: 60% as HCO₃⁻, 30% carbamino, 10% dissolved
- Hypoxic vasoconstriction is unique to pulmonary circulation (opposite of systemic)
- P50 = 25-27 mmHg; right shift = ↑ P50 = ↓ affinity = ↑ O₂ release
- Physiological dead space = Anatomical (normal); Anatomical = 150 mL
- CO poisoning: Left shift + carboxyhemoglobin → cellular hypoxia even with normal PaO₂
- Type II pneumocytes produce surfactant and regenerate Type I cells after injury
- Hering-Breuer reflex: Prevents over-inflation; via pulmonary stretch receptors → vagus → inhibits DRG
Source: Costanzo Physiology 7th Edition (aligned with GK Pal Textbook of Medical Physiology topics) - Respiratory Physiology Chapter