

Graph
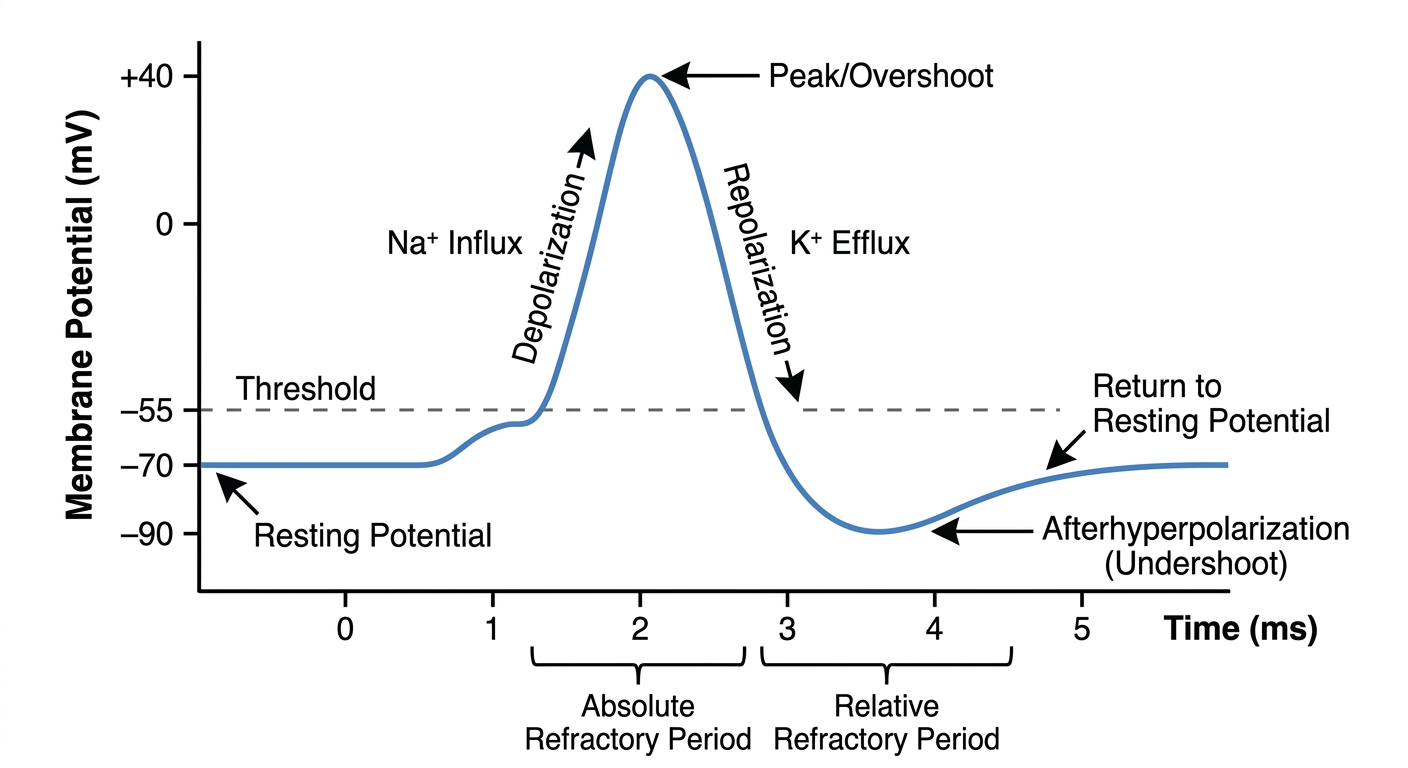
A well-labeled diagram of the action potential of a nerve (neuron). The graph shows membrane potential in millivolts (mV) on the Y-axis (ranging from -90 mV to +40 mV) and time in milliseconds (ms) on the X-axis. The curve starts at the resting membrane potential of -70 mV, then shows: 1) Threshold at -55 mV marked with a dashed line, 2) Rapid depolarization phase rising steeply to +40 mV (peak/overshoot), 3) Repolarization phase falling back down, 4) Afterhyperpolarization (undershoot) dipping below -70 mV to about -90 mV, 5) Return to resting membrane potential. All phases are clearly labeled with arrows. Ionic basis labeled: Na+ influx during depolarization, K+ efflux during repolarization. Phases labeled: resting potential, threshold, depolarization, repolarization, hyperpolarization, absolute refractory period and relative refractory period marked on the time axis. Clean white background, black axes, blue curve, professional scientific diagram style.
Key Labels to Know for Your Practical
| Phase | Voltage | Ionic Basis |
|---|---|---|
| Resting Membrane Potential | -70 mV | K⁺ leak channels open; Na⁺/K⁺ ATPase active |
| Threshold | -55 mV | Minimum stimulus needed to trigger AP |
| Depolarization (Rising phase) | -55 mV → +40 mV | Voltage-gated Na⁺ channels open → Na⁺ rushes IN |
| Overshoot / Peak | +40 mV | Na⁺ channels inactivate |
| Repolarization (Falling phase) | +40 mV → -70 mV | Voltage-gated K⁺ channels open → K⁺ flows OUT |
| Afterhyperpolarization (Undershoot) | ~-90 mV | K⁺ channels slow to close |
| Return to resting potential | -70 mV | Na⁺/K⁺ ATPase restores balance |
Refractory Periods
- Absolute Refractory Period - during depolarization and most of repolarization; no stimulus, however strong, can generate another AP (Na⁺ channels inactivated)
- Relative Refractory Period - during afterhyperpolarization; a stronger-than-normal stimulus can trigger an AP (some K⁺ channels still open)
Important Notes for OSPE / Viva Voce
- The AP follows the all-or-none law - it either fires fully or not at all
- The AP is self-propagating along the axon
- Duration of nerve AP is approximately 1 ms (much shorter than cardiac AP ~200-400 ms)
- The Na⁺/K⁺ ATPase pump restores ionic balance after the AP but is not responsible for repolarization - that is done by K⁺ efflux


Complete the graph
A well-labeled scientific diagram of the Action Potential of Skeletal Muscle. The graph has membrane potential in millivolts (mV) on the Y-axis ranging from -90 mV to +30 mV, and time in milliseconds (ms) on the X-axis (0 to 5 ms). The curve shows: 1) Resting membrane potential at -90 mV (labeled), 2) Threshold at -70 mV marked with a dashed horizontal line (labeled), 3) Rapid depolarization phase rising steeply to +30 mV (labeled, due to Na+ influx), 4) Repolarization phase falling back sharply (labeled, due to K+ efflux), 5) Brief afterhyperpolarization dipping slightly below -90 mV, 6) Return to resting potential. All phases labeled with arrows. Ionic basis shown with annotations: Na+ in (upward arrow during depolarization), K+ out (downward arrow during repolarization). Absolute refractory period and relative refractory period marked with brackets on time axis. Duration approximately 2-5 ms noted. Title at top: "21.2 Action Potential of Skeletal Muscle". Clean white background, labeled X and Y axes with units, professional physiology textbook style, blue curve on white.
A well-labeled scientific diagram of the Action Potential of Cardiac Muscle (ventricular muscle). The graph has membrane potential in millivolts (mV) on the Y-axis ranging from -90 mV to +20 mV, and time in milliseconds (ms) on the X-axis (0 to 300 ms). The curve shows the 5 classic phases clearly labeled: Phase 0 - rapid depolarization (steep rise from -90 mV to +20 mV, due to fast Na+ channels opening), Phase 1 - early rapid repolarization (brief notch downward, due to K+ efflux and Na+ channel inactivation), Phase 2 - plateau (flat prolonged phase near 0 mV lasting ~200 ms, due to Ca2+ influx through L-type calcium channels balancing K+ efflux, labeled "Plateau - Ca2+ influx"), Phase 3 - final rapid repolarization (steep fall back to -90 mV, due to K+ efflux), Phase 4 - resting membrane potential (flat line at -90 mV). Each phase numbered 0-4 with arrows and ionic basis annotated. Absolute refractory period bracket spanning phases 0-3 (very long, ~250 ms). Title: "21.3 Action Potential of Cardiac Muscle". Clean white background, labeled axes with units, professional physiology textbook style, red curve.
A well-labeled scientific diagram of the Pacemaker Potential (Sinoatrial Node / SA Node action potential). The graph has membrane potential in millivolts (mV) on the Y-axis ranging from -70 mV to +20 mV, and time in milliseconds (ms) on the X-axis showing 2-3 complete cycles. The curve shows: 1) Maximum diastolic potential (MDP) at -60 mV (labeled), 2) Slow spontaneous depolarization / prepotential / pacemaker potential - a gradual upward slope from -60 mV to threshold at -40 mV (labeled "Pacemaker potential / Funny current - If, due to Na+ influx and K+ channel closure"), 3) Threshold at -40 mV marked with dashed horizontal line (labeled), 4) Rapid upstroke to +20 mV (labeled "Depolarization - Ca2+ influx via L-type channels, NO fast Na+ channels"), 5) Repolarization back to MDP (labeled "K+ efflux"), cycle then repeats automatically. Key labels: "No stable resting potential", "Automaticity", "If (funny current)", "Ca2+ dependent upstroke (unlike nerve/skeletal)". Title: "21.4 Pacemaker Potential (SA Node)". Clean white background, green curve, labeled axes with units, professional physiology diagram.
Generate again
A well-labeled scientific diagram of the Action Potential of Skeletal Muscle. The graph has membrane potential in millivolts (mV) on the Y-axis ranging from -90 mV to +30 mV, and time in milliseconds (ms) on the X-axis (0 to 5 ms). The curve shows: 1) Resting membrane potential at -90 mV (labeled), 2) Threshold at -70 mV marked with a dashed horizontal line (labeled), 3) Rapid depolarization phase rising steeply to +30 mV (labeled, due to Na+ influx), 4) Repolarization phase falling back sharply (labeled, due to K+ efflux), 5) Brief afterhyperpolarization dipping slightly below -90 mV, 6) Return to resting potential. All phases labeled with arrows. Ionic basis shown: Na+ in during depolarization, K+ out during repolarization. Absolute refractory period and relative refractory period marked with brackets on time axis. Duration approximately 2-5 ms noted. Title at top: "21.2 Action Potential of Skeletal Muscle". Clean white background, labeled X and Y axes with units, professional physiology textbook style, blue curve.
A well-labeled scientific diagram of the Action Potential of Cardiac Muscle (ventricular myocyte). The graph has membrane potential in millivolts (mV) on the Y-axis ranging from -90 mV to +20 mV, and time in milliseconds (ms) on the X-axis (0 to 300 ms). The curve shows 5 phases clearly labeled with numbers in circles: Phase 0 - rapid depolarization (steep rise from -90 mV to +20 mV, fast Na+ influx), Phase 1 - early repolarization (brief notch, transient K+ efflux), Phase 2 - plateau (long flat section near 0 mV for ~200 ms, Ca2+ influx balances K+ efflux), Phase 3 - rapid repolarization (steep fall to -90 mV, K+ efflux), Phase 4 - stable resting membrane potential at -90 mV. Each phase numbered 0 to 4 with ionic basis annotated. Long absolute refractory period bracket spanning phases 0 through 3. Title: "21.3 Action Potential of Cardiac Muscle". White background, red curve, labeled axes with units, professional physiology textbook diagram.
A well-labeled scientific diagram of the Pacemaker Potential of the SA Node. The graph has membrane potential in millivolts (mV) on the Y-axis ranging from -70 mV to +20 mV, and time on the X-axis showing 2 complete spontaneous cycles. The curve shows: 1) Maximum Diastolic Potential (MDP) at -60 mV labeled, 2) Slow spontaneous depolarization slope rising from -60 mV up to threshold at -40 mV - labeled "Pacemaker potential (If - funny current, Na+ influx)", 3) Dashed horizontal threshold line at -40 mV labeled "Threshold -40 mV", 4) Rapid upstroke to +20 mV labeled "Depolarization (Ca2+ via L-type channels)", 5) Repolarization back down to MDP labeled "K+ efflux", then cycle repeats. Key annotations: "No stable resting potential", "Automaticity". Title: "21.4 Pacemaker Potential (SA Node)". Clean white background, green curve, labeled axes with units, professional physiology textbook style.
Hello
Bhai