
Erythropoiesis
erythropoiesis stages red blood cell development
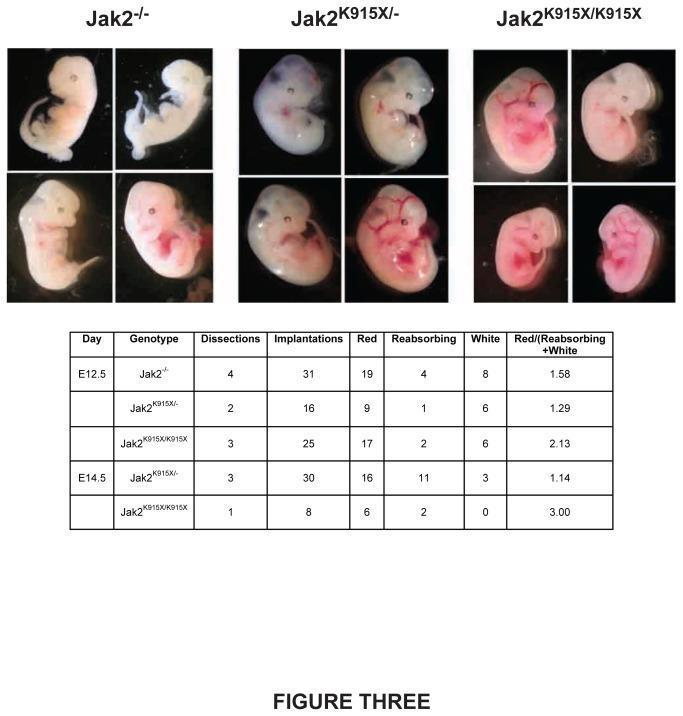
Educational medical graphic presenting a comparative analysis of embryonic development in mouse models with different Jak2 mutations. The upper portion contains clinical photographs of representative embryos at gestational stage E12.5, categorized by genotype: Jak2-/-, Jak2 K915X/-, and Jak2 K915X/K915X. The Jak2-/- embryos appear predominantly blanched and white, indicating severe anemia or impaired erythropoiesis. The Jak2 K915X/- group shows variable phenotypes from white to partially red, while the Jak2 K915X/K915X homozygous mutants appear notably redder, suggesting improved vascularization or red blood cell production. Below the photographs, a clinical data table summarizes quantitative findings from dissections at stages E12.5 and E14.5. The table lists genotypes against implantation counts and developmental outcomes, categorized as 'Red' (healthy), 'Reabsorbing' (terminal), or 'White' (anemic). This resource illustrates the impact of Jak2 mutations on fetal hematopoiesis and embryonic viability, demonstrating how specific mutations like K915X may modulate the lethal null phenotype.
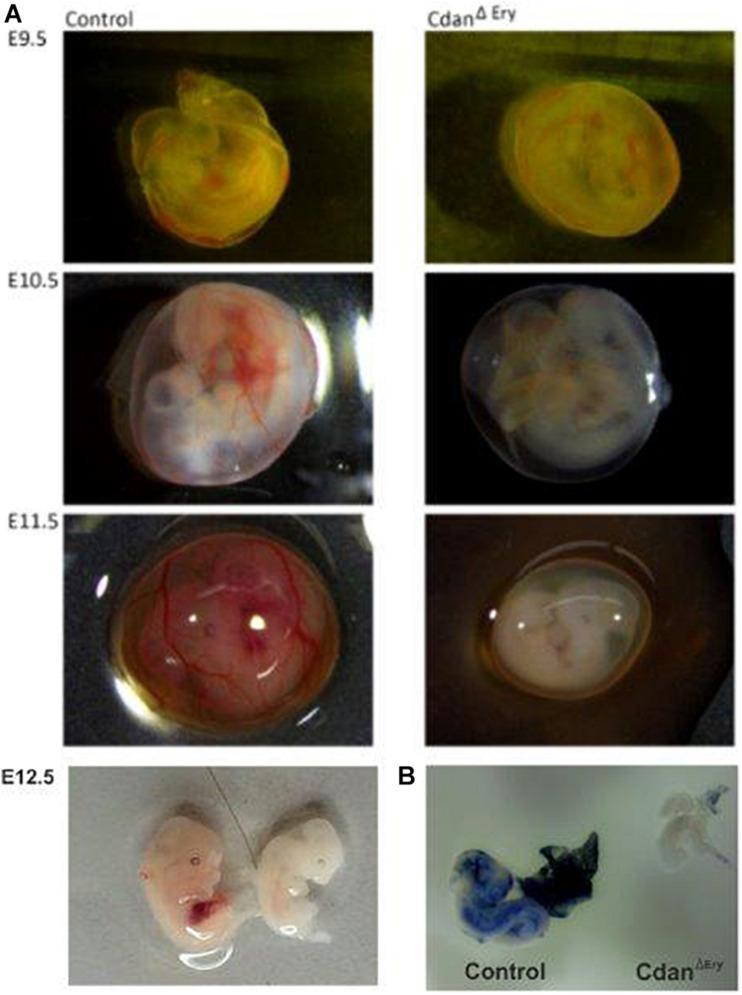
Educational comparison of mouse embryo development highlighting the phenotype of Cdan1 (Codanin-1) erythroid-specific deletion (CdanΔEry). Panel A presents a longitudinal timeline of embryos from developmental stages E9.5 to E12.5. Control embryos demonstrate physiological maturation characterized by progressive deepening of red coloration and well-defined branching vasculature, reflecting normal hemoglobinization and erythropoiesis. In contrast, CdanΔEry embryos exhibit severe anemia, appearing progressively pale and translucent from E10.5 onwards, with a complete absence of visible blood vessels and a lack of fetal liver development. Panel B displays Benzidine staining of E10.5 embryos, a histochemical method for detecting hemoglobin. The control embryo and its associated yolk sac show intense blue staining, indicating robust heme presence. The CdanΔEry mutant embryo and its yolk sac are significantly smaller and exhibit minimal to no staining, confirming severe primitive erythroid failure and anemia. This visual evidence supports the role of Codanin-1 in primitive erythropoiesis, relevant to the study of Congenital Dyserythropoietic Anemia type I (CDA-I).
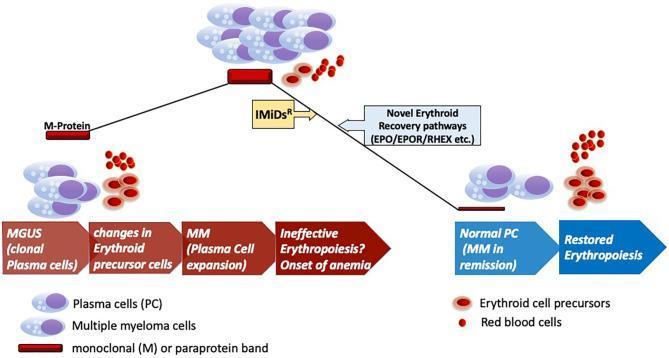
A pathophysiology diagram illustrating the disease progression of monoclonal gammopathy of undetermined significance (MGUS) to multiple myeloma (MM) and the subsequent impact on erythropoiesis. The visual follows a peak-like trajectory: the left side shows the progression from MGUS (clonal plasma cells) to MM (plasma cell expansion), characterized by a thickening M-protein band and increasingly ineffective erythropoiesis leading to anemia. At the peak, malignant multiple myeloma cells dominate the bone marrow environment alongside sparse red blood cells and erythroid precursors. The downward right slope depicts therapeutic intervention using immunomodulatory drugs (IMiDsR) and the engagement of novel erythroid recovery pathways involving EPO, EPOR, and RHEX. This phase represents MM in remission (Normal PC) and the clinical restoration of erythropoiesis, visualized by the return of mature red blood cells and normal erythroid precursor levels. Key components include plasma cells, monoclonal (M) paraprotein bands, and the sequential maturation stages of the erythroid lineage.
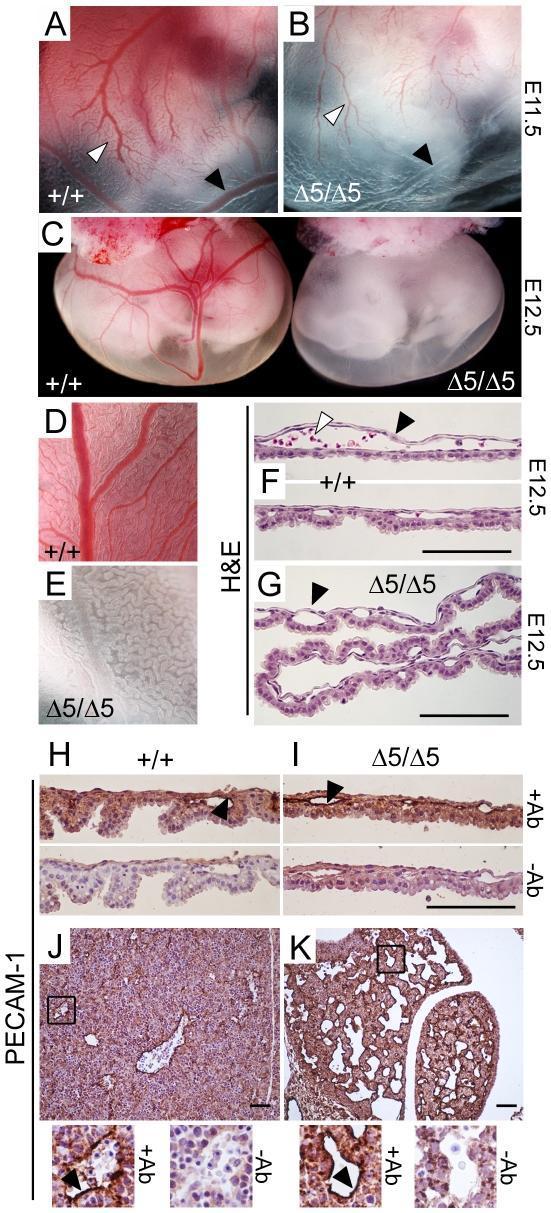
This composite figure presents a comparative developmental study of mouse embryos (wild-type +/+ vs. PiT1Δ5/Δ5 mutant) at stages E11.5 and E12.5, focusing on yolk sac vasculature and liver morphology. Gross clinical photographs (A–E) demonstrate that while the mutant PiT1Δ5/Δ5 embryos develop a normal tree-like vascular architecture, the vessels appear pale or translucent and are significantly devoid of red blood cells compared to the vibrant red vessels of the wild-type, indicating profound anemia. Histological analysis via H&E staining (F–G) of E12.5 yolk sac cross-sections confirms the presence of vascular channels (black arrows) in both genotypes, but highlights the absence of intraluminal erythrocytes (white arrows) in the mutant. Immunohistochemistry (IHC) using anti-PECAM-1 (CD31) staining (H–K) identifies intact endothelial cell layers in both the yolk sac and fetal liver of mutant embryos, suggesting that the primary defect is not structural vasculogenesis but rather related to definitive erythropoiesis. High-magnification liver sections (J–K) show increased vessel density in the mutant liver relative to its severely reduced organ size.
erythroid precursors bone marrow normoblast reticulocyte
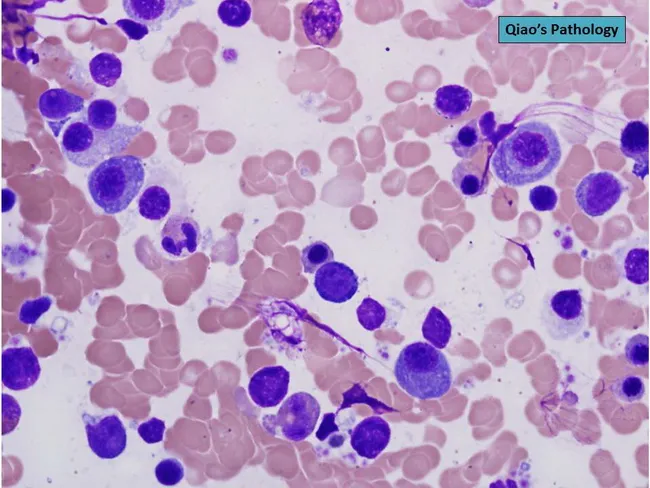
Brightfield light microscopy of a Wright-Giemsa stained bone marrow aspirate smear at 100x oil immersion reveals a quantitative increase in plasma cells with intermediate maturation (between mature and immature) among a heterogeneous hematopoietic background of erythroid and myeloid precursors. The plasma cells are characterized by relatively abundant basophilic cytoplasm containing granular inclusions and by moderately dispersed chromatin in their nuclei. Some cells appear with eccentric nuclei and prominent cytoplasmic features typical of plasma cells, while others show more condensed nuclear chromatin suggesting an intermediate maturation stage. The smear lacks a delicate histologic architecture but demonstrates a clonal-appearing proliferation pattern in aspirate cytology; background hematopoiesis includes mature and immature forms. Overall, these features point toward plasmacytosis and warrant differentiation between reactive plasmacytosis and neoplastic plasma cell disorders. Clinically, increased plasma cells in bone marrow can reflect plasma cell dyscrasias such as multiple myeloma, MGUS, or plasmacytoma, or reactive processes secondary to infection or autoimmune disease. Diagnostic significance hinges on ancillary testing: flow cytometry for clonality, immunoglobulin profiling (serum protein electrophoresis and immunofixation), serum free light chains, and bone marrow cytogenetics. This image is valuable for education, differential diagnosis, and correlating morphological features with clinical investigations in hematology and pathology for diagnostics.
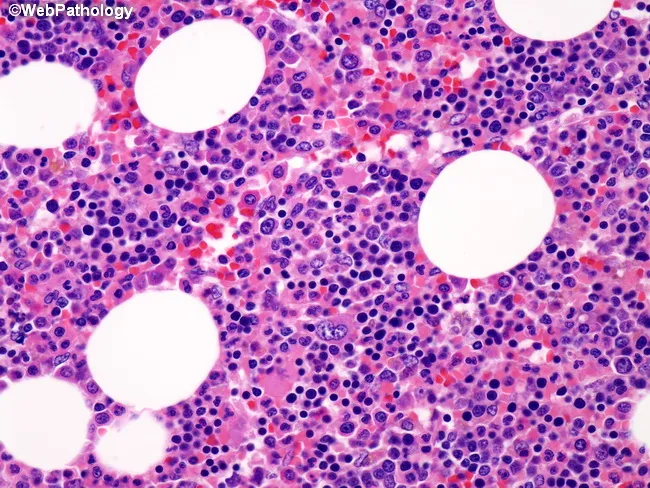
This histopathology image depicts a bone marrow component embedded within an adrenal myelolipoma. The marrow shows preserved trilineage hematopoiesis, consisting of erythroid, myeloid, and megakaryocytic lineages, in a normal morphological spectrum. Notably, there is an increased number of megakaryocytes, distributed singly and in small clusters, without overt dysplasia or abnormal mitotic figures. The hematopoietic elements appear well-differentiated with typical chromatin pattern and nuclear morphology; there is no significant crowding or fibrosis evident at the margins of the field. Adipose tissue elements characteristic of myelolipoma interdigitate with hematopoietic elements, consistent with a benign composite lesion rather than marrow failure or infiltrative malignancy. The image is stained with Hematoxylin and Eosin and examined under light microscopy; cells show dark purple nuclei (hematopoietic precursors) against pink-orange cytoplasm and pale adipocytes in the background. Clinically, such a finding indicates retained marrow activity within the adrenal lesion and does not in itself imply a systemic myeloproliferative disorder. Correlate with complete blood count, platelets, JAK2 mutation status if hematologic neoplasm is suspected, and radiologic assessment to differentiate from extramedullary hematopoiesis or malignant infiltration. These findings emphasize the benign nature of the marrow component within adrenal myelolipoma and aid histopathologic differentiation from marrow-related malignancies in diagnostic practice.
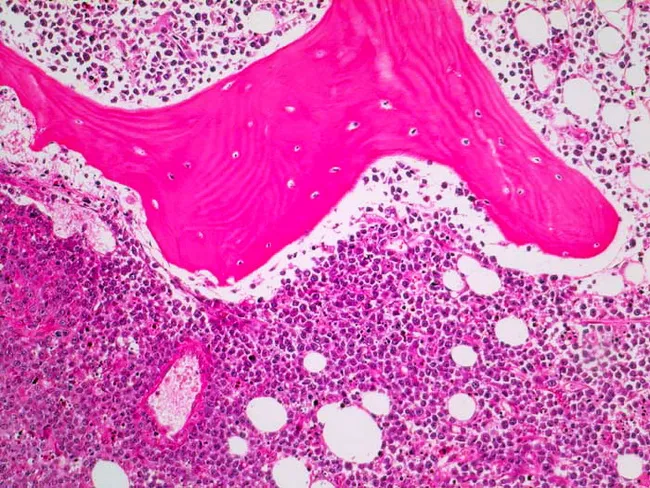
This histopathology image depicts a bone marrow biopsy section stained with Hematoxylin and Eosin (H&E) at light microscopy. The normal marrow architecture is variably disrupted with focal to diffuse infiltration by large neoplastic lymphoid cells. The malignant cells display abundant cytoplasm, conspicuous nuclei with vesicular chromatin, and prominent nucleoli, forming sheets that partially replace hematopoietic tissue and normal adipose elements. A delicate pink stromal background and scattered macrophages are evident; residual marrow elements show diminished erythroid and myeloid precursors in zones of tumor involvement. The pink fibrillary areas likely reflect fibrous marrow or reactive reticulin fibers. In this frame, the cellular density is high and mitotic activity appears brisk, consistent with an aggressive B-cell lymphoma morphology. Immunophenotypically, the tumor cells are CD20 positive (as noted clinically), supporting a diagnosis of diffuse large B-cell lymphoma (DLBCL) involving the bone marrow. The image exemplifies marrow involvement by a systemic lymphoma and illustrates two clinicopathologic scenarios discussed in DLBCL: concordant marrow involvement (same lymphoma histology in nodal and marrow sites) versus discordant involvement (indolent lymphoma in marrow with high-grade disease elsewhere). This case emphasizes the prognostic and staging implications of marrow infiltration and the potential impact on treatment planning, including rituximab-containing regimens options.
Erythropoiesis
1. Sites of Erythropoiesis Across Life
| Period | Site |
|---|---|
| Early embryo (yolk sac) | Primitive (megaloblastic) erythropoiesis |
| Fetal life (liver, spleen) | Hepatic/splenic phase |
| Adult | Red bone marrow (axial skeleton, proximal long bones) |
2. Progenitor Cell Hierarchy
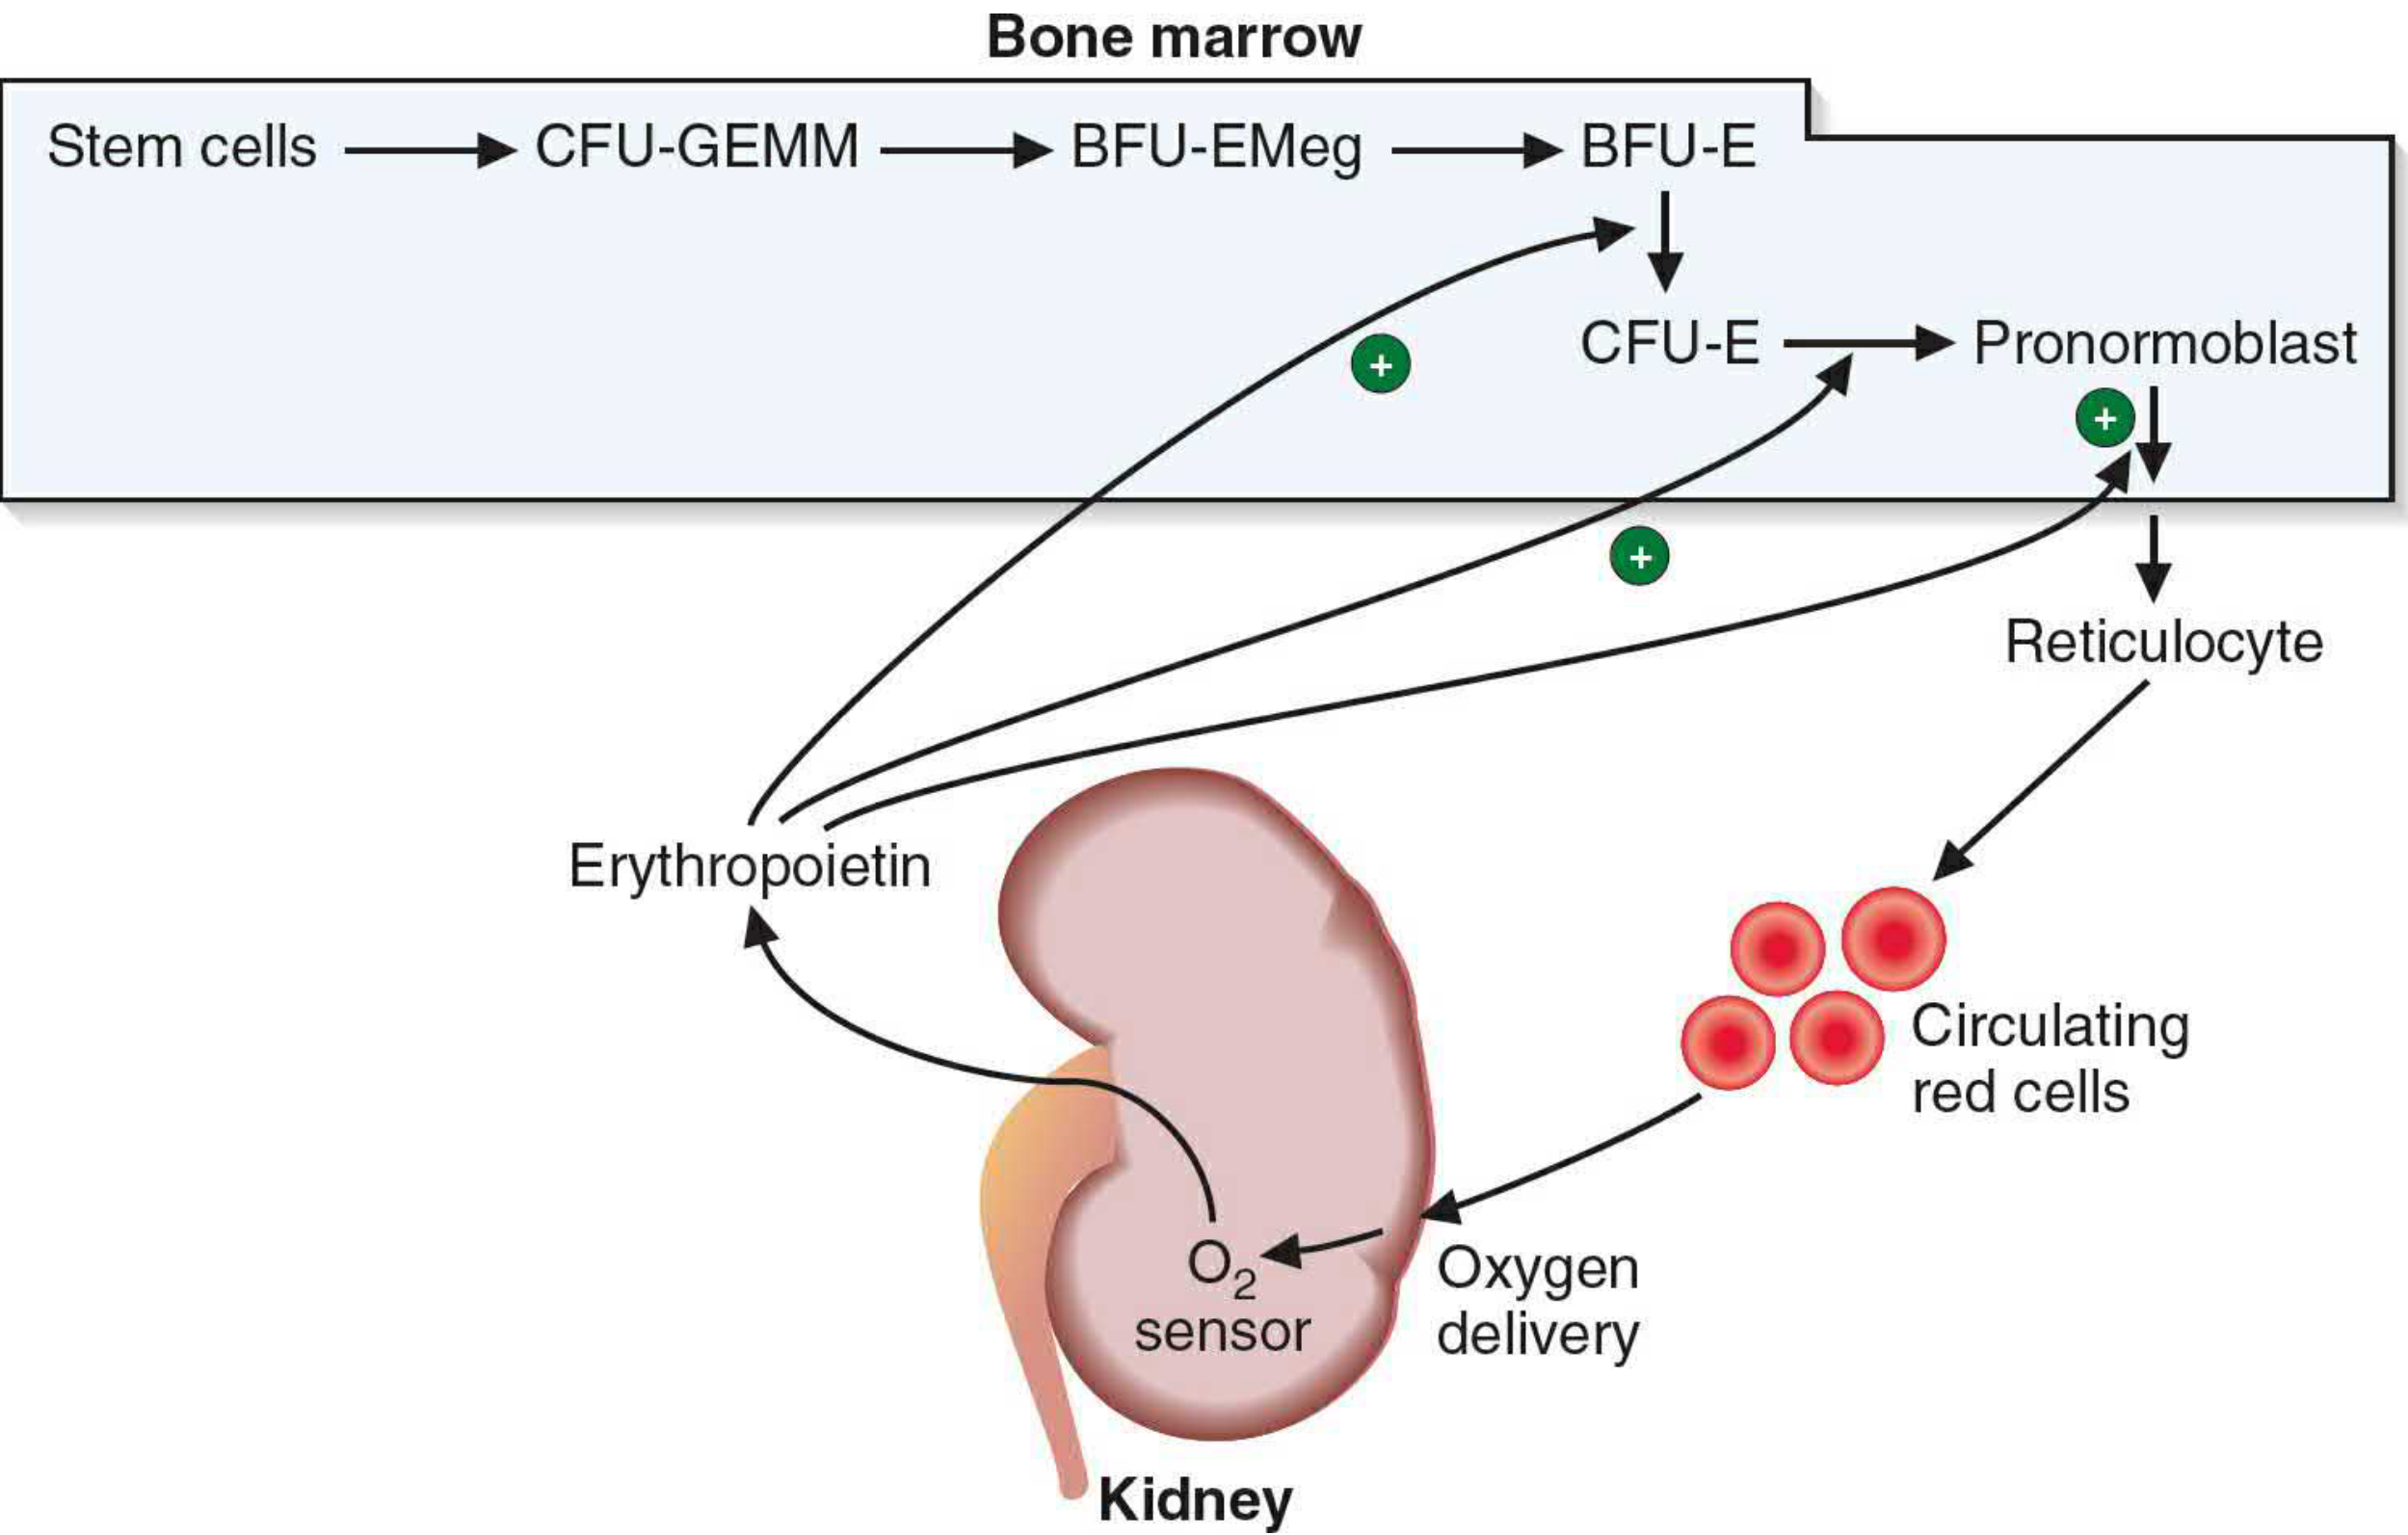
- CFU-GEMM (colony-forming unit - granulocyte, erythroid, monocyte, megakaryocyte): the mixed myeloid progenitor
- BFU-E (burst-forming unit - erythroid): EPO-responsive; less sensitive than CFU-E; forms large colonies
- CFU-E (colony-forming unit - erythroid): highly sensitive to EPO; forms small, tight colonies
3. Morphological Stages (Normoblastic Maturation)
1. Pronormoblast (Proerythroblast)
- Largest erythroid precursor (~20 µm diameter)
- Large nucleus with fine, uniform chromatin; one or more prominent nucleoli
- Moderate basophilic cytoplasm (rich in RNA); no granules
- Undergoes mitosis → 2 basophilic normoblasts
2. Basophilic Normoblast (Basophil Erythroblast)
- Smaller than pronormoblast
- Intensely stained, coarser chromatin; nucleoli not visible
- Deeply basophilic cytoplasm due to abundant RNA (polyribosomes)
- Irregular cell borders from pseudopodia
- Undergoes mitosis → polychromatophilic normoblasts
3. Polychromatophilic Normoblast (Polychromasia stage)
- Evidence of hemoglobin production begins - cytoplasm shows mixed blue (RNA) and red (hemoglobin) staining ("polychromasia")
- Nucleus occupies ~half the cell area; moderately condensed chromatin
- Undergoes 1-2 more mitotic divisions
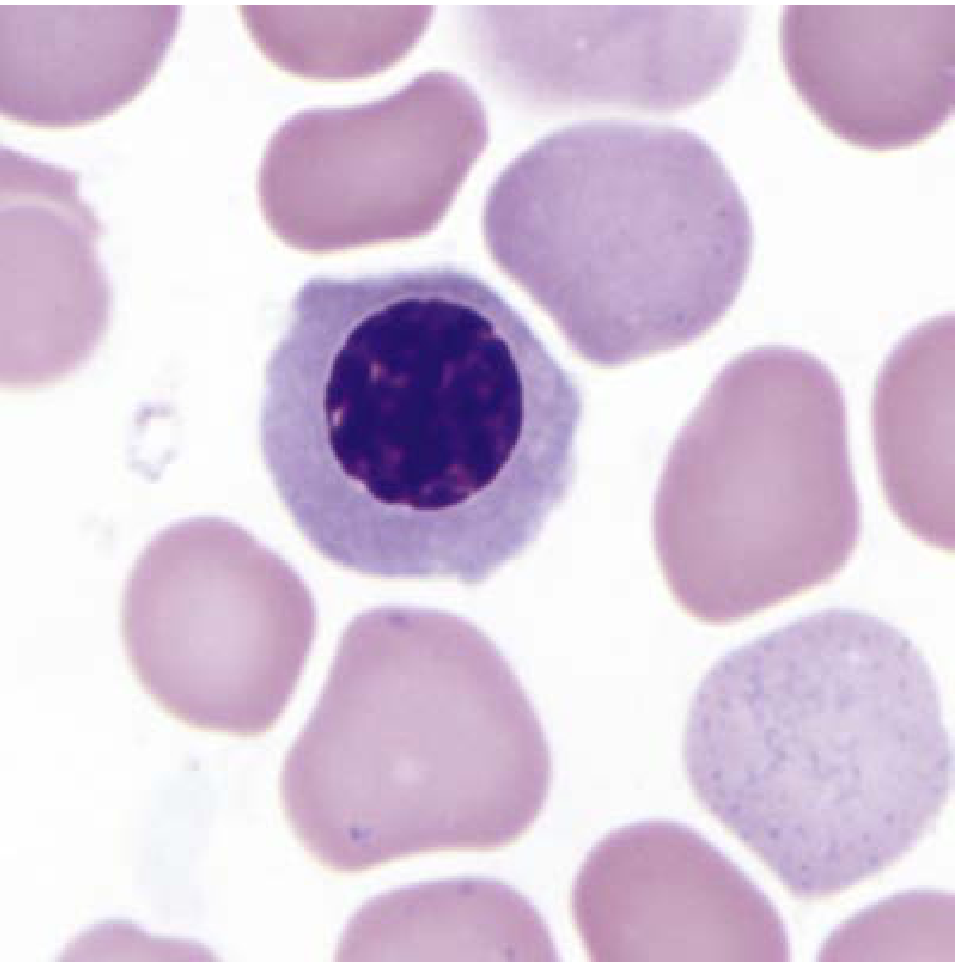
4. Orthochromatic Normoblast (Acidophilic Erythroblast)
- Nucleus becomes small and pyknotic (dense, no longer capable of mitosis)
- Cytoplasm is pink-gray with abundant hemoglobin and few remaining polyribosomes
- Nucleus is ejected (along with a small rim of cytoplasm) along with macrophage assistance → reticulocyte is born
5. Reticulocyte
- Anucleate but retains residual organelles: ribosomes, remnants of Golgi apparatus, mitochondria
- Still capable of hemoglobin synthesis (mRNA stable for ~2 days)
- Enters the circulation by diapedesis through capillary pores
- Circulates for 1-2 days; matures in the spleen where ribosomes and mRNA are lost
- Normal reticulocyte count in peripheral blood: <1% of RBCs
6. Mature Erythrocyte
- Biconcave disc (~7-8 µm), ~34% hemoglobin content
- No nucleus, no organelles
- Lifespan: 120 days; destroyed primarily by macrophages of the reticuloendothelial system (spleen, liver, bone marrow)
4. Regulation by Erythropoietin (EPO)
The Feedback Loop
- Decreased tissue oxygenation (anemia, hypoxia, high altitude, cardiopulmonary disease) is sensed by the kidney
- Hypoxia-inducible factor (HIF) - specifically HIF-1α/HIF-2α - accumulates in renal fibroblasts (normally degraded by prolyl hydroxylases under normoxic conditions)
- HIF acts as a transcription factor, upregulating EPO gene expression
- EPO is secreted into circulation and acts on EPO receptors (EPO-R) on erythroid progenitors (especially CFU-E and pronormoblasts)
- EPO promotes proliferation, differentiation, and survival (anti-apoptotic) of erythroid progenitors
- RBC mass rises → oxygen delivery improves → HIF degradation resumes → EPO falls (negative feedback)
5. Nutritional Requirements for Erythropoiesis
| Nutrient | Role | Deficiency Consequence |
|---|---|---|
| Iron | Heme synthesis (protoporphyrin + Fe²⁺ by ferrochelatase) | Microcytic, hypochromic anemia |
| Vitamin B12 | DNA synthesis (cofactor for thymidine synthesis) | Megaloblastic anemia |
| Folic acid | DNA synthesis (one-carbon transfer) | Megaloblastic anemia |
| Vitamin B6 | ALA synthase cofactor (first step of heme synthesis) | Sideroblastic anemia |
| Copper | Iron mobilization from stores | Anemia |
| Vitamin C | Ferric → ferrous iron reduction; enhances absorption | Impaired iron absorption |
Heme Synthesis (Brief)
- Succinyl-CoA + Glycine → δ-ALA (by ALA synthase, rate-limiting step, in mitochondria)
- ALA → porphobilinogen (by ALA dehydrase)
- 4× porphobilinogen → uroporphyrinogen III → coproporphyrinogen III → protoporphyrin IX
- Protoporphyrin IX + Fe²⁺ → Heme (by ferrochelatase)
- Heme inhibits ALA synthase (negative feedback) and promotes globin synthesis
6. Kinetics Summary
| Parameter | Value |
|---|---|
| RBCs produced per second | ~2.5-3.0 million |
| RBCs replaced per day | ~250 billion (1% of total) |
| Reticulocyte transit time in blood | 1-2 days |
| Mature RBC lifespan | 120 days |
| Normal reticulocyte count | <1% of RBCs |
7. Effective vs. Ineffective Erythropoiesis
- Effective erythropoiesis: production of RBCs that successfully reach the circulation and deliver hemoglobin
- Ineffective erythropoiesis: intramedullary destruction of erythroid precursors before they reach maturity (e.g., in β-thalassemia, megaloblastic anemia, myelodysplastic syndrome)
- Causes iron overload despite anemia (increased iron absorption driven by ongoing but futile erythropoietic drive)
- In β-thalassemia, unpaired α-globin chains form aggregates that damage precursors
Sources
- Basic Medical Biochemistry: A Clinical Approach, 6e - Erythropoietin stimulation pathway (Fig. 42.13)
- Henry's Clinical Diagnosis and Management by Laboratory Methods - Normoblastic maturation, heme and globin synthesis
- Histology: A Text and Atlas with Correlated Cell and Molecular Biology - Erythrocyte development stages
- Guyton and Hall Textbook of Medical Physiology - Stages of RBC differentiation, EPO regulation
- Brenner and Rector's The Kidney, 2-Volume Set - EPO biology and feedback
- Goodman & Gilman's Pharmacological Basis of Therapeutics - HIF pathway and EPO pharmacology