
How to know if pain is coming from bone muscle tendon ligament with treatment
how to differentiate bone muscle tendon ligament pain clinical assessment treatment
musculoskeletal pain anatomy diagram bone muscle tendon ligament
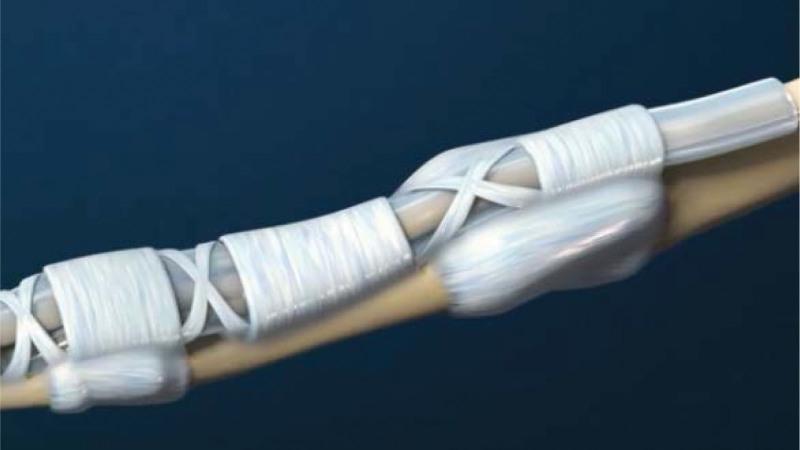
Anatomical diagram depicting the normal musculoskeletal structure of a human finger digit, specifically focusing on the flexor tendon and its pulley system. The illustration shows a tan-colored cylindrical phalangeal bone as the foundation. Overlaid on the bone and underlying tendon is a series of white, fibrous bands representing the annular (A) and cruciform (C) pulleys. The annular pulleys appear as dense, circular transverse bands (like the A1, A2, and A3 pulleys), while the cruciform pulleys are shown as thinner, crisscrossing diagonal bands that allow for flexibility during finger flexion. A smooth, glistening tendon is visible beneath these ligamentous sheaths. The diagram illustrates the osteofibrous canal, which serves to keep the flexor tendons closely apposed to the bone, preventing 'bowstringing' and facilitating efficient mechanical finger movement. This visual is relevant for understanding hand anatomy, tenosynovitis pathology, and surgical or acupotomy interventions for trigger finger.
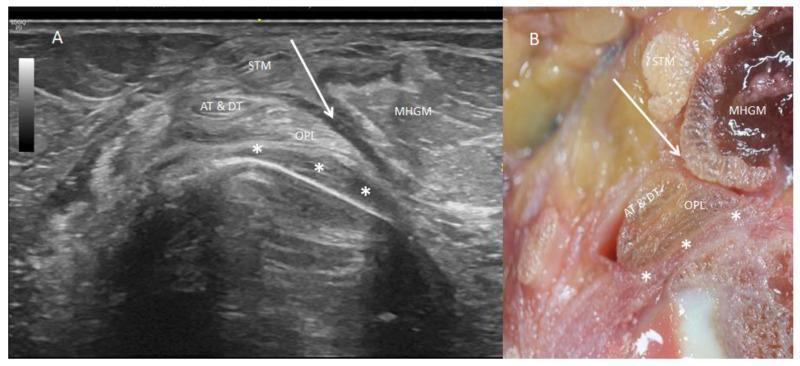
This dual-panel image provides a side-by-side comparison of the musculoskeletal anatomy of the posterior knee, specifically the semimembranosus tendon complex. Panel A is a short-axis ultrasound image demonstrating the oblique popliteal ligament (OPL) as a long, hyperechogenic band with parallel fibers. It is situated deep to the medial head of the gastrocnemius muscle (MHGM) and is in close proximity to the posterior knee capsule (indicated by white asterisks). Superior and posterior to the OPL are the anterior and direct tendons (AT & DT) of the semimembranosus muscle (STM). A hypoechoic bursa is visible between these tendinous structures and the MHGM (indicated by a white arrow). Panel B presents a corresponding transverse anatomical cross-section, confirming the spatial relationships. The STM and MHGM appear superficially, while the AT, DT, and OPL are positioned deeper toward the joint capsule. These visuals are intended for medical education regarding the complex distal insertions of the semimembranosus muscle and its role in reinforcing the posterior capsule of the knee joint.
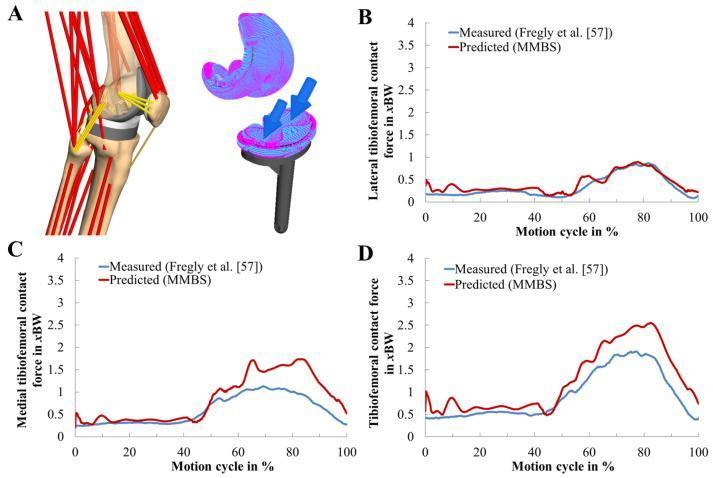
This composite image illustrates a musculoskeletal multibody simulation (MMBS) of the knee joint following Total Knee Replacement (TKR). Panel A shows a 3D anatomical diagram of the right knee during a squat motion, featuring bone geometries (femur, tibia, patella) with implanted TKR components. Red lines represent muscle-tendon units and nonlinear ligament force elements, while yellow lines denote secondary ligamentous structures. To the right, a detailed view of the prosthetic contact surfaces shows force vectors (blue arrows). Panels B, C, and D are comparison line graphs validating the model by comparing in vivo 'Measured' (blue line) versus 'Predicted' (red line) tibiofemoral contact forces across a 0-100% motion cycle. Forces are quantified in units of body weight (xBW). Specifically, Panel B shows lateral contact force, Panel C shows medial contact force, and Panel D displays the total tibiofemoral contact force. The graphs demonstrate high model fidelity in the lateral compartment, with moderate overestimation in the medial and total force predictions during the 50-90% phase of the squat motion cycle.
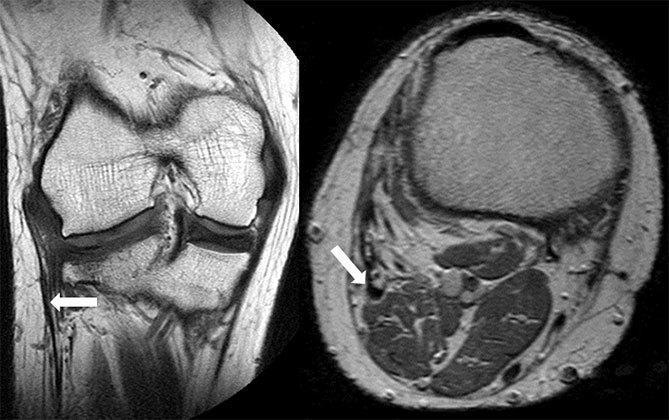
Diagnostic Magnetic Resonance Imaging (MRI) demonstrating anomalous musculoskeletal anatomy of the knee and calf in a patient with fibular hemimelia. The image consists of two panels: a coronal proton density (PD) view and an axial PD view. In the coronal image (left), the femur and tibia are visible, but there is a notable absence of the proximal fibula. An arrow indicates an anomalous conjoint tendon (formed by the lateral collateral ligament and biceps femoris) that, instead of inserting onto a fibular head, extends distally into the soft tissues of the lateral calf. The axial image (right) provides a cross-sectional view of the proximal calf, where an arrow highlights the same anomalous tendon situated between the lateral gastrocnemius, popliteus, and peroneal muscle groups. The tendon exhibits an intermediate signal intensity and an ovoid morphology in cross-section. This case illustrates the soft tissue compensations and structural variations associated with congenital long bone deficiencies.
How to Tell If Pain Is Coming From Bone, Muscle, Tendon, or Ligament - and How to Treat It
1. Bone Pain
How It Feels
- Deep, boring, or aching pain that persists at rest - this is the hallmark
- Does NOT go away with immobilization the way soft tissue pain does
- Often worse at night and independent of movement
- Can be diffuse or localized over a bony area
Key Clues
- Direct tenderness over bone on palpation (e.g., pressing directly on the tibia or a rib causes pain)
- Point tenderness over a specific bony site after trauma suggests fracture
- No relief with stretching or massaging the area
- Pain reproduced by axial loading (pressing along the axis of the bone)
- In children: localized bone pain + fever = rule out osteomyelitis
Causes
- Fracture (acute trauma)
- Stress fracture (repetitive loading - pain during and after activity)
- Bone infection (osteomyelitis)
- Bone tumors or metastases (night pain, no trauma history)
- Metabolic bone disease (osteoporosis, Paget's disease)
Investigations
- X-ray (first line, but misses stress fractures early)
- MRI - best for occult fractures, bone marrow involvement
- Bone scan - sensitive for stress fractures and metastases
Treatment
| Cause | Treatment |
|---|---|
| Fracture | Immobilization, casting, surgery if displaced |
| Stress fracture | Rest, activity modification, protected weight-bearing |
| Bone pain (general) | NSAIDs (naproxen, ibuprofen, celecoxib); steroids (dexamethasone) as adjuvants |
| Infection | IV/oral antibiotics; surgical debridement if needed |
From Textbook of Family Medicine 9e: "NSAIDs are quite helpful in alleviating pain from lesions in bones or skeletal muscles. The COX-2 inhibitor celecoxib offers comparable analgesia with less GI toxicity."
2. Muscle Pain (Strain)
How It Feels
- Diffuse, dull ache spread over a broader area - not pinpoint
- Pain is worse with active use (when you contract or use the muscle)
- Typically does NOT hurt with passive movement (when someone else moves your limb without you engaging the muscle)
- Tender over the belly of the muscle, not at the joint
- Often "tight" or crampy sensation
Key Clues
- Pain increases when the muscle is contracted against resistance
- Stretching the muscle reproduces or worsens pain
- Palpation of the muscle belly causes tenderness (not joint line)
- Ecchymosis (bruising) and swelling in moderate-severe tears
- A "pop" felt at time of injury suggests tear
Grading of Muscle Strains
- Grade 1: Minor tearing - minor swelling, local tenderness, minimal restriction
- Grade 2: More tearing, no complete disruption - swelling, ecchymosis, loss of strength
- Grade 3: Complete disruption - separation of muscle from tendon or bone, severe weakness
Causes
- Sudden forceful contraction or excessive stretch ("pulled muscle")
- Overuse, fatigue
- Direct trauma (contusion)
Investigations
- Clinical diagnosis usually sufficient
- Ultrasound or MRI for grade 2-3 tears to assess extent
Treatment
| Stage | Treatment |
|---|---|
| Acute (0-72 hrs) | PRICE: Protection, Rest, Ice (15-20 min every 2 hrs), Compression, Elevation |
| Sub-acute | Gentle range-of-motion exercises, progressive loading |
| NSAIDs | Ibuprofen, naproxen for 5-7 days for analgesia and swelling |
| Grade 3 tears | Surgical repair may be required |
| Rehabilitation | Physical therapy, eccentric strengthening, return-to-sport protocol |
3. Tendon Pain (Tendinitis / Tendinopathy)
How It Feels
- Pinpoint, sharp or burning pain localized directly over the tendon (not diffuse)
- Pain is felt where the muscle meets the bone (at the tendon insertion)
- "Tennis elbow" hurts at the lateral epicondyle - that spot where the muscle inserts
- Burning sensation is the classic descriptor
- Worsens with activity, improves initially with warm-up ("warm-up phenomenon")
Key Clues
- Resisted movement reproduces the pain - hold the limb still and ask patient to push against you (resisted contraction)
- Pain is at the end range of stretch (when the tendon is maximally loaded)
- Direct palpation exactly over the tendon reproduces pinpoint pain
- No significant joint instability
Common Sites
- Shoulder rotator cuff, Achilles tendon, patellar tendon (jumper's knee), lateral epicondyle (tennis elbow), medial epicondyle (golfer's elbow), de Quervain's (thumb side of wrist), posterior tibial tendon
Causes
Investigations
- X-ray: usually negative; may show calcium deposits (calcific tendinitis)
- Ultrasound: excellent for tendon thickening, tears, calcification
- MRI: for partial/full tears
Treatment
| Approach | Details |
|---|---|
| Initial | Rest, ice, NSAIDs (brief course for analgesia) |
| Physical therapy | Eccentric loading exercises - the gold standard for chronic tendinopathy |
| Corticosteroid injection | Peritendinous injection - useful for calcific tendinitis; avoid direct injection into Achilles (risk of rupture) |
| Extracorporeal Shockwave | Good evidence for calcific tendinitis and chronic tendinopathy |
| Surgery | Arthroscopic/open for calcific tendinitis not responding to conservative therapy |
Per Rosen's: "NSAIDs may be useful for a brief period as an analgesic but have not been demonstrated to significantly alter the pathophysiology."
4. Ligament Pain (Sprain)
How It Feels
- Localized to a joint, often with immediate sharp pain at time of injury
- Instability or "giving way" sensation at the joint
- Swelling develops around the joint (not over a muscle belly)
- Pain with passive movement (someone else moving your joint) - this is the key differentiator from muscle pain
- Pain at the end of joint range of motion
Key Clues
- Pain is reproduced by stressing the ligament - valgus/varus stress tests for the knee, anterior drawer for the ankle
- Joint line tenderness rather than bone or muscle belly tenderness
- History of twisting, rolling, or sudden direction change
- Hemarthrosis (blood in the joint) suggests significant ligamentous injury, especially ACL tear
- Passive range of motion reproduces pain even without muscle activation
Grading of Sprains (Ligament)
- Grade 1: Ligament stretched, not torn - mild tenderness, minimal swelling, no instability
- Grade 2: Partial tear - moderate swelling, tenderness, some instability
- Grade 3: Complete tear - marked swelling, significant instability, loss of function
Investigations
- X-ray: rules out associated avulsion fracture
- MRI: best for confirming degree of ligamentous tear, especially knee (ACL, MCL, PCL)
- Note: In children, epiphyseal fractures are MORE common than ligament tears
Treatment
| Grade | Treatment |
|---|---|
| Grade 1 | RICE (Rest, Ice, Compression, Elevation) + NSAIDs, early mobilization |
| Grade 2 | Immobilization 48-72 hrs, then early mobilization with protection; NSAIDs; physical therapy |
| Grade 3 | Orthopedic referral within 5-7 days; surgical repair for some (e.g., ACL in young active patients) |
| Rehabilitation | Proprioceptive training, gradual return to activity |
Per Rosen's: "Ligaments are relatively avascular, healing is slow, and patients with significant sprains should be informed of this. Sprains should not be trivialized."
Quick Comparison Table
| Feature | Bone | Muscle | Tendon | Ligament |
|---|---|---|---|---|
| Pain location | Over bone | Muscle belly | At tendon insertion (muscle-bone junction) | Around joint |
| Pain quality | Deep, boring, constant | Diffuse ache, cramp | Pinpoint, sharp/burning | Sharp, localized to joint |
| Pain at rest | Yes (especially night) | Mild | Mild | Mild-moderate |
| Active movement | Varies | Worsens significantly | Worsens | Worsens |
| Passive movement | Varies | Minimal change | May worsen at end range | Worsens (key finding) |
| Resisted movement | Minimal change | Worsens | Worsens (characteristic) | Minimal change |
| Palpation | Direct bony tenderness | Tender over muscle belly | Pinpoint over tendon | Joint line tenderness |
| Instability | With fracture | No | No | Yes (with Grade 2-3) |
| Swelling | Localized | Diffuse over muscle | Over tendon | Around joint |
Red Flags - See a Doctor Immediately
- Bone pain after trauma with inability to bear weight (possible fracture)
- Bone pain without injury + night pain + weight loss (rule out tumor or metastases)
- Severe swelling, immediate bruising, complete loss of function (Grade 3 tear)
- A palpable gap or "pop" heard at time of injury
- Joint hemarthrosis (knee filled with blood after injury - possible ACL tear)
- Fever with bone or joint pain (infection)
- Children with bone pain + fever (osteomyelitis)
Osteoarthritis vs osteoporosis complete with treatment complete
osteoarthritis X-ray joint space narrowing osteophytes
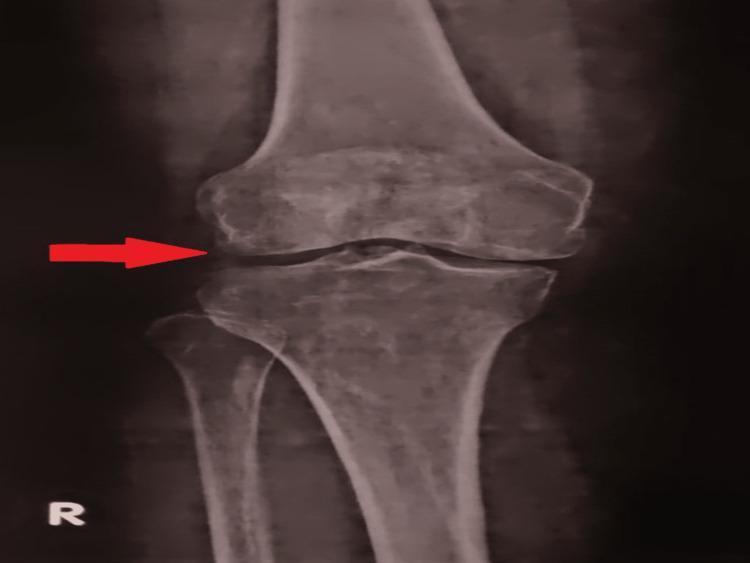
This diagnostic image is an anteroposterior (AP) X-ray of the right knee joint, demonstrating radiographic features consistent with early-stage osteoarthritis. The visual highlights a moderate narrowing of the tibiofemoral joint space, particularly noted in the medial compartment, which is indicated by a red horizontal arrow. Key pathological findings include the presence of small, irregular bony projections or osteophytes along the margins of the femoral condyles and the tibial plateau. The cortical bone appears generally intact but displays increased radio-opacity (subchondral sclerosis) in areas adjacent to the narrowed joint space. This clinical photograph serves as an educational tool for identifying Kellgren-Lawrence Grade 1 or 2 degenerative joint disease, illustrating the hallmark features of chronic joint wear, including joint space loss and marginal spurring in an adult patient. The image is relevant for orthopedic and rheumatological studies focusing on diagnostic imaging of musculoskeletal conditions.
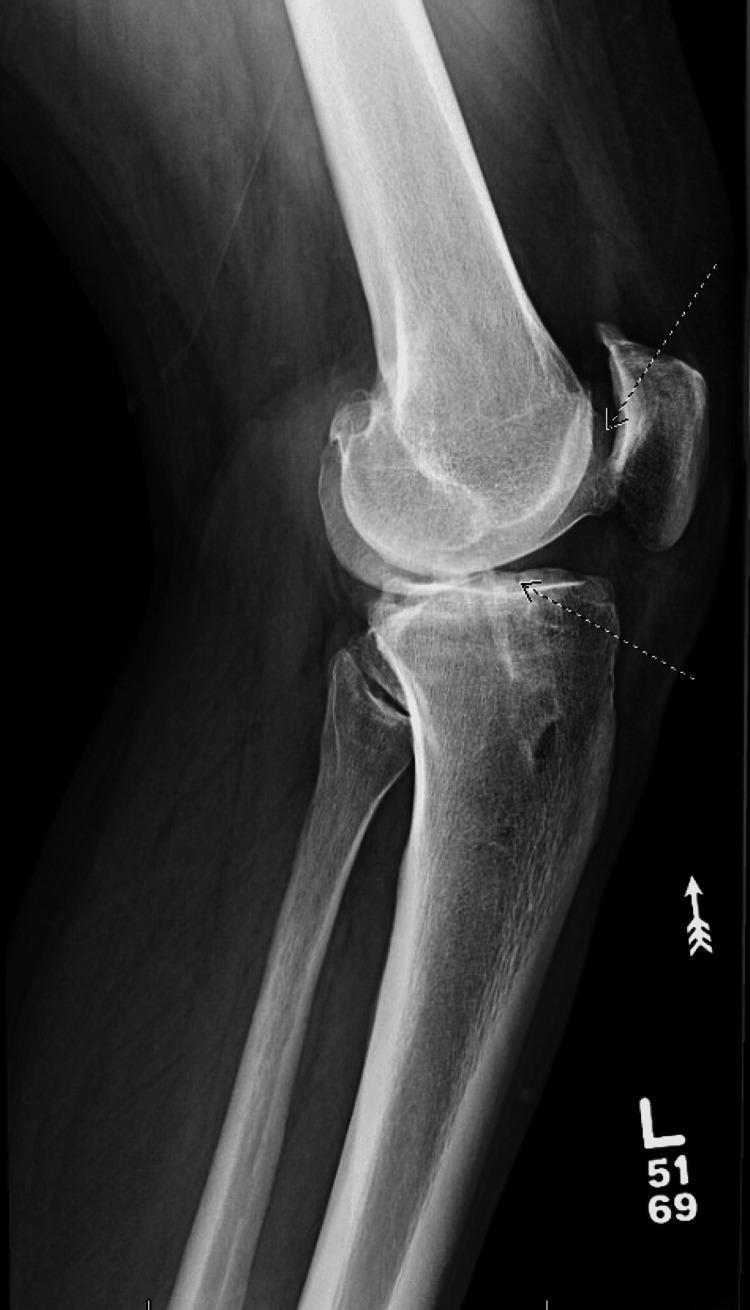
This lateral view X-ray of the left knee displays significant degenerative joint disease, characteristic of advanced osteoarthritis. The diagnostic image reveals diffuse joint space narrowing between the femoral condyles and the tibial plateau, particularly evident in the tibiofemoral and patellofemoral compartments. Bony outgrowths, or osteophytes, are clearly visible along the posterior and superior margins of the patella and the anterior aspect of the tibial plateau, as indicated by the dotted annotation arrows. Subchondral sclerosis is present, reflecting a response to increased stress from cartilage loss. Additionally, visible in the proximal tibia and distal femur are radiolucent areas corresponding to surgical tunnels from a previous anterior cruciate ligament (ACL) reconstruction. The image serves as an educational example of secondary osteoarthritis resulting from prior intra-articular injury and surgical intervention, demonstrating the classical radiographic hallmarks used in clinical staging and preoperative planning for revision surgery.
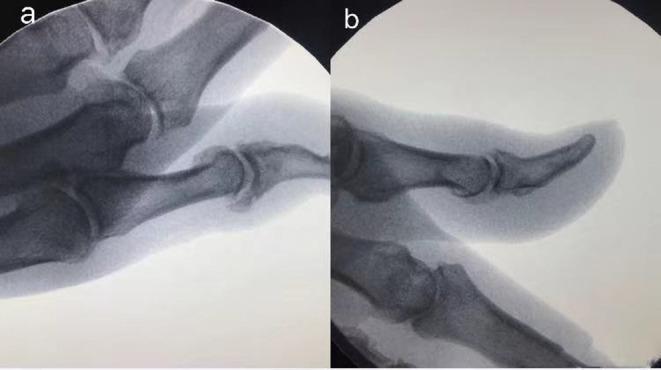
This diagnostic comparison contains two lateral X-ray views of the thumb distal interphalangeal (DIP) joint, demonstrating the surgical management of osteoarthritis. Image (a) represents the pre-operative state, showing significant dorsal osteophyte formation at the DIP joint. These osteophytes appear as radiopaque, irregular bony protrusions along the joint margin, accompanied by joint space narrowing characteristic of advanced degenerative arthritis. Image (b) shows the post-operative result three months following surgical intervention. The previously noted osteophytes have been removed, resulting in a significantly smoother and more regular cortical contour of the distal and middle phalanges at the articulation site. The clinical focus of this visual is to illustrate successful surgical debridement of hypertrophic bone in the context of symptomatic hand arthritis. The imaging facilitates education on identifying radiological signs of osteoarthritis (osteophytosis and joint space loss) and assessing post-surgical anatomical remodeling.
osteoporosis bone density DEXA scan fracture
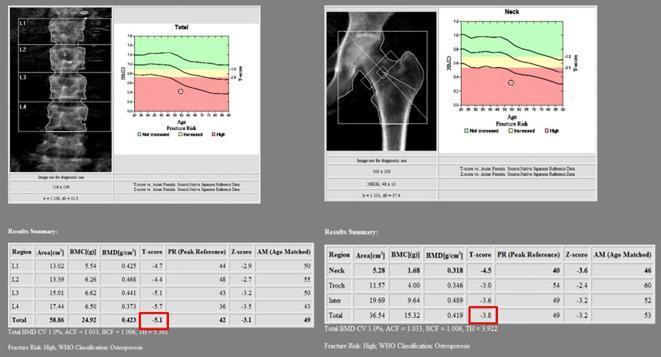
Dual-energy X-ray absorptiometry (DEXA) scan report presenting bone mineral density (BMD) analysis of the lumbar spine and proximal femur. The image is divided into two clinical diagnostic panels. The left panel shows the lumbar spine (L1–L4) with segmented vertebral regions, an associated fracture risk graph plotting BMD against age, and a quantitative 'Results Summary' table. The highlighted total T-score of -5.1 for the lumbar spine is significantly below the -2.5 threshold, indicating severe osteoporosis. The right panel displays the proximal femur (hip) with demarcated regions for the femoral neck, trochanter, and intertrochanteric area. Its corresponding fracture risk graph shows a data point deep within the red 'High Risk' zone. The summary table for the femur highlights a total T-score of -3.8, confirming a diagnosis of osteoporosis. Both panels include Z-scores, peak reference percentages (PR), and age-matched percentages (AM). This comparison chart illustrates diagnostic imaging and metabolic bone disease assessment for clinical education on osteoporosis classification and fracture risk stratification.
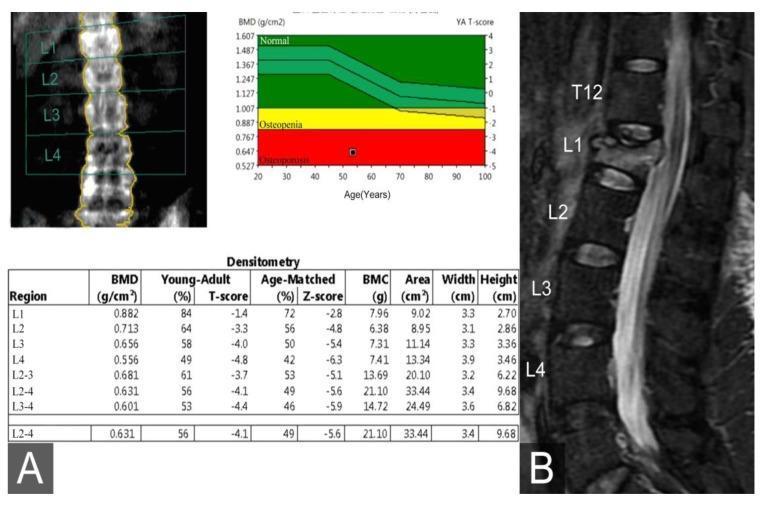
Educational medical composite image illustrating diagnostic findings of osteoporosis and an associated vertebral compression fracture. Panel A displays a Dual-Energy X-ray Absorptiometry (DEXA) report including a coronal lumbar spine scan (L1-L4), a densitometry table showing a critical T-score of -4.8 at L4, and a corresponding bone mineral density (BMD) graph. The graph plots BMD (g/cm²) against age, with color-coded reference ranges: green for normal, yellow for osteopenia, and red for osteoporosis; the patient's data point falls significantly within the osteoporosis range. Panel B presents a sagittal view MRI of the lumbar spine using a Short Tau Inversion Recovery (STIR) sequence. The MRI reveals a wedge-shaped deformity and hyperintense signal at the L1 vertebral body, characteristic of bone marrow edema from an acute osteoporotic compression fracture. Normal rectangular morphology is maintained in T12 and L2-L4. This visual set demonstrates the correlation between quantitative bone density measurements and clinical pathology in geriatric orthopedics.
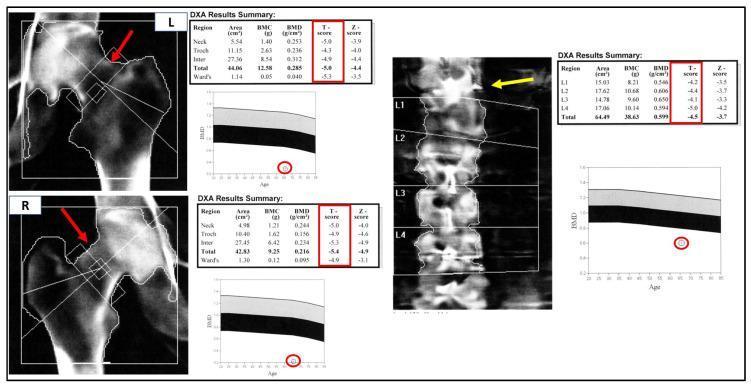
This diagnostic composite displays a Dual-Energy X-ray Absorptiometry (DEXA) scan evaluating bone mineral density (BMD) in the bilateral hips and lumbar spine. The hip panels (left, L; right, R) include red arrows highlighting a noticeable shortening of the left femoral neck compared to the right, suggestive of a closed fracture or structural deformity. Associated DXA summary tables for both hips indicate severe osteoporosis, with T-scores ranging from -4.3 to -5.4 SD. The central panel depicts the lumbar spine (L1-L4), where a yellow arrow points to a distinct hyperdense area at the T12-L1 vertebral junction, concerning for an expansive lesion or abnormal bone formation. Corresponding spinal data tables show a total T-score of -4.5 SD. Accompanying BMD-vs-age graphs consistently place the patient's values (indicated by circled points) well below the osteoporotic threshold (black band). This visual record demonstrates the clinical application of DEXA in diagnosing oncogenic osteomalacia-related severe bone loss and identifying potential pathological fractures or focal spinal abnormalities.
THE CORE DISTINCTION
| Osteoarthritis (OA) | Osteoporosis | |
|---|---|---|
| What is affected | Articular cartilage + joint structures | Bone mass and density (whole skeleton) |
| Basic problem | Cartilage degeneration and failed repair | Bone resorption exceeds bone formation |
| Primary mechanism | Mechanical/biomechanical stress | Metabolic bone disease |
| Pain | Yes - joint pain, activity-related | Usually none until fracture occurs |
| Fracture risk | Not primary (unless secondary to deformity) | The main clinical danger |
| Systemic disease? | No | Yes (systemic bone loss) |
PART 1: OSTEOARTHRITIS (OA)
Definition
- Goldman-Cecil Medicine: "The resulting breakdown of cartilage and bone can lead to symptoms of pain, stiffness, and functional disability. However, synovial joint pathology and structural changes on imaging may correlate poorly with patient-reported symptoms."
Epidemiology
- Affects >50 million people worldwide; women disproportionately affected
- Prevalence rises exponentially after age 50; ~40% of people over 70 are affected
- Primary OA (idiopathic): appears without cause, as an aging phenomenon - oligoarticular, affecting weight-bearing joints
- Secondary OA (~5% of cases): occurs in younger people with joint deformity, prior injury, diabetes, or obesity
Pathogenesis
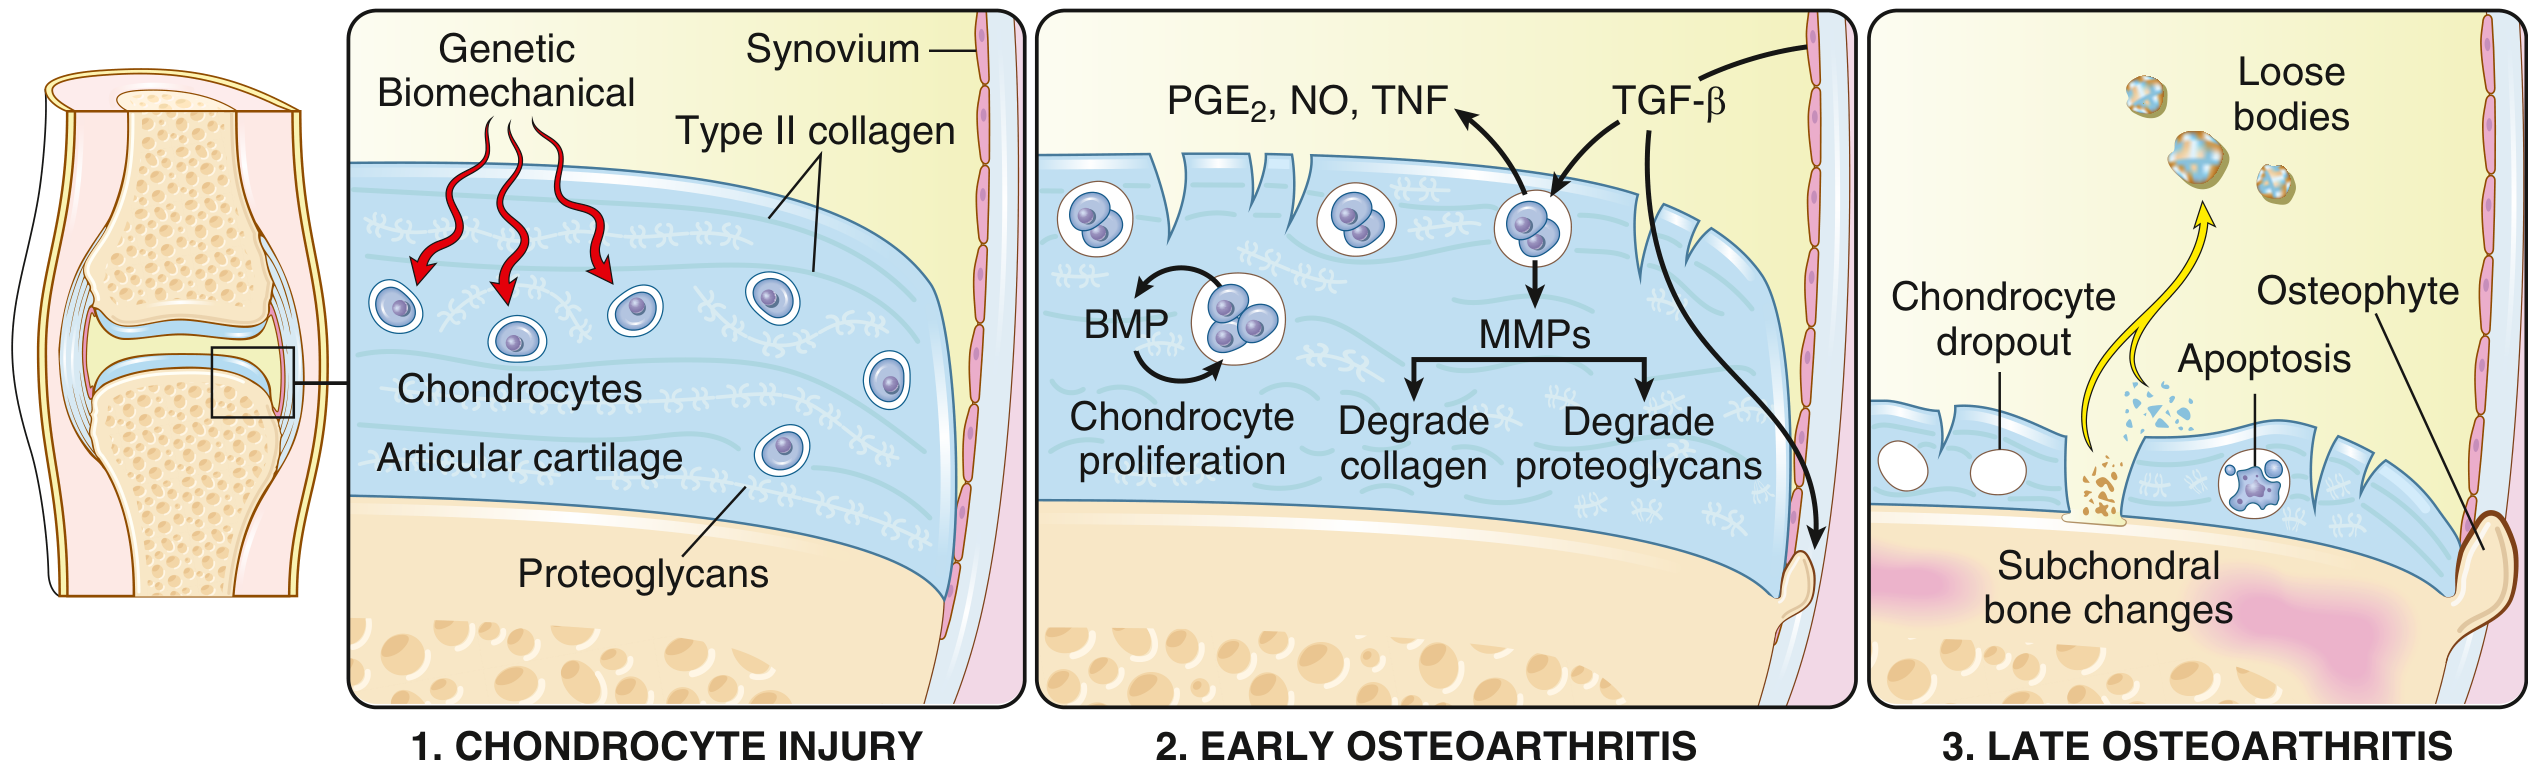
- Chondrocyte injury - mechanical/genetic insult damages chondrocytes and the extracellular matrix (Type II collagen, proteoglycans)
- Early OA - chondrocytes proliferate and attempt repair, releasing BMPs (bone morphogenetic proteins) for repair, but also MMPs (matrix metalloproteinases), PGE2, NO, and TNF that degrade collagen and proteoglycans faster than they can be repaired
- Late OA - chondrocyte dropout, apoptosis, full-thickness cartilage loss, subchondral bone damage, osteophyte formation, loose bodies ("joint mice")
Morphology / Pathology
| Feature | Description |
|---|---|
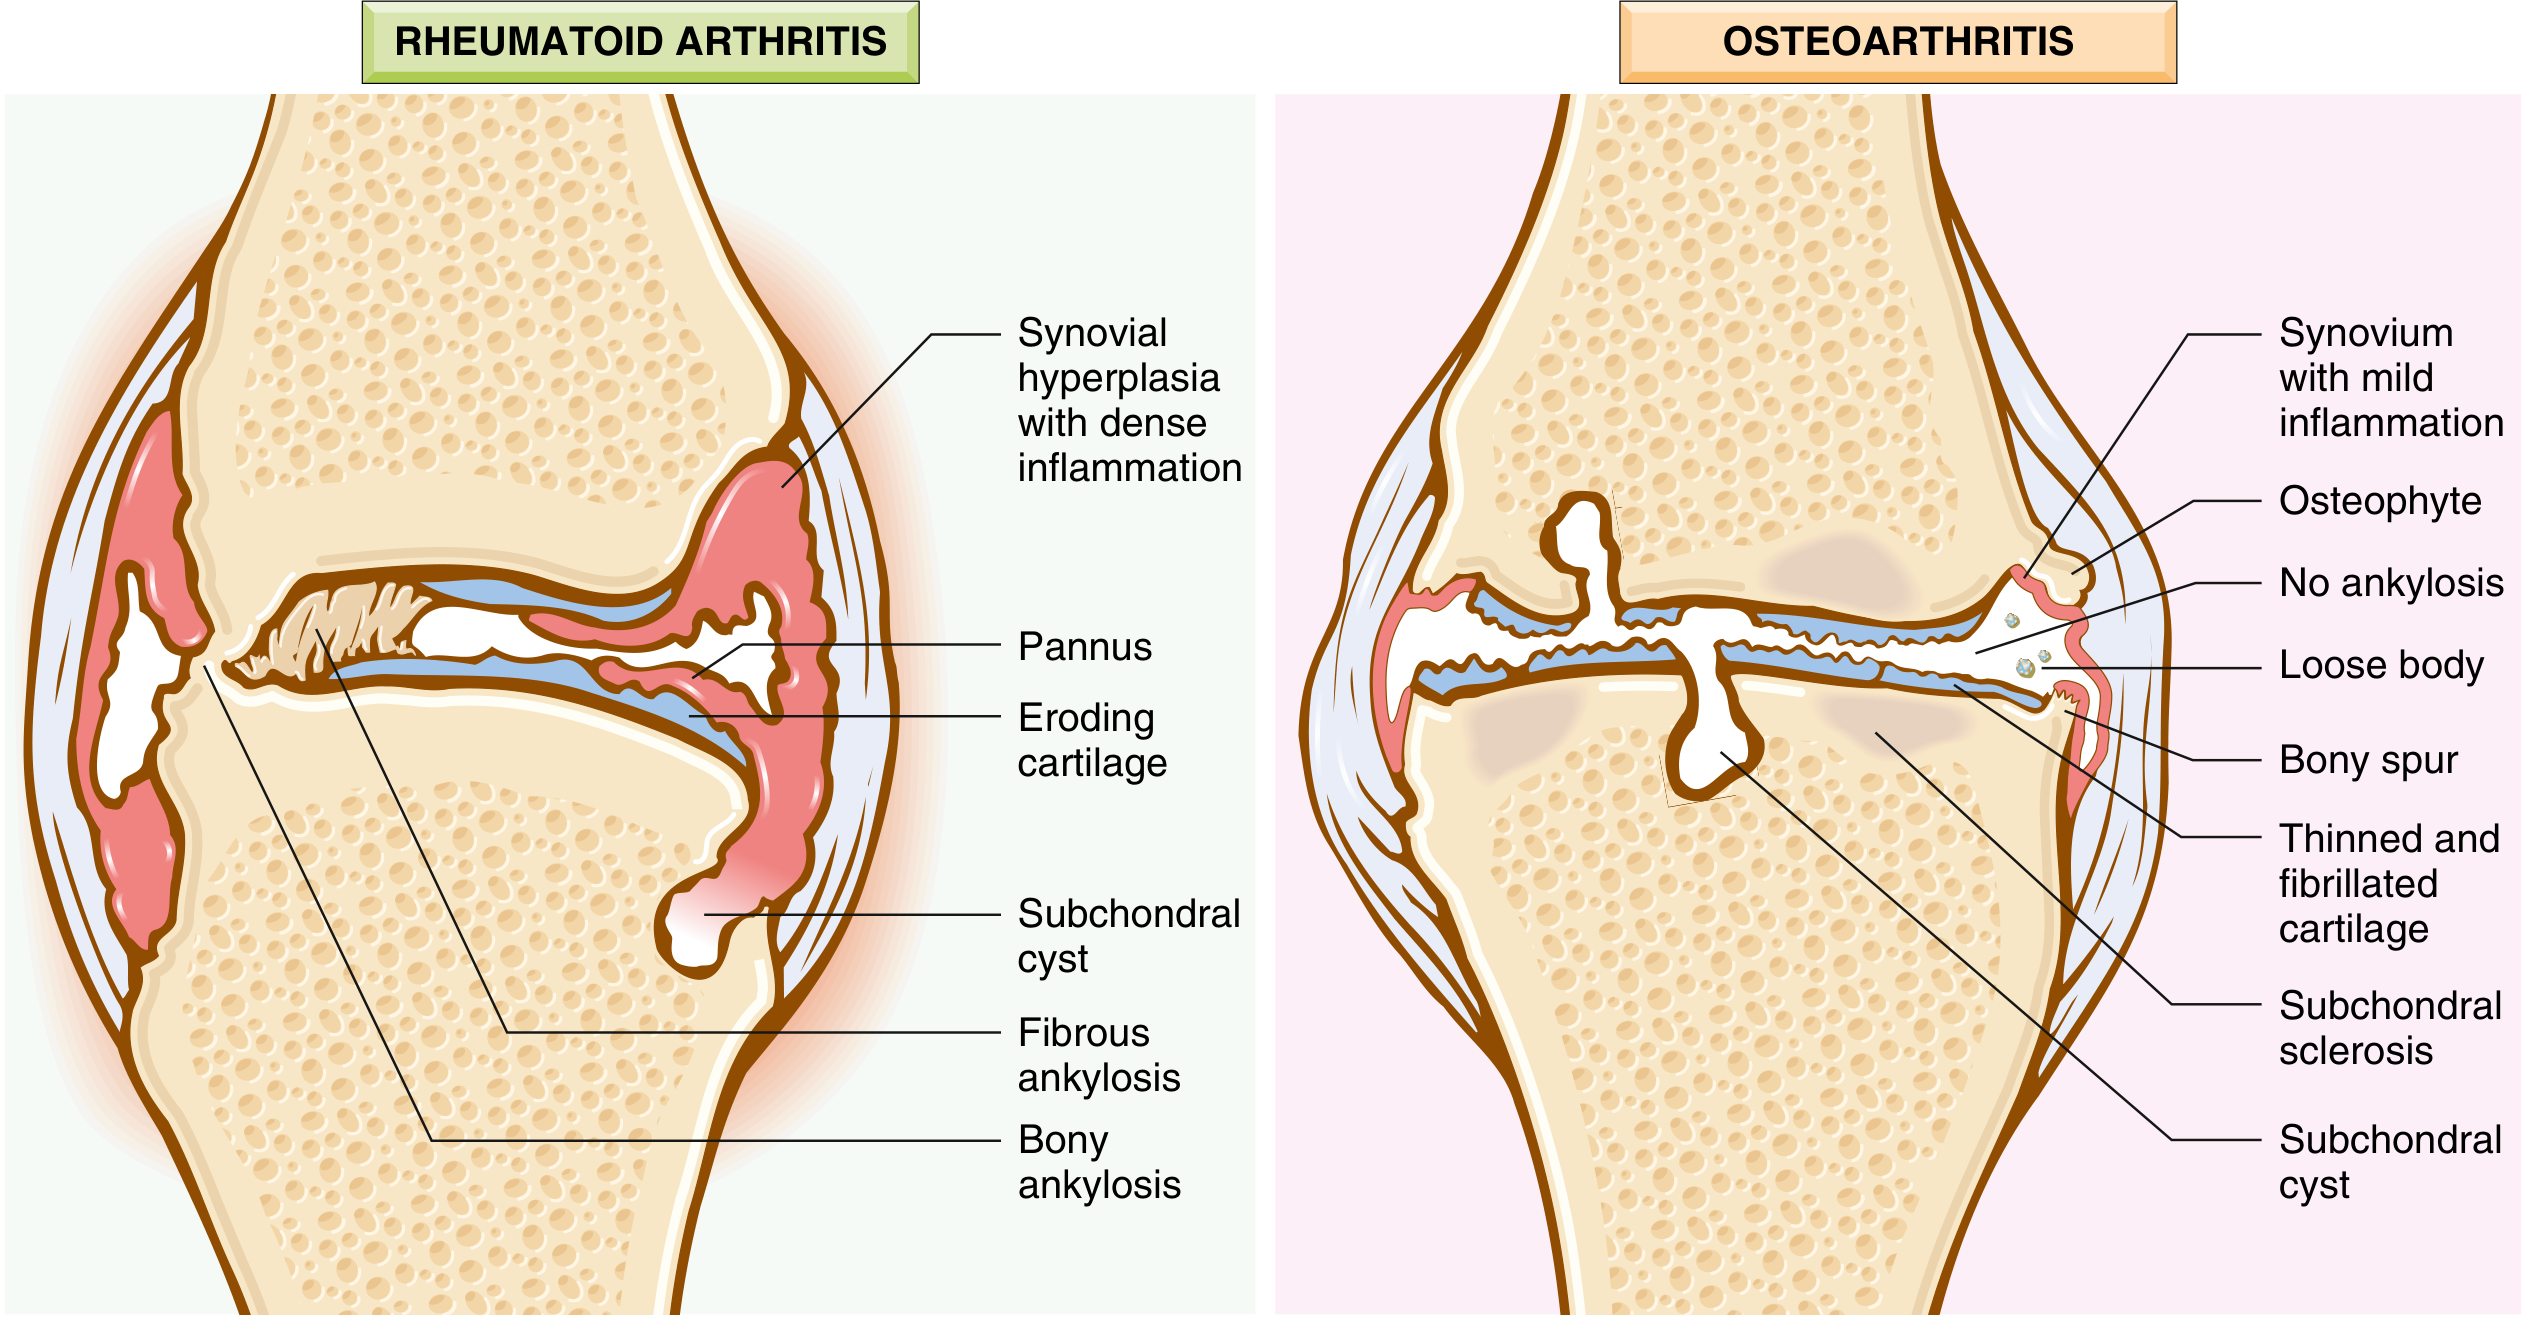
| Cartilage | Fibrillation, erosion, full-thickness sloughing |
| Subchondral bone | Eburnation (polished ivory appearance) from exposed bone friction |
| Subchondral cysts | Synovial fluid forced into bone via ball-valve mechanism |
| Osteophytes | Bony outgrowths at joint margins, capped by fibrocartilage |
| Loose bodies | Dislodged cartilage/bone fragments ("joint mice") |
| Synovium | Mildly congested and fibrotic; minimal inflammation (unlike RA) |
Clinical Features
- Joint pain - worsens with use, improves with rest (early) or persists at rest (late = "night pain" = surgical indication)
- Morning stiffness - brief, typically <30 minutes (unlike RA >1 hour)
- Crepitus - grinding or clicking with movement
- Limited range of motion
- Bony enlargement - osteophytes palpable at joint margins
- Heberden nodes (osteophytes at DIP joints) and Bouchard nodes (PIP joints) - more common in women
- No systemic features (no fever, no weight loss, no fatigue)
- Spinal OA: osteophytes compressing nerve roots cause radicular pain, muscle spasms, atrophy, neurological deficits
Joints Commonly Involved
- Hips, knees (weight-bearing - most symptomatic)
- Lower lumbar and cervical vertebrae
- DIP and PIP joints of fingers
- First carpometacarpal joint (base of thumb)
- First tarsometatarsal joint (base of big toe)
- NOT typically: wrists, MCPs, ankles (these suggest inflammatory arthritis)
Diagnosis
| Test | Finding in OA |
|---|---|
| X-ray | Joint space narrowing, osteophytes, subchondral sclerosis, subchondral cysts |
| Blood tests | Normal - no inflammatory markers, negative RF/ANA |
| ESR/CRP | Normal or mildly elevated |
| Synovial fluid | Non-inflammatory: WBC <2000/mm³, clear, viscous |
| MRI | Best for cartilage loss assessment, bone marrow changes |

Treatment of Osteoarthritis
Non-Pharmacological (First Line)
| Approach | Details |
|---|---|
| Weight loss | Most impactful - reduces load on knee by 4x the weight lost |
| Exercise | Low-impact aerobic (swimming, cycling), strengthening; reduces pain and improves function |
| Physical therapy | Quadriceps strengthening for knee OA, range-of-motion exercises |
| Walking aids | Stick in opposite hand offloads the affected hip/knee |
| Joint protection | Activity modification, avoiding high-impact activities |
| Heat/Cold | For symptomatic relief |
Pharmacological
| Drug | Role | Notes |
|---|---|---|
| Paracetamol (acetaminophen) | First-line analgesic | Safe, effective for mild-moderate pain; limited anti-inflammatory effect |
| Topical NSAIDs | First-line for knee/hand OA | Diclofenac gel - effective with lower systemic side effects |
| Oral NSAIDs (ibuprofen, naproxen, celecoxib) | For moderate pain | Reduce inflammation and pain; GI risk; COX-2 inhibitors have less GI toxicity |
| Duloxetine | Central pain modulation | SNRI; useful for widespread OA pain, especially with comorbid depression/anxiety |
| Intra-articular corticosteroids | For acute flares | Short-term relief; limit to 3-4 injections/year per joint |
| Intra-articular hyaluronic acid | Viscosupplementation | Evidence is mixed; may help some patients with knee OA |
| Tramadol / weak opioids | For refractory pain | When NSAIDs contraindicated; use cautiously in elderly |
From Rosen's Emergency Medicine: "There are no treatments to prevent or halt the progression of OA. Therapies include pain management, NSAIDs to reduce inflammation, intra-articular corticosteroids, activity modification, and, for severe cases, joint replacement."
Surgical Treatment
| Procedure | Indication |
|---|---|
| Total joint replacement (arthroplasty) | Relentless pain (especially night pain), failure of non-operative treatment, severe limitation of ADLs |
| Osteotomy (joint realignment) | Younger patients with malalignment; delays need for replacement |
| Arthrodesis (joint fusion) | Selected joints (ankle, wrist); sacrifices movement for pain relief |
| Arthroscopy | Limited role; lavage and debridement no longer routinely recommended |
PART 2: OSTEOPOROSIS
Definition
- Bone strength = BMD (bone mineral density) + bone quality (architecture, turnover, mineralization, micro-damage)
- WHO Definition by T-score (BMD measured by DXA, compared to young healthy reference):
- Normal: T-score ≥ -1.0
- Osteopenia: T-score between -1.0 and -2.5
- Osteoporosis: T-score ≤ -2.5
- Severe osteoporosis: T-score ≤ -2.5 + fragility fracture
Epidemiology
- Most common metabolic bone disease
- ~50% of women and 20% of men over age 50 will have a fragility fracture in their lifetime (Caucasian populations)
- The elderly are the fastest-growing age group; yearly fragility fractures will increase substantially
- One fragility fracture dramatically increases the risk of future fractures: vertebral fracture → hip fracture risk ×2, vertebral fracture risk ×5
Pathogenesis
| Mechanism | Details |
|---|---|
| Peak bone mass | Achieved by ~age 30; never exceeded after this point |
| Post-menopausal | Estrogen loss → marked increase in osteoclast activity → accelerated bone resorption |
| Age-related (senile) | Decreased osteoblast function + reduced calcium absorption + secondary hyperparathyroidism |
| Glucocorticoid-induced | Most common secondary cause; reduces osteoblast activity and increases osteoclast activity |
Main Causes of Osteoporosis
- Postmenopausal (type I)
- Senile/age-related (type II)
- Idiopathic
- Endocrine: hyperparathyroidism, hyperthyroidism, Cushing's syndrome, hypogonadism, diabetes mellitus
- Drugs: glucocorticoids (most common), heparin, anticonvulsants, proton pump inhibitors, aromatase inhibitors
- Nutritional: calcium/vitamin D deficiency, malabsorption, anorexia nervosa
- Inflammatory: rheumatoid arthritis, IBD
- Immobilization
Clinical Features
Fractures - The Clinical Presentation
| Fracture Type | Features |
|---|---|
| Vertebral compression fracture | Acute back pain after minimal trauma; resolves in 6-8 weeks; or completely asymptomatic (30%+). Multiple fractures → progressive loss of height, increased kyphosis ("dowager's hump") |
| Hip fracture | After low-energy fall; severe morbidity and mortality in elderly (20-30% mortality at 1 year) |
| Wrist (Colles') fracture | Falling on outstretched hand |
| Rib fractures | After minimal trauma or coughing |
Red Flags for Vertebral Fractures
- Fractures above T7: think metastases (osteoporotic fractures rare above T7)
- Posterior vertebral body fracture: think metastases or myeloma (not typical of osteoporosis)
- Pain that does NOT resolve in 6-8 weeks: metastases vs. osteoporosis
Diagnosis
| Test | Findings / Details |
|---|---|
| DXA scan | Gold standard; measures BMD at lumbar spine and hip; T-score defines severity |
| X-ray | Decreased bone density visible only when >30-40% bone mass lost; vertebral fractures (wedge, biconcave, crush) |
| FRAX tool | WHO tool; calculates 10-year probability of hip or major osteoporotic fracture; accounts for age, BMI, prior fracture, smoking, alcohol, steroids, RA |
| Blood tests | Ca, phosphate, ALP, 25-OH vitamin D, PTH, thyroid function, LH/FSH, testosterone (to identify secondary causes) |
| CT scan | Vertebral fracture quantification; shows trabecular rarefaction |

Treatment of Osteoporosis
Non-Pharmacological (For ALL Patients)
| Approach | Recommendation |
|---|---|
| Calcium | At least 1200 mg/day (diet + supplement combined) |
| Vitamin D | 800-2000 IU/day; target 25-OH vitamin D >30 ng/mL to ensure adequate calcium absorption |
| Weight-bearing exercise | Walking, jogging, dancing; stimulates osteoblast activity and bone formation |
| Fall prevention | Remove home hazards, balance training, vision correction, review medications causing dizziness |
| Smoking cessation | Smoking accelerates bone loss |
| Reduce alcohol | >3 units/day increases fracture risk |
| Treat underlying causes | Correct vitamin D deficiency, manage thyroid disease, minimize glucocorticoid dose |
Pharmacological - Anti-Resorptive Agents
| Drug | Class | Mechanism | Evidence |
|---|---|---|---|
| Alendronate (10 mg/day or 70 mg/week) | Bisphosphonate | Inhibits osteoclast function; reduces bone resorption | Gold standard; reduces vertebral, hip, and non-vertebral fractures |
| Risedronate (5 mg/day or 35 mg/week) | Bisphosphonate | Same as above | Reduces vertebral, hip fractures |
| Zoledronic acid (5 mg IV/year) | IV Bisphosphonate | Once-yearly IV; better compliance | Superior to oral bisphosphonates in some studies |
| Denosumab (60 mg SC every 6 months) | RANK-L inhibitor monoclonal antibody | Inhibits osteoclast formation and activity | Reduces hip, vertebral, and non-vertebral fractures; useful when bisphosphonates contraindicated |
| Raloxifene (60 mg/day) | SERM | Estrogen receptor modulator; inhibits bone resorption | Reduces vertebral fractures (not hip); also reduces breast cancer risk |
| Calcitonin | Hormone | Inhibits osteoclast activity; mild analgesic effect | Modest anti-fracture efficacy; useful for vertebral fracture pain relief |
| Estrogen/HRT | Hormone replacement | Inhibits bone resorption | For postmenopausal women who also have menopausal symptoms; increased breast/CVD risk |
Pharmacological - Anabolic (Bone-Building) Agents
| Drug | Class | Mechanism | Evidence |
|---|---|---|---|
| Teriparatide (20 mcg SC/day) | PTH analogue (PTH 1-34) | Stimulates osteoblast activity; builds new bone | Reduces vertebral AND non-vertebral fractures; for severe osteoporosis; max 2 years |
| Abaloparatide | PTHrP analogue | Anabolic; stimulates bone formation | Reduces vertebral and non-vertebral fractures |
| Romosozumab (210 mg SC/month) | Anti-sclerostin antibody | Dual action: stimulates bone formation + reduces resorption | Most potent BMD gain; followed by bisphosphonate to consolidate gains |
From Swanson's Family Medicine: "Bisphosphonates - demonstrated efficacy for vertebral fracture reduction; alendronate and risedronate for non-vertebral and hip fracture reduction as well." Teriparatide and denosumab - both demonstrated efficacy for vertebral AND non-vertebral fracture reduction.
Surgical Options (for Fractures)
| Procedure | Indication |
|---|---|
| Vertebroplasty | Cement injection into fractured vertebral body for persistent pain; performed within 4-6 weeks of fracture onset |
| Balloon kyphoplasty | Balloon creates cavity first, then cement fills; restores vertebral height + relieves pain |
| Hip fracture surgery | Hemiarthroplasty or total hip replacement for femoral neck fractures; internal fixation for intertrochanteric fractures |
From Grainger & Allison's Diagnostic Radiology: "Patients with proven osteoporosis should always be commenced on bone protective/bone enhancing therapy when vertebroplasty is performed."
SIDE-BY-SIDE COMPARISON TABLE
| Feature | Osteoarthritis | Osteoporosis |
|---|---|---|
| Type of disease | Degenerative joint disease | Metabolic bone disease |
| Tissue involved | Articular cartilage, subchondral bone, synovium | Trabecular and cortical bone (whole skeleton) |
| Mechanism | Cartilage degeneration > repair | Bone resorption > formation |
| Age of onset | Usually >50 | Peak loss post-menopause; fractures from 60s+ |
| Sex predominance | Women (especially hands, knees) | Women >> Men (postmenopausal estrogen loss) |
| Symptoms | Joint pain, stiffness, crepitus, deformity | Asymptomatic until fracture |
| Pain type | Mechanical (worse with activity) | Fracture pain (acute, severe) |
| Morning stiffness | <30 minutes | None (unless fracture) |
| Inflammation | Mild/secondary | None |
| Systemic effects | None | None (until fracture complications) |
| Joints affected | Hips, knees, spine, finger joints | Any bone (spine, hip, wrist most common) |
| X-ray findings | Joint space narrowing, osteophytes, sclerosis, cysts | Decreased bone density, vertebral wedge/crush fractures |
| Key investigation | X-ray | DXA scan (T-score) |
| Blood tests | Normal | Normal (unless secondary cause) |
| Key drug treatment | NSAIDs, analgesics, intra-articular steroids | Bisphosphonates, calcium, vitamin D |
| Curative surgery | Joint replacement (arthroplasty) | Vertebroplasty / fracture fixation (palliative) |
| Prevention | Weight loss, exercise, joint protection | Calcium, vitamin D, weight-bearing exercise, fall prevention |
| Can they coexist? | YES - same patient can have both simultaneously |