
Create a practice PDF for ECG reviews of different simple to complex ECGs real world type
ECG electrocardiogram normal sinus rhythm
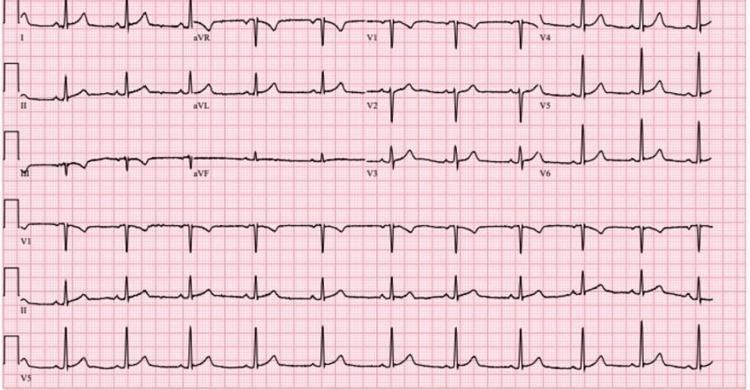
A standard 12-lead electrocardiogram (ECG) displayed on a typical red grid background. The tracing demonstrates a normal sinus rhythm with regular RR intervals. The limb leads (I, II, III, aVR, aVL, aVF) show upright P waves in lead II and inverted P waves in aVR, consistent with sinus origin. The QRS complexes are narrow and exhibit normal morphology across all leads. The precordial leads (V1-V6) show normal R-wave progression from V1 through V6. There is no evidence of acute ST-segment elevation or depression, nor are there any significant T-wave inversions. Rhythm strips for leads VI, II, and V5 are provided at the bottom, confirming rhythm stability. The ECG is clinically significant for its lack of acute ischemic changes despite the patient's elevated troponin levels, illustrating a case of cocaine-induced myocardial injury without diagnostic ST-T wave abnormalities on the initial electrocardiogram.
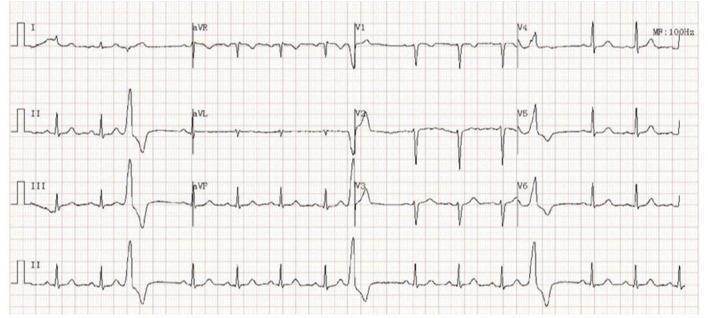
This diagnostic image is a 12-lead electrocardiogram (ECG) tracing recorded at a standard paper speed and gain. The ECG demonstrates a baseline underlying normal sinus rhythm characterized by regular P waves with a consistent morphology preceding narrow QRS complexes. Interspersed within the sinus rhythm are frequent premature ventricular complexes (PVCs). These ectopic beats are distinguished by their wide, bizarre QRS morphology, increased amplitude compared to the sinus beats, and the absence of a preceding P wave. The PVCs show a secondary T-wave change (discordance), where the T wave is oriented in the opposite direction to the main QRS deflection. The image serves as a clinical example of ventricular ectopy and is suitable for educational purposes regarding cardiac arrhythmia identification and ECG rhythm analysis in cardiology and emergency medicine contexts.
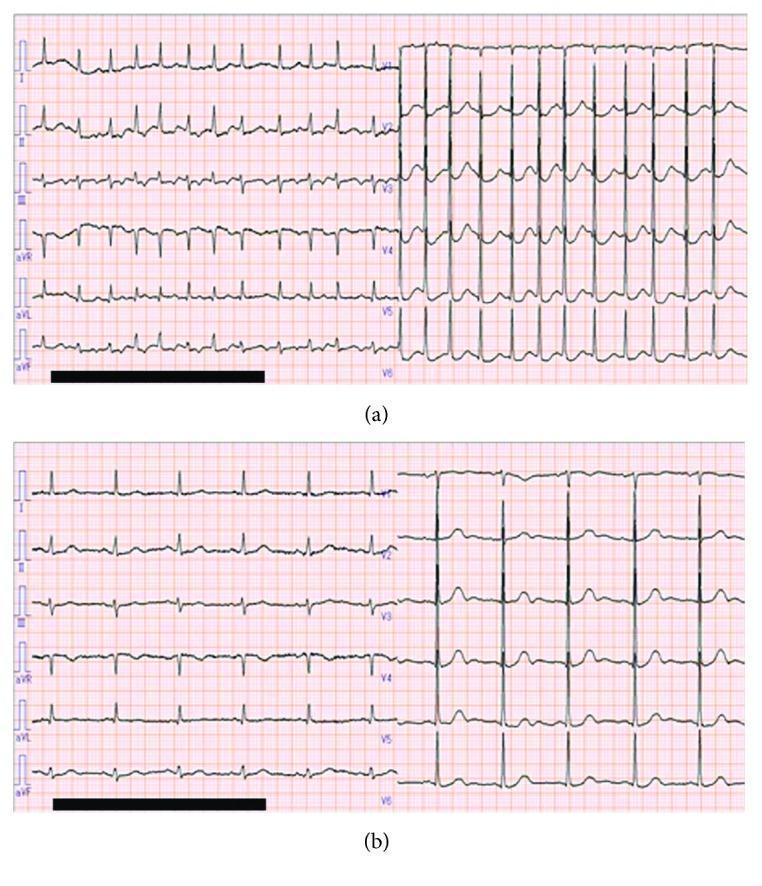
A comparative presentation of two 12-lead electrocardiogram (ECG) tracings from the same patient, demonstrating spontaneous rhythm alternation. (a) Top tracing: ECG showing atrial fibrillation (AF) characterized by an irregularly irregular rhythm, high ventricular rate, and the absence of discernible P waves. Fibrillatory waves are most prominent in the precordial leads (V1-V6), while the limb leads show inconsistent baseline morphology. (b) Bottom tracing: ECG demonstrating a return to normal sinus rhythm (SR). This tracing displays a regular rhythm with a slower heart rate, consistent R-R intervals, and clear P waves preceding each QRS complex across all leads (I, II, III, aVR, aVL, aVF, and V1-V6). The QRS complexes maintain similar morphology in both states. This visual comparison illustrates the diagnostic criteria for paroxysmal atrial fibrillation and its conversion to sinus rhythm in a clinical setting.
ECG atrial fibrillation
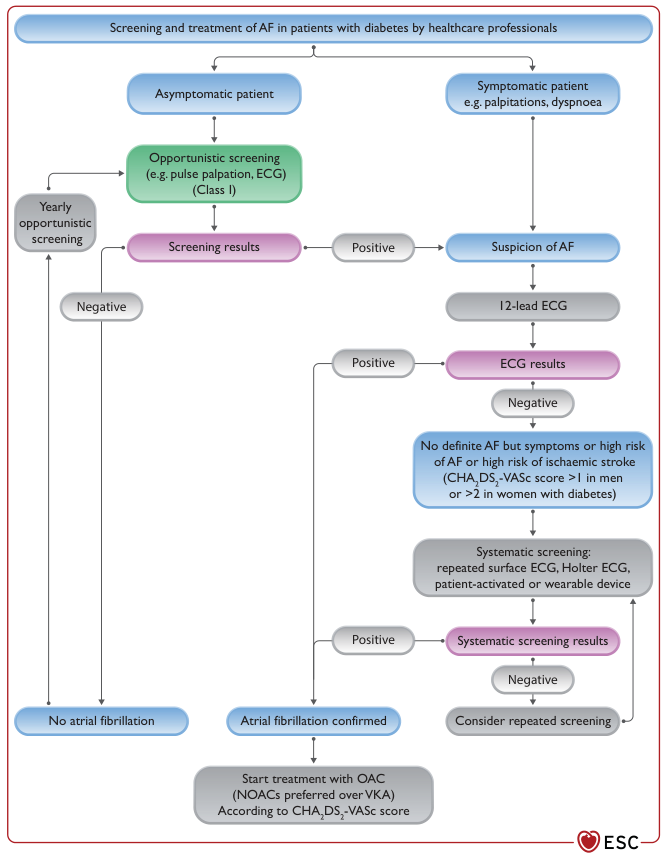
Summary : This flowchart outlines the recommended process for screening and treating atrial fibrillation (AF) in patients with diabetes, as advised for healthcare professionals. It details the steps for both asymptomatic and symptomatic patients, including screening methods, decision points, and treatment initiation based on results.
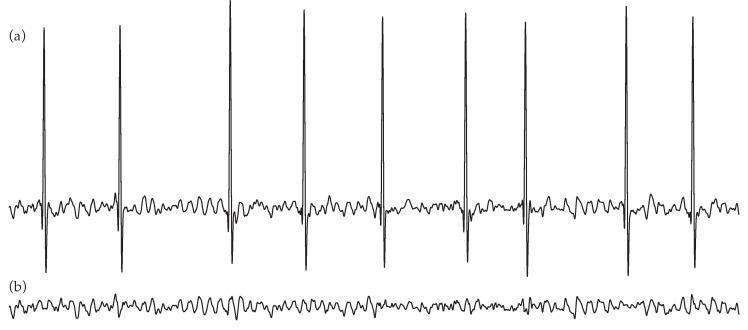
This diagnostic image displays a two-panel comparison of electrocardiogram (ECG) waveforms focusing on atrial fibrillation signal processing. Panel (a) illustrates a typical ECG segment exhibiting the characteristic features of atrial fibrillation, including irregularly irregular R-R intervals and the presence of fine fibrillatory (f) waves instead of distinct P waves. The vertical spikes represent the high-amplitude R-peaks of the ventricular QRST complexes. Panel (b) shows the isolated atrial fibrillatory signal after the application of an average QRST complex subtraction algorithm. This isolated 'f-wave' signal is characterized by low-amplitude, high-frequency, and irregular oscillations that reflect disorganized atrial electrical activity. The educational focus is on the signal processing techniques used in cardiology to extract and analyze atrial activity independently from ventricular interference, which is crucial for assessing the complexity of atrial fibrillation and predicting treatment outcomes like electrical cardioversion success.
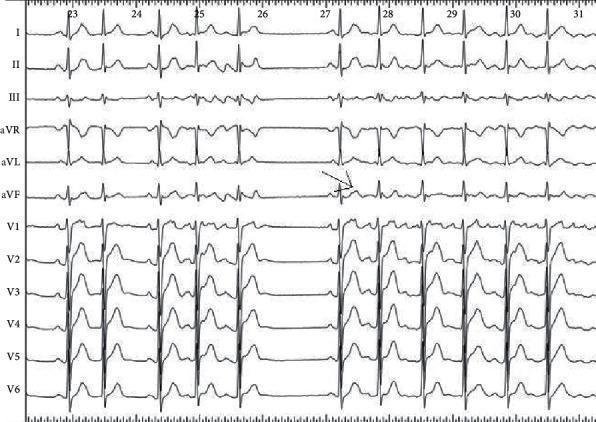
This diagnostic image is a 12-lead electrocardiogram (ECG) tracing demonstrating the 'P on T' phenomenon as a trigger for atrial arrhythmia. The tracing includes limb leads (I, II, III, aVR, aVL, aVF) and precordial leads (V1-V6). A specific arrow indicates an ectopic, non-conducted atrial premature contraction (APC). In this highlighted complex, the P-wave morphology is distinctly negative in leads I and aVL and positive in leads II, III, and aVF. This specific vector suggests an anatomical origin from the left superior pulmonary vein. The subsequent rhythm following the ectopic beat shows a transition into a paroxysmal tachyarrhythmia, likely atrial fibrillation, characterized by irregular QRS intervals and altered T-wave morphologies. The ECG serves as an educational example of how surface mapping of P-wave polarity can localize focal triggers for atrial fibrillation, aiding in pre-procedural planning for radiofrequency catheter ablation. Key concepts illustrated include atrial ectopy, pulmonary vein triggers, and the initiation of paroxysmal atrial fibrillation.
ECG ST elevation myocardial infarction STEMI
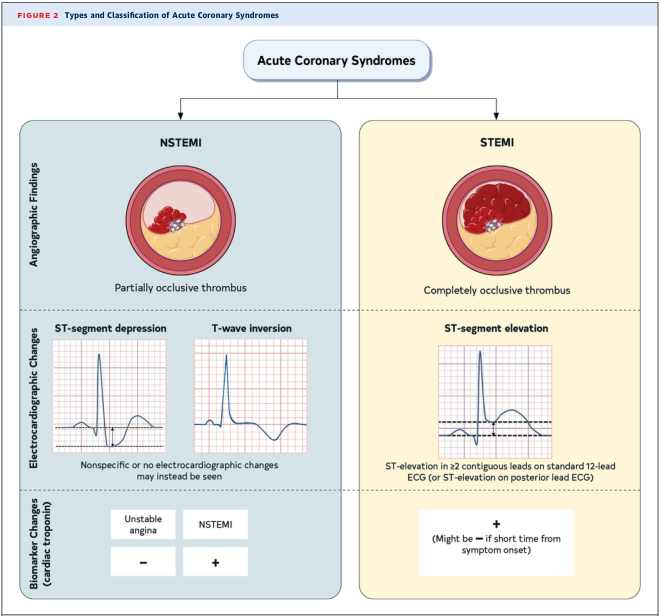
Summary : This figure presents the types and classification of Acute Coronary Syndromes, contrasting NSTEMI (Non-ST-Elevation Myocardial Infarction) and STEMI (ST-Elevation Myocardial Infarction) based on angiographic findings, electrocardiographic changes, and cardiac biomarker changes.
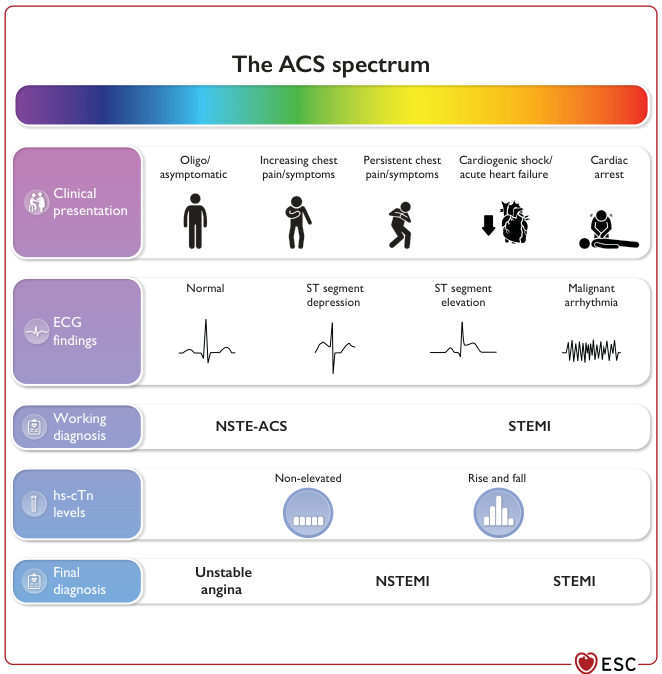
Summary : This figure illustrates the spectrum of Acute Coronary Syndromes (ACS), detailing the progression from mild or asymptomatic presentations to severe outcomes such as cardiac arrest. It organizes ACS into clinical presentation, ECG findings, working diagnosis, high-sensitivity cardiac troponin (hs-cTn) levels, and final diagnosis, showing how these elements interrelate across the ACS continuum.
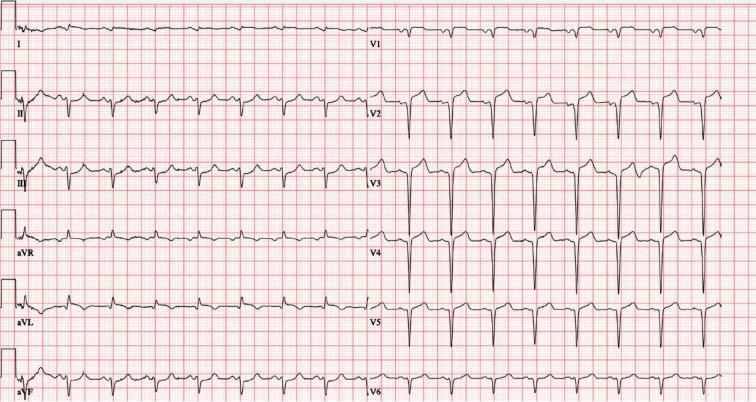
This is a 12-lead electrocardiogram (ECG) demonstrating an acute ST-segment elevation myocardial infarction (STEMI). The diagnostic hallmark is prominent ST-segment elevation across the precordial leads V1 through V6, with the most significant convex elevation appearing in leads V2, V3, and V4. These findings are highly characteristic of an acute anterior wall infarction, typically involving the left anterior descending (LAD) coronary artery. In the limb leads, mild ST-segment elevation is also visible in leads I, II, III, and aVF, accompanied by positive, upright T waves. Lead aVR shows expected global inversion. The tracing displays a sinus rhythm with regular morphology, but the ST-segment deviations from the isoelectric baseline indicate acute myocardial injury. This visual material is a critical educational tool for teaching the ECG localization of coronary occlusions and the identification of STEMI criteria in an emergency clinical context.
ECG ventricular tachycardia wide complex tachycardia
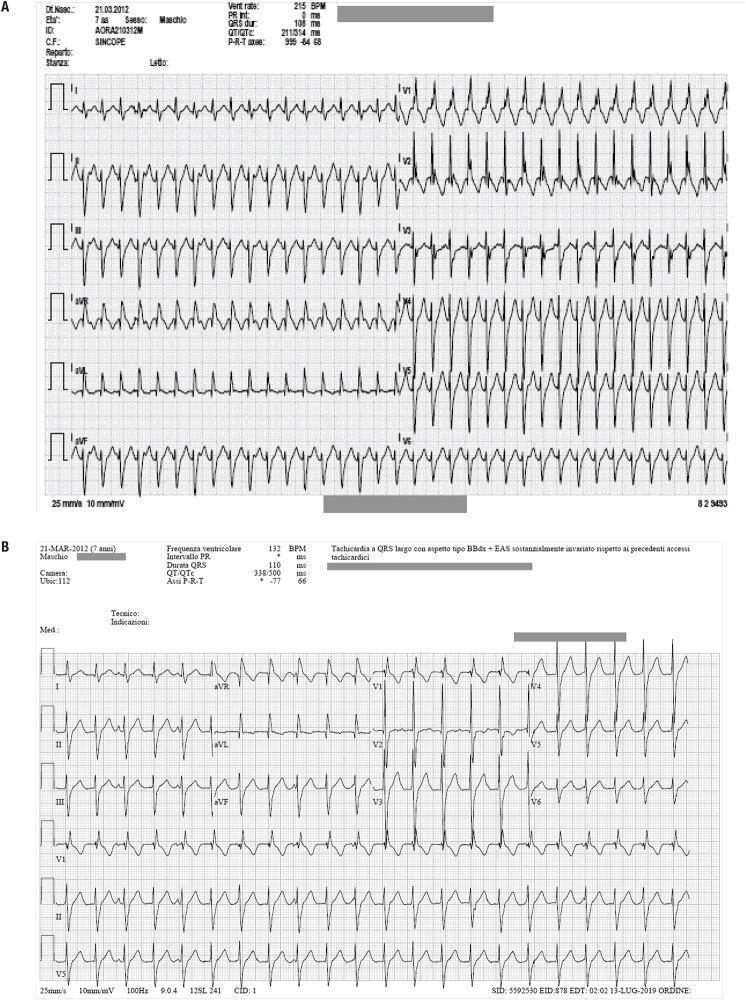
Two diagnostic 12-lead electrocardiogram (ECG) tracings (labeled A and B) from a 7-year-old male patient showing wide-complex tachyarrhythmias. Figure 1A demonstrates a regular, wide QRS tachycardia at a rate of approximately 215 BPM. The morphology exhibits features consistent with a right bundle branch block (RBBB) pattern and a superior axis, suggestive of left anterior fascicular block. Figure 1B shows a subsequent episode of wide-complex tachycardia at a slower rate of 132 BPM, maintaining the RBBB-like morphology and superior QRS axis deviation. Key diagnostic parameters provided in the ECG headers include a QRS duration of 110 ms in Figure 1B and a markedly shifted P-R-T axis between the two recordings. Both tracings represent ventricular fascicular tachycardia (VFT), a specific type of idiopathic ventricular tachycardia often characterized by a RBBB pattern and axis deviation. The images serve as educational materials for distinguishing fascicular ventricular tachycardia from other forms of supraventricular or ventricular arrhythmias based on QRS morphology, axis, and rate.
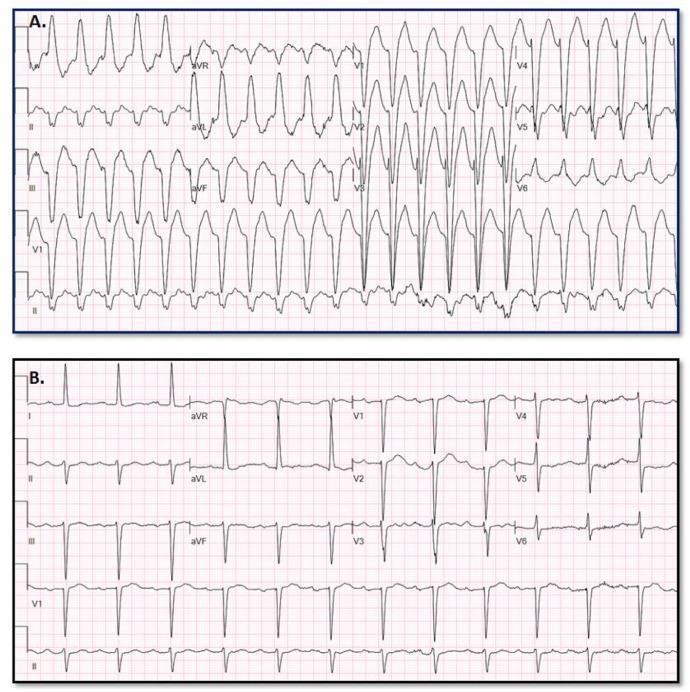
This diagnostic comparison image shows two 12-lead electrocardiograms (ECGs) used to illustrate the differentiation between Wide Complex Tachycardia (WCT) and baseline rhythms. Panel A displays a Wide Complex Tachycardia characterized by a rapid ventricular rate and significantly widened QRS complexes (approximately 170 ms). The morphology is relatively uniform with prominent S-waves in the precordial leads and notable baseline artifact. Panel B shows the patient's baseline ECG, presenting a narrow QRS complex rhythm with visible P-waves preceding each QRS, consistent with sinus rhythm or a supraventricular origin. The comparison highlights clinical diagnostic challenges where Supraventricular Tachycardia (SWCT) with aberrancy may mimic Ventricular Tachycardia (VT). This material is intended for advanced medical education in cardiology and electrophysiology, specifically focusing on ECG interpretation and the application of predictive models for arrhythmia classification.
ECG heart block third degree complete AV block
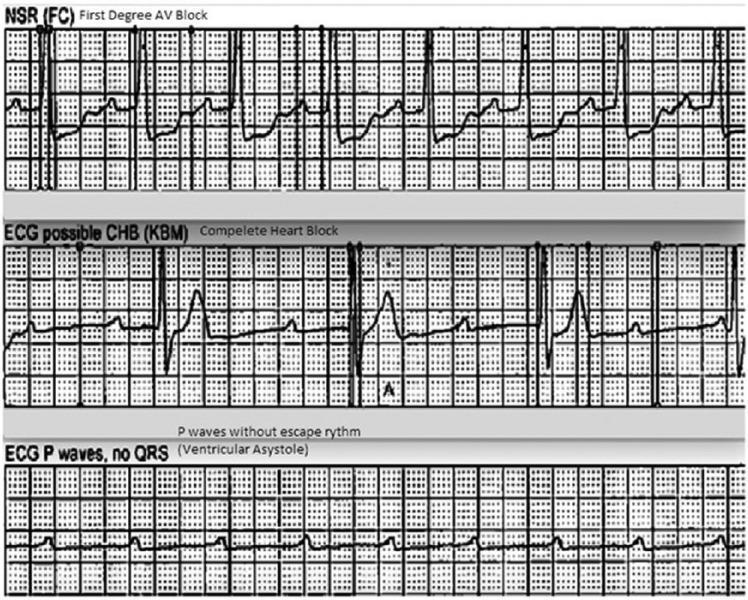
This diagnostic image displays a vertical comparison of three ECG rhythm strips demonstrating the progression and characteristics of different cardiac conduction abnormalities. The top strip, labeled 'NSR (FC) First Degree AV Block,' shows a sinus rhythm with a prolonged PR interval, indicating a delay in conduction between the atria and ventricles. The middle strip, labeled 'ECG possible CHB (KBM) Complete Heart Block,' illustrates third-degree atrioventricular (AV) block characterized by complete AV dissociation; P waves are present but occur independently of the slow, irregular QRS complexes (escape rhythm). The bottom strip, labeled 'ECG P waves, no QRS (Ventricular Asystole),' depicts a high-grade block where atrial activity (P waves) continues, but there is a total failure of ventricular conduction resulting in ventricular asystole. This sequence serves as an educational tool for identifying varying severity levels of heart blocks and the transition from conduction delay to lethal ventricular standstill.
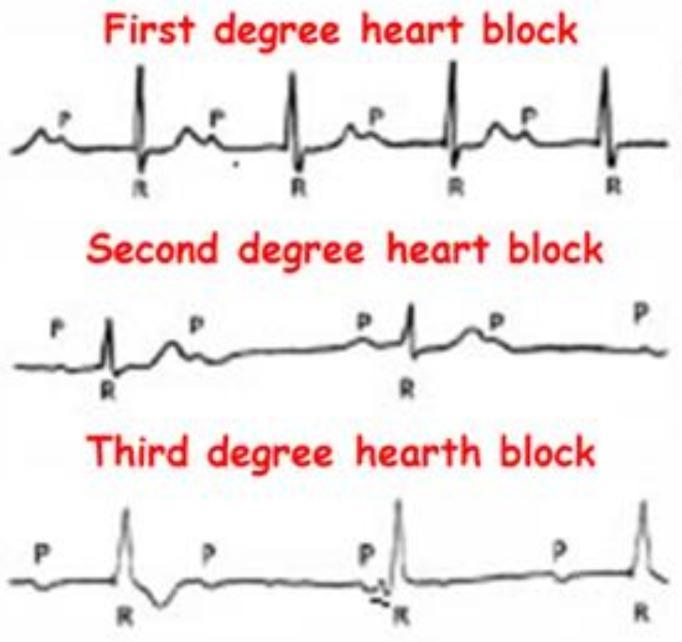
This Comparison Chart illustrates the electrocardiographic (ECG) characteristics of Atrioventricular (AV) blocks. It features three stacked rhythm strips categorized as First, Second, and Third-degree heart blocks, emphasizing the relationship between P waves (atrial depolarization) and QRS complexes (ventricular depolarization). The 'First degree heart block' panel demonstrates a consistent 1:1 P-to-QRS ratio with a fixed, prolonged PR interval. The 'Second degree heart block' panel shows intermittent conduction failure, where specific P waves are not followed by a QRS complex. The 'Third degree heart block' panel depicts complete AV dissociation, where P waves and QRS complexes occur independently and at different rates, indicating a total interruption of impulse transmission and the presence of a ventricular escape rhythm. This diagnostic illustration is designed for cardiovascular education to help students and clinicians distinguish between different stages of cardiac conduction system disease and their associated clinical significance.
ECG Wolff-Parkinson-White WPW pre-excitation delta wave
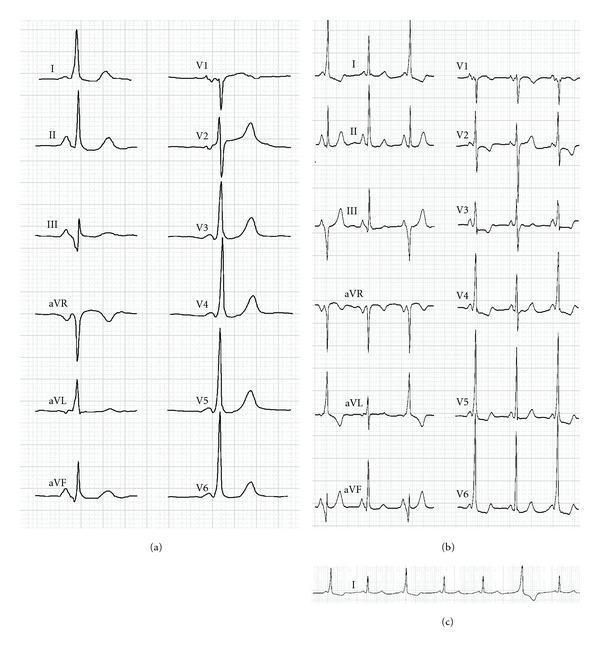
This composite diagnostic image displays surface electrocardiograms (ECGs) from a patient with ventricular pre-excitation. Panel (a) shows a standard 12-lead ECG characterized by a shortened PR interval, the presence of a delta wave (slurring of the initial QRS upstroke), and widened QRS complexes, which are classic signs of Wolff-Parkinson-White (WPW) syndrome pattern. Panel (b) presents another 12-lead strip showing beat-to-beat variability: the first and third beats exhibit pre-excitation (short PR, delta wave, wide QRS), while the second beat displays a normal PR interval and narrow QRS morphology. Panel (c) provides a continuous Lead I rhythm strip illustrating this electrical alternation (alternance), where pre-excited beats alternate with normally conducted beats. The ECG findings are essential for identifying accessory pathway conduction and evaluating the results of catheter ablation procedures. Clinically, the alternation in Panel (b) and (c) can represent intermittent pre-excitation or fusion beats between normal atrioventricular conduction and an ectopic ventricular rhythm arising near a previous ablation site.
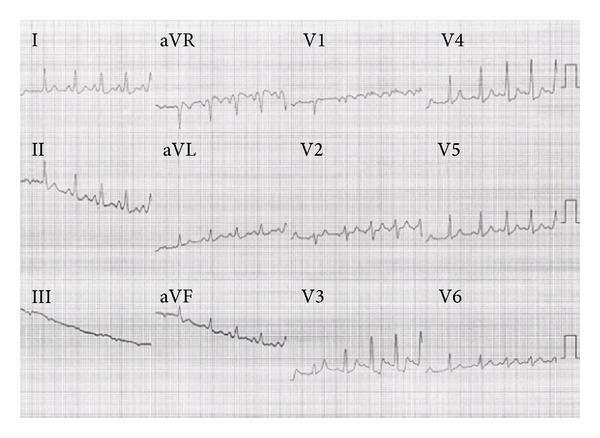
This diagnostic image is a 12-lead electrocardiogram (ECG) demonstrating the classic visual features of Wolff-Parkinson-White (WPW) syndrome following the administration of isoproterenol (Isuprel). The tracing displays a regular sinus rhythm with a shortened PR interval. A hallmark finding is the slurred upstroke of the initial QRS complex, known as a delta wave, which is most prominent in leads I, II, aVL, and V4 through V6. The QRS complexes exhibit mild widening as a result of this pre-excitation, where ventricular activation occurs via both the atrioventricular (AV) node and a left-sided accessory pathway. T-wave morphology shows variability, with upright T-waves in the lateral leads (I, aVL, V4-V6) and inversion in the right precordial leads (V1-V3) and lead aVR. This ECG serves as an educational example of pre-excitation syndrome morphology and the impact of adrenergic stimulation on AV and accessory pathway conduction.
ECG left bundle branch block LBBB
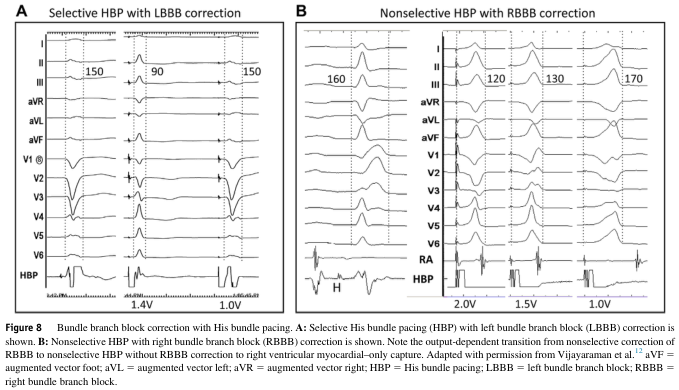
Summary : This figure presents two sets of 12-lead ECG tracings demonstrating bundle branch block correction using His bundle pacing (HBP). Panel A shows selective HBP with left bundle branch block (LBBB) correction, while Panel B shows nonselective HBP with right bundle branch block (RBBB) correction, including transitions at different pacing outputs.
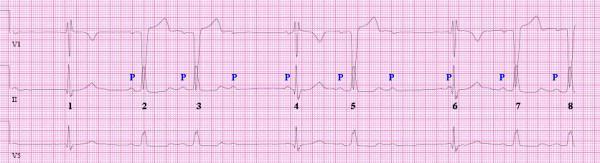
Diagnostic electrocardiogram (ECG) rhythm strip displaying leads V1, II, and V5, demonstrating a complex conduction disturbance involving alternating bundle branch block morphologies and atrioventricular (AV) block. The tracing shows eight numbered QRS complexes. Complexes 2, 3, 5, 7, and 8 exhibit a wide QRS morphology characteristic of Left Bundle Branch Block (LBBB), associated with visible preceding P waves (labeled 'P') and a first-degree AV block. Conversely, complexes 1, 4, and 6 demonstrate a Right Bundle Branch Block (RBBB) morphology. Notably, complex 1 lacks a preceding P wave, and the PR intervals for complexes 4 and 6 are significantly shorter than those of the LBBB complexes, suggesting that the RBBB morphology represents ventricular escape beats in the setting of high-grade or complete AV conduction block. This visual evidence is critical for teaching the identification of advanced infra-nodal conduction system disease and the differentiation between conducted beats and escape rhythms in the presence of bi-fascicular or trifascicular block.
ECG hyperkalemia peaked T waves
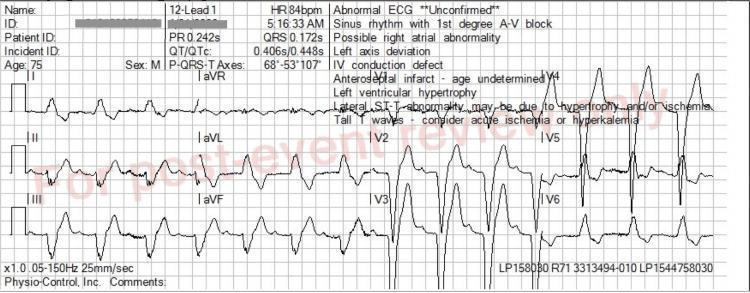
This diagnostic image is a 12-lead electrocardiogram (ECG) demonstrating multiple conduction and metabolic abnormalities. The tracing shows a sinus rhythm with a prolonged PR interval (0.242s), indicating first-degree atrioventricular (AV) block. The QRS complex is significantly widened (0.172s) with a morphology consistent with a left bundle branch block (LBBB) pattern, characterized by deep S waves in V1-V3 and broad, notched R waves in lateral leads such as V6 and aVL. Notably, the T waves are disproportionately tall, peaked, and 'tented,' particularly visible in the precordial leads V2-V5. These peaked T waves, when combined with QRS widening, are classic electrocardiographic manifestations of hyperkalemia. The image also displays left axis deviation and secondary ST-T wave discordance typical of LBBB. This ECG serves as a critical educational example of how metabolic disturbances like hyperkalemia can overlay and exacerbate underlying conduction system disease in a clinical emergency setting.
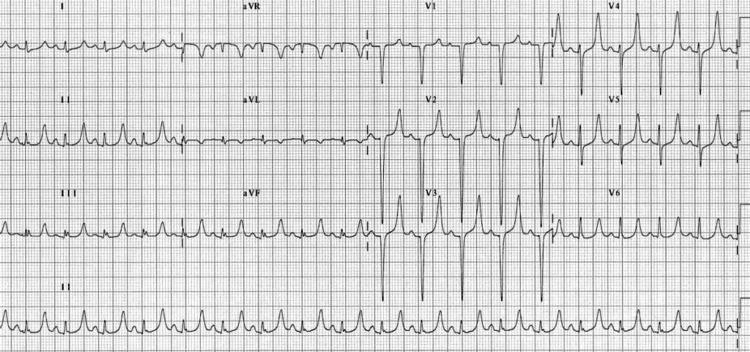
A 12-lead electrocardiogram (ECG) demonstrating visual characteristics of severe hyperkalemia. The tracing exhibits a regular sinus rhythm with notable conduction abnormalities. Key features include highly prominent, peaked T waves ('tenting'), which are most distinct in the inferior leads (II, III, and aVF) and across the precordial leads (V2–V5). The QRS complexes show significant widening (prolonged duration), indicating an intraventricular conduction delay. Additionally, the P waves appear flattened, a common progression in hyperkalemic states as potassium levels rise. The morphology shown is a classic educational example of how hyperkalemia affects cardiac electrophysiology, potentially progressing from peaked T waves to QRS widening and eventually a sine-wave pattern if untreated. This image is used to teach clinical recognition of electrolyte imbalances in emergency and intensive care settings.
mkdir -p /tmp/workspace/ecg-practice && ls /tmp/workspace/ecg-practice/
~/ecg-practice/build_ecg_pdf.py
#!/usr/bin/env python3
"""
ECG Practice PDF Builder
Generates a comprehensive ECG practice workbook with real-world cases,
drawn ECG tracings, clinical scenarios, and an answer key.
"""
import io
import math
import urllib.request
import urllib.error
from reportlab.lib import colors
from reportlab.lib.pagesizes import letter, landscape
from reportlab.lib.styles import getSampleStyleSheet, ParagraphStyle
from reportlab.lib.units import inch, mm
from reportlab.platypus import (
SimpleDocTemplate, Paragraph, Spacer, Table, TableStyle,
PageBreak, HRFlowable, KeepTogether, Image as RLImage
)
from reportlab.platypus.flowables import Flowable
from reportlab.graphics.shapes import (
Drawing, Line, Rect, Path, String, Circle, Group
)
from reportlab.graphics import renderPDF
from reportlab.lib.colors import HexColor, Color
from PIL import Image as PILImage
# ── Colour palette ────────────────────────────────────────────────────────────
DARK_BG = HexColor("#1A1A2E")
ACCENT_BLUE = HexColor("#0F3460")
ACCENT_CYAN = HexColor("#16213E")
HIGHLIGHT = HexColor("#E94560")
GOLD = HexColor("#F5A623")
GRID_RED = HexColor("#FFCCCC")
GRID_DARK = HexColor("#FF9999")
ECG_LINE = HexColor("#00FF41") # classic monitor green
ECG_LINE2 = HexColor("#1C1C1C") # dark paper trace
PAPER_BG = HexColor("#FFF9F0")
SECTION_HEAD = HexColor("#003366")
EASY_GREEN = HexColor("#27AE60")
MED_ORANGE = HexColor("#E67E22")
HARD_RED = HexColor("#C0392B")
WHITE = colors.white
BLACK = colors.black
LIGHT_GRAY = HexColor("#F0F0F0")
MED_GRAY = HexColor("#888888")
# ── Page setup ────────────────────────────────────────────────────────────────
PAGE_W, PAGE_H = letter # 8.5 x 11 inches
# ═══════════════════════════════════════════════════════════════════════════════
# ECG DRAWING ENGINE (generates synthetic 12-lead-style tracings)
# ═══════════════════════════════════════════════════════════════════════════════
def ecg_normal_sinus(t, hr=75):
"""Return ECG amplitude for normal sinus rhythm at given time t (seconds)."""
period = 60.0 / hr
t_mod = t % period
tp = t_mod / period # 0-1 within one cycle
# Gaussian-like waves: P, Q, R, S, T
def gauss(x, mu, sigma, amp):
return amp * math.exp(-((x - mu) ** 2) / (2 * sigma ** 2))
y = 0
y += gauss(tp, 0.12, 0.015, 0.15) # P wave
y += gauss(tp, 0.26, 0.004, -0.08) # Q notch
y += gauss(tp, 0.29, 0.008, 1.0) # R peak
y += gauss(tp, 0.32, 0.004, -0.25) # S wave
y += gauss(tp, 0.42, 0.025, 0.25) # T wave
return y
def ecg_afib(t):
"""Atrial fibrillation: irregular RR, no distinct P, fibrillatory baseline."""
import random
rng = random.Random(42)
period = 60.0 / 120 # mean HR ~120
t_mod = t % (period * 7) # irregular cycles
# Irregular R-R: vary RR between 0.45-0.75 s
rr_table = [0.52, 0.63, 0.48, 0.71, 0.55, 0.60, 0.49]
cumulative = 0
cycle_pos = 0
for i, rr in enumerate(rr_table):
if t_mod < cumulative + rr:
cycle_pos = (t_mod - cumulative) / rr
break
cumulative += rr
else:
cycle_pos = (t_mod - cumulative) / rr_table[-1] if rr_table else 0
def gauss(x, mu, sigma, amp):
return amp * math.exp(-((x - mu) ** 2) / (2 * sigma ** 2))
y = 0
# No P wave; fibrillatory baseline
y += 0.04 * math.sin(2 * math.pi * t * 6.5) + 0.02 * math.sin(2 * math.pi * t * 8.2)
y += gauss(cycle_pos, 0.27, 0.006, -0.05) # Q
y += gauss(cycle_pos, 0.30, 0.008, 1.0) # R
y += gauss(cycle_pos, 0.33, 0.005, -0.22) # S
y += gauss(cycle_pos, 0.44, 0.025, 0.20) # T
return y
def ecg_stemi(t, leads="anterior"):
"""STEMI - ST elevation, hyperacute T waves (anterior leads)."""
period = 60.0 / 90
t_mod = t % period
tp = t_mod / period
def gauss(x, mu, sigma, amp):
return amp * math.exp(-((x - mu) ** 2) / (2 * sigma ** 2))
y = 0
y += gauss(tp, 0.12, 0.015, 0.12) # P wave
y += gauss(tp, 0.26, 0.004, -0.06) # Q (pathological in anterior STEMI)
y += gauss(tp, 0.29, 0.009, 1.0) # R
y += gauss(tp, 0.32, 0.004, -0.15) # S
# ST elevation: shift baseline after QRS
if 0.33 <= tp <= 0.50:
st_frac = (tp - 0.33) / (0.50 - 0.33)
y += 0.30 * (1 - st_frac * 0.5) # elevated ST
y += gauss(tp, 0.50, 0.035, 0.55) # Hyperacute T wave (tall)
return y
def ecg_vt(t):
"""Monomorphic ventricular tachycardia: wide, regular, fast."""
period = 60.0 / 170 # HR 170
t_mod = t % period
tp = t_mod / period
def gauss(x, mu, sigma, amp):
return amp * math.exp(-((x - mu) ** 2) / (2 * sigma ** 2))
y = 0
# No P waves, wide bizarre QRS
y += gauss(tp, 0.20, 0.04, -0.4) # broad negative deflection
y += gauss(tp, 0.35, 0.05, 1.0) # main peak
y += gauss(tp, 0.50, 0.04, -0.3) # secondary deflection
y += gauss(tp, 0.65, 0.03, 0.2) # T wave
return y
def ecg_chb(t):
"""Complete heart block: independent P waves (~75 bpm) and slow escape (~35 bpm)."""
p_period = 60.0 / 75
v_period = 60.0 / 35
def gauss(x, mu, sigma, amp):
return amp * math.exp(-((x - mu) ** 2) / (2 * sigma ** 2))
# P waves (atrial)
t_p = t % p_period
tp = t_p / p_period
y = gauss(tp, 0.12, 0.015, 0.15) # P wave only
# Escape QRS-T (ventricular, slow, wide)
t_v = t % v_period
tv = t_v / v_period
y += gauss(tv, 0.25, 0.004, -0.05) # Q
y += gauss(tv, 0.30, 0.012, 0.85) # Wide R
y += gauss(tv, 0.36, 0.006, -0.20) # S
y += gauss(tv, 0.55, 0.04, -0.30) # Inverted T (escape)
return y
def ecg_wpw(t):
"""WPW: short PR, delta wave, wide QRS."""
period = 60.0 / 80
t_mod = t % period
tp = t_mod / period
def gauss(x, mu, sigma, amp):
return amp * math.exp(-((x - mu) ** 2) / (2 * sigma ** 2))
y = 0
y += gauss(tp, 0.09, 0.015, 0.12) # P wave
# Short PR -> QRS starts earlier
# Delta wave: slurred upstroke
if 0.15 <= tp <= 0.21:
delta_frac = (tp - 0.15) / 0.06
y += 0.25 * delta_frac # delta wave
y += gauss(tp, 0.25, 0.010, 1.0) # R (wider due to delta)
y += gauss(tp, 0.29, 0.005, -0.30) # S
y += gauss(tp, 0.42, 0.028, 0.20) # T
return y
def ecg_lbbb(t):
"""LBBB: broad notched R in V5/V6, deep S in V1."""
period = 60.0 / 72
t_mod = t % period
tp = t_mod / period
def gauss(x, mu, sigma, amp):
return amp * math.exp(-((x - mu) ** 2) / (2 * sigma ** 2))
y = 0
y += gauss(tp, 0.12, 0.015, 0.12) # P
# No septal Q; broad notched R
y += gauss(tp, 0.27, 0.015, 0.60) # R1 (first peak of notch)
y += gauss(tp, 0.35, 0.015, 0.95) # R2 (taller peak)
y += gauss(tp, 0.43, 0.025, -0.35) # discordant T
return y
def ecg_hyperkalemia(t):
"""Hyperkalemia: peaked T, wide QRS, flat P."""
period = 60.0 / 70
t_mod = t % period
tp = t_mod / period
def gauss(x, mu, sigma, amp):
return amp * math.exp(-((x - mu) ** 2) / (2 * sigma ** 2))
y = 0
y += gauss(tp, 0.12, 0.008, 0.05) # flat/absent P
y += gauss(tp, 0.27, 0.006, -0.08) # Q
y += gauss(tp, 0.31, 0.012, 0.80) # Wide R
y += gauss(tp, 0.35, 0.006, -0.20) # S
y += gauss(tp, 0.46, 0.018, 0.70) # Peaked tent T
return y
def ecg_svt(t):
"""SVT: narrow QRS, fast (~170), P buried in T or retrograde."""
period = 60.0 / 170
t_mod = t % period
tp = t_mod / period
def gauss(x, mu, sigma, amp):
return amp * math.exp(-((x - mu) ** 2) / (2 * sigma ** 2))
y = 0
y += gauss(tp, 0.28, 0.004, -0.05) # Q
y += gauss(tp, 0.31, 0.007, 1.0) # R
y += gauss(tp, 0.34, 0.004, -0.20) # S
# Retrograde P buried at end of T
y += gauss(tp, 0.52, 0.018, 0.15) # T with buried P
return y
def ecg_second_degree_mobitz2(t):
"""Mobitz II: fixed PR, dropped beats (4:1 then 3:1 pattern)."""
# Pattern: 3 conducted beats then 1 dropped, repeating
period = 60.0 / 75 # conducted beat period
block_cycle = period * 4 # 3 conducted + 1 blocked
t_mod = t % block_cycle
beat_idx = int(t_mod / period)
def gauss(x, mu, sigma, amp):
return amp * math.exp(-((x - mu) ** 2) / (2 * sigma ** 2))
t_beat = t_mod % period
tp = t_beat / period
y = 0
# Always show P wave
y += gauss(tp, 0.12, 0.015, 0.15) # P wave present every beat
# Only add QRS for beats 0,1,2 (not beat 3 which is blocked)
if beat_idx < 3:
y += gauss(tp, 0.26, 0.004, -0.07) # Q
y += gauss(tp, 0.29, 0.008, 1.0) # R
y += gauss(tp, 0.32, 0.004, -0.22) # S
y += gauss(tp, 0.41, 0.024, 0.24) # T
return y
def ecg_torsades(t):
"""Torsades de Pointes: twisting axis VT, polymorphic."""
period = 60.0 / 220
t_mod = t % period
tp = t_mod / period
# Twisting: amplitude modulated by slow sine
twist = math.sin(2 * math.pi * t * 1.2)
def gauss(x, mu, sigma, amp):
return amp * math.exp(-((x - mu) ** 2) / (2 * sigma ** 2))
y = 0
y += twist * gauss(tp, 0.25, 0.04, -0.35)
y += twist * gauss(tp, 0.40, 0.05, 1.0)
y += twist * gauss(tp, 0.55, 0.04, -0.25)
y += gauss(tp, 0.68, 0.03, 0.15 * twist)
return y
# ═══════════════════════════════════════════════════════════════════════════════
# FLOWABLE: ECG Strip (drawn with ReportLab graphics)
# ═══════════════════════════════════════════════════════════════════════════════
class ECGStrip(Flowable):
"""A synthetic ECG rhythm strip drawn on grid paper."""
def __init__(self, ecg_func, label="Lead II", width=6.5*inch, height=1.1*inch,
duration=4.0, color=ECG_LINE2, bg=PAPER_BG, title_color=SECTION_HEAD):
super().__init__()
self.ecg_func = ecg_func
self.label = label
self.width = width
self.height = height
self.duration = duration
self.color = color
self.bg = bg
self.title_color = title_color
def wrap(self, availW, availH):
return self.width, self.height + 14
def draw(self):
c = self.canv
w, h = self.width, self.height
y_off = 14 # space for label above
# Background
c.setFillColor(self.bg)
c.rect(0, 0, w, h, fill=1, stroke=0)
# Grid - small squares (1mm = 0.04s, 0.1mV)
px_per_mm = w / (self.duration * 1000 / 40) # 40ms small square
mm_h = h / 10 # 10 small squares tall
small = min(px_per_mm, mm_h) * 0.8
# Draw small grid lines (light pink)
c.setStrokeColor(HexColor("#FFBBBB"))
c.setLineWidth(0.3)
x = 0
while x <= w:
c.line(x, 0, x, h)
x += small
y = 0
while y <= h:
c.line(0, y, w, y)
y += small
# Draw large grid lines (darker red) every 5 small squares
c.setStrokeColor(HexColor("#FF8888"))
c.setLineWidth(0.6)
x = 0
while x <= w:
c.line(x, 0, x, h)
x += small * 5
y = 0
while y <= h:
c.line(0, y, w, y)
y += small * 5
# Border
c.setStrokeColor(HexColor("#CC4444"))
c.setLineWidth(1.0)
c.rect(0, 0, w, h, fill=0, stroke=1)
# Draw ECG trace
n_points = int(w * 2)
mid_y = h * 0.5
amplitude = h * 0.35
pts = []
for i in range(n_points + 1):
t = (i / n_points) * self.duration
y_val = self.ecg_func(t)
px = (i / n_points) * w
py = mid_y + y_val * amplitude
pts.append((px, py))
c.setStrokeColor(self.color)
c.setLineWidth(1.4)
p = c.beginPath()
p.moveTo(pts[0][0], pts[0][1])
for px, py in pts[1:]:
p.lineTo(px, py)
c.drawPath(p, stroke=1, fill=0)
# Label
c.setFont("Helvetica-Bold", 8)
c.setFillColor(self.title_color)
c.drawString(2, h + 4, self.label)
# ═══════════════════════════════════════════════════════════════════════════════
# HELPER: Remote image downloader
# ═══════════════════════════════════════════════════════════════════════════════
def download_image(url, max_w, max_h):
"""Download image URL, return ReportLab Image flowable (scaled), or None."""
try:
req = urllib.request.Request(url, headers={"User-Agent": "Mozilla/5.0"})
with urllib.request.urlopen(req, timeout=15) as resp:
data = resp.read()
img = PILImage.open(io.BytesIO(data))
orig_w, orig_h = img.size
scale = min(max_w / orig_w, max_h / orig_h)
new_w = orig_w * scale
new_h = orig_h * scale
buf = io.BytesIO()
img.save(buf, format="PNG")
buf.seek(0)
return RLImage(buf, width=new_w, height=new_h)
except Exception as e:
print(f" [image skip] {url[:60]}... -> {e}")
return None
# ═══════════════════════════════════════════════════════════════════════════════
# STYLE HELPERS
# ═══════════════════════════════════════════════════════════════════════════════
def make_styles():
base = getSampleStyleSheet()
styles = {}
styles["cover_title"] = ParagraphStyle(
"cover_title", parent=base["Title"],
fontSize=32, textColor=WHITE, spaceAfter=6, alignment=1,
fontName="Helvetica-Bold"
)
styles["cover_sub"] = ParagraphStyle(
"cover_sub", parent=base["Normal"],
fontSize=16, textColor=HexColor("#CCDDFF"), spaceAfter=4, alignment=1
)
styles["cover_note"] = ParagraphStyle(
"cover_note", parent=base["Normal"],
fontSize=11, textColor=HexColor("#AABBCC"), alignment=1
)
styles["chapter"] = ParagraphStyle(
"chapter", parent=base["Heading1"],
fontSize=20, textColor=WHITE, spaceBefore=6, spaceAfter=8,
fontName="Helvetica-Bold", backColor=SECTION_HEAD,
borderPad=(6, 10, 6, 10), alignment=0
)
styles["section"] = ParagraphStyle(
"section", parent=base["Heading2"],
fontSize=14, textColor=SECTION_HEAD, spaceBefore=8, spaceAfter=4,
fontName="Helvetica-Bold"
)
styles["body"] = ParagraphStyle(
"body", parent=base["Normal"],
fontSize=10, textColor=HexColor("#1A1A1A"), spaceAfter=4, leading=14
)
styles["body_sm"] = ParagraphStyle(
"body_sm", parent=base["Normal"],
fontSize=9, textColor=HexColor("#333333"), spaceAfter=3, leading=12
)
styles["bold"] = ParagraphStyle(
"bold", parent=base["Normal"],
fontSize=10, textColor=BLACK, fontName="Helvetica-Bold", spaceAfter=3
)
styles["case_header"] = ParagraphStyle(
"case_header", parent=base["Normal"],
fontSize=13, textColor=WHITE, fontName="Helvetica-Bold",
spaceAfter=4, backColor=ACCENT_BLUE, borderPad=(5, 8, 5, 8)
)
styles["answer_header"] = ParagraphStyle(
"answer_header", parent=base["Normal"],
fontSize=11, textColor=WHITE, fontName="Helvetica-Bold",
spaceAfter=4, backColor=EASY_GREEN, borderPad=(4, 6, 4, 6)
)
styles["diff_easy"] = ParagraphStyle(
"diff_easy", parent=base["Normal"],
fontSize=9, textColor=WHITE, fontName="Helvetica-Bold",
backColor=EASY_GREEN, borderPad=(2, 5, 2, 5)
)
styles["diff_med"] = ParagraphStyle(
"diff_med", parent=base["Normal"],
fontSize=9, textColor=WHITE, fontName="Helvetica-Bold",
backColor=MED_ORANGE, borderPad=(2, 5, 2, 5)
)
styles["diff_hard"] = ParagraphStyle(
"diff_hard", parent=base["Normal"],
fontSize=9, textColor=WHITE, fontName="Helvetica-Bold",
backColor=HARD_RED, borderPad=(2, 5, 2, 5)
)
styles["clinical_box"] = ParagraphStyle(
"clinical_box", parent=base["Normal"],
fontSize=10, textColor=HexColor("#0D2B5E"), spaceAfter=3,
leading=14, backColor=HexColor("#E8F4FD"),
borderPad=(6, 10, 6, 10)
)
styles["answer_box"] = ParagraphStyle(
"answer_box", parent=base["Normal"],
fontSize=10, textColor=HexColor("#1A3A1A"), spaceAfter=3,
leading=14, backColor=HexColor("#E8F8E8"),
borderPad=(6, 10, 6, 10)
)
styles["key_finding"] = ParagraphStyle(
"key_finding", parent=base["Normal"],
fontSize=10, textColor=HexColor("#7B0000"), fontName="Helvetica-Bold",
spaceAfter=3, leading=14
)
styles["page_num"] = ParagraphStyle(
"page_num", parent=base["Normal"],
fontSize=8, textColor=MED_GRAY, alignment=1
)
return styles
# ═══════════════════════════════════════════════════════════════════════════════
# COVER PAGE
# ═══════════════════════════════════════════════════════════════════════════════
class DarkBackground(Flowable):
"""Full-page dark background for cover."""
def __init__(self, w, h):
super().__init__()
self.w = w
self.h = h
def wrap(self, aw, ah):
return self.w, self.h
def draw(self):
c = self.canv
# Gradient background approximation
c.setFillColor(HexColor("#0A0A1A"))
c.rect(0, 0, self.w, self.h, fill=1, stroke=0)
# Decorative ECG-like line across page
c.setStrokeColor(HexColor("#1A5276"))
c.setLineWidth(40)
c.setStrokeAlpha(0.3)
c.line(0, self.h * 0.35, self.w, self.h * 0.35)
c.setStrokeAlpha(1.0)
class DecorativeECGLine(Flowable):
"""A decorative ECG trace used on the cover page."""
def __init__(self, width=6.5*inch, height=0.8*inch):
super().__init__()
self.width = width
self.height = height
def wrap(self, aw, ah):
return self.width, self.height
def draw(self):
c = self.canv
w, h = self.width, self.height
n = 400
mid = h * 0.5
amp = h * 0.40
pts = []
for i in range(n + 1):
t = (i / n) * 6.0
y = ecg_normal_sinus(t, hr=75)
pts.append(((i / n) * w, mid + y * amp))
c.setStrokeColor(HexColor("#00BFFF"))
c.setLineWidth(1.8)
p = c.beginPath()
p.moveTo(pts[0][0], pts[0][1])
for px, py in pts[1:]:
p.lineTo(px, py)
c.drawPath(p, stroke=1, fill=0)
# ═══════════════════════════════════════════════════════════════════════════════
# CASE DATA (10 progressively complex cases)
# ═══════════════════════════════════════════════════════════════════════════════
CASES = [
# ── CASE 1 ────────────────────────────────────────────────────────────────
{
"num": 1,
"difficulty": "EASY",
"diff_style": "diff_easy",
"title": "Case 1 - The Routine Check",
"scenario": (
"A 28-year-old healthy male presents for a pre-employment physical. "
"He denies any symptoms. BP 118/76, HR 72, SpO2 99%. "
"The ECG below was obtained as part of screening."
),
"ecg_func": ecg_normal_sinus,
"ecg_label": "Lead II Rhythm Strip",
"questions": [
"Q1. What is the rhythm?",
"Q2. What is the approximate heart rate?",
"Q3. Describe the PR interval (normal = 0.12-0.20 s).",
"Q4. Are the QRS complexes narrow or wide?",
"Q5. What is your final interpretation?",
],
"answer_title": "Answer: Case 1",
"diagnosis": "Normal Sinus Rhythm (NSR)",
"key_findings": [
"Regular P waves before every QRS, upright in lead II.",
"Rate 60-100 bpm (here ~72 bpm).",
"PR interval 0.12-0.20 s.",
"QRS < 0.12 s (narrow).",
"No ST-T changes.",
],
"teaching": (
"Normal sinus rhythm is the baseline of ECG interpretation. "
"Confirm: (1) P wave before every QRS, (2) regular R-R interval, "
"(3) upright P in leads I and II, (4) rate 60-100 bpm. "
"Every abnormal ECG is defined against this normal template."
),
"image_url": "https://cdn.orris.care/cdss_images/pmc_clinical_VQA_2151fc2dd8926ec5c88bfa0d9417d5ed22acfcd4b0ec972f51a72077d4c8e486.jpg",
},
# ── CASE 2 ────────────────────────────────────────────────────────────────
{
"num": 2,
"difficulty": "EASY",
"diff_style": "diff_easy",
"title": "Case 2 - The Palpitating Student",
"scenario": (
"A 22-year-old female medical student presents to the ED with sudden "
"onset palpitations for 30 minutes. BP 110/70, HR 172, RR 18, SpO2 98%. "
"She denies syncope or chest pain. This rhythm strip was obtained."
),
"ecg_func": ecg_svt,
"ecg_label": "Lead II Rhythm Strip",
"questions": [
"Q1. What is the ventricular rate?",
"Q2. Are the QRS complexes narrow or wide?",
"Q3. Can you identify P waves? If so, where are they?",
"Q4. Is the rhythm regular or irregular?",
"Q5. What is the most likely diagnosis?",
"Q6. What is your initial management step?",
],
"answer_title": "Answer: Case 2",
"diagnosis": "Supraventricular Tachycardia (SVT) - AVNRT most likely",
"key_findings": [
"Regular, narrow-complex tachycardia (~170 bpm).",
"No visible P waves (buried in T wave) or retrograde P waves.",
"Sudden onset 'paroxysmal' nature is characteristic.",
"No delta waves (excludes WPW-mediated AVRT initially).",
"Hemodynamically stable.",
],
"teaching": (
"SVT encompasses AVNRT (most common, ~60%), AVRT, and AT. "
"Acute management: Vagal maneuvers first (Valsalva, carotid sinus massage). "
"If unsuccessful, adenosine 6 mg IV rapid push (12 mg if no response). "
"If unstable, synchronized cardioversion."
),
"image_url": None,
},
# ── CASE 3 ────────────────────────────────────────────────────────────────
{
"num": 3,
"difficulty": "EASY",
"diff_style": "diff_easy",
"title": "Case 3 - Atrial Fibrillation Discovered",
"scenario": (
"A 68-year-old man with hypertension and type 2 diabetes presents "
"for a routine visit. He reports mild fatigue and occasional 'fluttering' "
"in his chest for the past 2 weeks. BP 138/88, HR irregularly irregular ~110."
),
"ecg_func": ecg_afib,
"ecg_label": "Lead II Rhythm Strip",
"questions": [
"Q1. What is the rhythm regularity?",
"Q2. Are P waves visible? What do you see instead?",
"Q3. What is the ventricular rate?",
"Q4. What is the diagnosis?",
"Q5. What score would you use to assess stroke risk?",
"Q6. Name two rate control medications.",
],
"answer_title": "Answer: Case 3",
"diagnosis": "Atrial Fibrillation (AF) with Rapid Ventricular Response",
"key_findings": [
"Irregularly irregular R-R intervals.",
"No distinct P waves; fibrillatory f-waves (350-600 bpm).",
"Variable ventricular rate.",
"Narrow QRS (unless aberrant conduction).",
],
"teaching": (
"AF is the most common sustained cardiac arrhythmia. "
"Stroke risk: CHA2DS2-VASc score (Congestive HF, Hypertension, Age >=75 [x2], "
"Diabetes, Stroke/TIA [x2], Vascular disease, Age 65-74, Sex female). "
"Anticoagulate if score >= 2 (males) or >= 3 (females). "
"Rate control: beta-blockers (metoprolol), CCBs (diltiazem, verapamil), digoxin."
),
"image_url": "https://cdn.orris.care/cdss_images/pmc_clinical_VQA_592a7d4f4c9adbe877d5d637d6fc1ab4f832561260990041c0bbdf7dee23c614.jpg",
},
# ── CASE 4 ────────────────────────────────────────────────────────────────
{
"num": 4,
"difficulty": "MODERATE",
"diff_style": "diff_med",
"title": "Case 4 - Chest Pain in the ED",
"scenario": (
"A 58-year-old male smoker presents to the ED with 45 minutes of crushing "
"substernal chest pain radiating to the left arm. BP 148/92, HR 94, "
"diaphoretic. The 12-lead ECG shows ST elevation in V1-V4 with reciprocal "
"depression in II, III, aVF. Troponin pending. Rhythm strip below."
),
"ecg_func": ecg_stemi,
"ecg_label": "Lead V2 (Precordial) Rhythm Strip",
"questions": [
"Q1. Identify the ST-segment changes in V1-V4.",
"Q2. What territory is affected? Which artery?",
"Q3. What are the reciprocal changes and where are they?",
"Q4. What is the diagnosis?",
"Q5. What are the time-to-treatment targets?",
"Q6. List 4 immediate interventions (MONA+ concept).",
],
"answer_title": "Answer: Case 4",
"diagnosis": "Anterior STEMI - LAD Occlusion",
"key_findings": [
"ST elevation >= 1mm in >=2 contiguous leads (V1-V4).",
"Hyperacute (tall, broad) T waves early sign.",
"Reciprocal ST depression in inferior leads (II, III, aVF).",
"Pathological Q waves may develop within hours.",
"Anterior territory -> Left Anterior Descending (LAD) artery.",
],
"teaching": (
"STEMI localization: V1-V4 Anterior (LAD); II,III,aVF Inferior (RCA/LCx); "
"I,aVL,V5,V6 Lateral (LCx). "
"Door-to-balloon time target: <90 minutes (PCI center) or <120 min (transfer). "
"Immediate Rx: Aspirin 325mg, P2Y12 inhibitor (ticagrelor/clopidogrel), "
"anticoagulation (heparin/bivalirudin), supplemental O2 if SpO2 <90%, "
"nitroglycerin (avoid if RV infarct, hypotension), morphine (use cautiously), "
"emergent PCI or fibrinolysis if PCI unavailable."
),
"image_url": "https://cdn.orris.care/cdss_images/pmc_clinical_VQA_16738d4b125195130b5e53a811645d4064182fc2bbd0de16b0e00a57af7ff6ef.jpg",
},
# ── CASE 5 ────────────────────────────────────────────────────────────────
{
"num": 5,
"difficulty": "MODERATE",
"diff_style": "diff_med",
"title": "Case 5 - The Wide Complex Mystery",
"scenario": (
"A 45-year-old woman with known ischemic cardiomyopathy (EF 30%) "
"is brought in by EMS after sudden collapse. She is conscious but "
"diaphoretic. BP 88/60, HR 172. Monitor shows regular wide-complex tachycardia."
),
"ecg_func": ecg_vt,
"ecg_label": "Rhythm Strip - Wide Complex Tachycardia",
"questions": [
"Q1. What is the QRS duration (estimate: narrow <0.12s, wide >0.12s)?",
"Q2. Name 4 features that favor VT over SVT with aberrancy.",
"Q3. Given the clinical context, what is the most likely diagnosis?",
"Q4. The patient is hemodynamically unstable. What is first-line treatment?",
"Q5. If the patient were stable, name 2 pharmacologic options.",
],
"answer_title": "Answer: Case 5",
"diagnosis": "Ventricular Tachycardia (VT) - Monomorphic",
"key_findings": [
"Wide QRS (>0.12 s), regular, rate ~170 bpm.",
"AV dissociation (P waves independent of QRS) - pathognomonic for VT.",
"Fusion beats and capture beats if seen confirm VT.",
"Brugada criteria / Vereckei algorithm support VT.",
"Known structural heart disease (low EF) strongly favors VT.",
],
"teaching": (
"Rule: Wide complex tachycardia = VT until proven otherwise, especially "
"with structural heart disease. "
"Unstable VT -> Synchronized cardioversion (100-200J biphasic). "
"Stable monomorphic VT -> Amiodarone 150mg IV over 10 min, then infusion; "
"or procainamide 17mg/kg IV at 50mg/min. "
"Never give verapamil/diltiazem for wide-complex tachycardia (may cause arrest)."
),
"image_url": "https://cdn.orris.care/cdss_images/pmc_clinical_VQA_2cfc27856259d0a459799c8b34e1b8e53f1d9e8ebcf8a2264e4f7c75d4ca0100.jpg",
},
# ── CASE 6 ────────────────────────────────────────────────────────────────
{
"num": 6,
"difficulty": "MODERATE",
"diff_style": "diff_med",
"title": "Case 6 - The Syncopal Episode",
"scenario": (
"A 72-year-old man with a history of inferior MI 10 years ago is "
"brought in after a syncopal episode. He is bradycardic. "
"BP 90/60, HR 36. The ECG shows P waves and QRS complexes occurring "
"independently at different rates."
),
"ecg_func": ecg_chb,
"ecg_label": "Lead II - AV Dissociation Rhythm Strip",
"questions": [
"Q1. What are the atrial and ventricular rates?",
"Q2. What is the PR interval relationship beat to beat?",
"Q3. What is the diagnosis?",
"Q4. What type of escape rhythm is present (junctional vs ventricular)?",
"Q5. What is the definitive treatment?",
"Q6. What is the bridge therapy while awaiting definitive treatment?",
],
"answer_title": "Answer: Case 6",
"diagnosis": "Complete (Third-Degree) AV Heart Block",
"key_findings": [
"Complete AV dissociation: P waves and QRS completely independent.",
"Atrial rate ~75 bpm (normal sinus), ventricular rate ~30-40 bpm.",
"Ventricular escape rhythm: wide QRS (infranodal) = ventricular origin.",
"Narrow escape QRS = junctional (higher, more stable).",
"Hemodynamic compromise: hypotension, syncope.",
],
"teaching": (
"Third-degree AV block: no impulse conducted from atria to ventricles. "
"Causes: inferior MI (transient, nodal), anterior MI (permanent, infranodal), "
"Lyme disease, infiltrative disease, medication toxicity. "
"Temporary: atropine 0.5-1mg IV (less effective with infranodal block), "
"transcutaneous pacing (immediate), dopamine/epinephrine infusion. "
"Definitive: permanent pacemaker implantation."
),
"image_url": "https://cdn.orris.care/cdss_images/pmc_clinical_VQA_11ac037ff7836678ddd7fad143600ed71c2a3910d226a34ea257a3618beab0a5.jpg",
},
# ── CASE 7 ────────────────────────────────────────────────────────────────
{
"num": 7,
"difficulty": "MODERATE",
"diff_style": "diff_med",
"title": "Case 7 - The Young Athlete",
"scenario": (
"A 19-year-old competitive basketball player undergoes pre-participation "
"screening. He denies symptoms. The ECG shows short PR interval (~0.10s), "
"a slurred upstroke at the start of the QRS (delta wave), and a wide QRS. "
"HR 78, BP 122/78."
),
"ecg_func": ecg_wpw,
"ecg_label": "Lead I - Pre-excitation Pattern",
"questions": [
"Q1. What are the three classic ECG features of this syndrome?",
"Q2. What is the diagnosis?",
"Q3. What life-threatening arrhythmia can this syndrome cause?",
"Q4. Why is digoxin contraindicated?",
"Q5. What diagnostic test determines risk stratification?",
],
"answer_title": "Answer: Case 7",
"diagnosis": "Wolff-Parkinson-White (WPW) Syndrome",
"key_findings": [
"Short PR interval (<0.12 s) due to pre-excitation.",
"Delta wave: slurred initial QRS upstroke.",
"Wide QRS (fusion of AP and normal conduction).",
"Secondary ST-T changes (discordant).",
"Pseudo-infarct pattern may mimic MI (false Q waves).",
],
"teaching": (
"WPW: accessory pathway (bundle of Kent) bypasses AV node. "
"Risk: AF with rapid conduction down AP -> VF and sudden death "
"(especially if shortest pre-excited RR interval <250ms in AF). "
"Digoxin and verapamil are CONTRAINDICATED (accelerate AP conduction). "
"Acute AVRT: adenosine, procainamide. "
"Long-term: radiofrequency catheter ablation (curative, >95% success)."
),
"image_url": "https://cdn.orris.care/cdss_images/pmc_clinical_VQA_66d810327493e335af836ce99df9a9af2a653edc3df5df5ee977c826562d3ff8.jpg",
},
# ── CASE 8 ────────────────────────────────────────────────────────────────
{
"num": 8,
"difficulty": "HARD",
"diff_style": "diff_hard",
"title": "Case 8 - The Dialysis Patient",
"scenario": (
"A 55-year-old man on hemodialysis for ESRD missed two dialysis sessions. "
"He presents with weakness and palpitations. Potassium level returns at 7.2 mEq/L. "
"BP 162/98, HR 68, SpO2 97%. The ECG shows characteristic changes."
),
"ecg_func": ecg_hyperkalemia,
"ecg_label": "Lead V4 - Electrolyte Changes",
"questions": [
"Q1. What are the ECG changes in order of progression with rising K+?",
"Q2. What specific T-wave morphology is described here?",
"Q3. What finding indicates imminent risk of cardiac arrest?",
"Q4. Name 5 treatments for hyperkalemia (include mechanism).",
"Q5. Which treatment is fastest acting and how long does it last?",
],
"answer_title": "Answer: Case 8",
"diagnosis": "Severe Hyperkalemia (K+ 7.2 mEq/L) with ECG Changes",
"key_findings": [
"Peaked, narrow, symmetric 'tented' T waves (early sign, K+ 5.5-6.5).",
"Flat/absent P waves (K+ 6.5-7.0).",
"Prolonged PR interval -> widened QRS.",
"Sine-wave pattern (K+ >7.0) - pre-arrest.",
"Ventricular fibrillation / asystole (K+ >8.0).",
],
"teaching": (
"Hyperkalemia ECG progression: Peaked T -> Flat P -> Wide QRS -> Sine wave -> VF/asystole.\n"
"Treatment (K+ 6.5+ or with ECG changes):\n"
"1. Calcium gluconate 1g IV (membrane stabilization, acts in 2-3 min, lasts 30-60 min)\n"
"2. Insulin 10U + Dextrose 50g IV (shift K+ into cells, 30 min)\n"
"3. Sodium bicarbonate (alkalosis shifts K+ intracellularly)\n"
"4. Albuterol 10-20mg nebulized (shift K+ intracellularly)\n"
"5. Kayexalate/Patiromer/SZC (GI elimination, hours)\n"
"6. Furosemide IV (renal excretion)\n"
"7. Dialysis (definitive in ESRD)"
),
"image_url": "https://cdn.orris.care/cdss_images/pmc_clinical_VQA_0e4bd03ffc3858d2de708753614934bc362a034d58a5c5794a71656f8a47c44b.jpg",
},
# ── CASE 9 ────────────────────────────────────────────────────────────────
{
"num": 9,
"difficulty": "HARD",
"diff_style": "diff_hard",
"title": "Case 9 - The New Left Bundle",
"scenario": (
"A 66-year-old woman with no prior cardiac history presents with "
"acute-onset chest pain and dyspnea for 2 hours. BP 140/88, HR 88. "
"The ECG shows a broad, notched R in V5/V6, deep S in V1, "
"no septal Q waves in lateral leads. This is NEW compared to a prior ECG. "
"Troponin is pending."
),
"ecg_func": ecg_lbbb,
"ecg_label": "Lead V5 - Bundle Branch Pattern",
"questions": [
"Q1. Describe the LBBB diagnostic criteria.",
"Q2. Why is new LBBB with acute chest pain treated as STEMI-equivalent?",
"Q3. What is the Sgarbossa criteria? List the 3 components.",
"Q4. Is this patient a candidate for emergent catheterization?",
"Q5. Why can you NOT use standard ST-segment criteria in LBBB?",
],
"answer_title": "Answer: Case 9",
"diagnosis": "New Left Bundle Branch Block (LBBB) - STEMI Equivalent",
"key_findings": [
"LBBB criteria: QRS >=0.12s, broad notched R in V5/V6/I/aVL, deep S in V1.",
"No septal Q in I, V5, V6 (loss of normal septal activation vector).",
"Secondary discordant ST-T changes (expected in LBBB).",
"New LBBB in context of chest pain = presumed STEMI equivalent.",
"Sgarbossa criteria identify MI within LBBB.",
],
"teaching": (
"Sgarbossa Criteria (each positive finding = STEMI in LBBB):\n"
"1. Concordant ST elevation >=1mm in leads with positive QRS (score 5)\n"
"2. Concordant ST depression >=1mm in V1-V3 (score 3)\n"
"3. Discordant ST elevation >5mm in leads with negative QRS (score 2) [Modified: ST/S ratio >0.25]\n"
"Score >=3 = high specificity for AMI.\n"
"New LBBB with ischemic symptoms -> activate cath lab (Class I indication per guidelines)."
),
"image_url": None,
},
# ── CASE 10 ───────────────────────────────────────────────────────────────
{
"num": 10,
"difficulty": "HARD",
"diff_style": "diff_hard",
"title": "Case 10 - The Long QT and Torsades",
"scenario": (
"A 38-year-old woman taking sotalol for persistent AF is brought in "
"after witnessed collapse. She was resuscitated. During monitoring she "
"has recurrent salvos of a twisting wide-complex tachycardia, each "
"initiated by a long-short sequence. QTc on baseline was 560ms."
),
"ecg_func": ecg_torsades,
"ecg_label": "Rhythm Strip - Polymorphic VT",
"questions": [
"Q1. What is the ECG diagnosis of this arrhythmia?",
"Q2. What QTc value is considered prolonged (male vs female)?",
"Q3. List 5 common causes of acquired long QT.",
"Q4. What is first-line treatment for this specific arrhythmia?",
"Q5. What medications must be stopped immediately?",
"Q6. What pacing strategy may prevent recurrence?",
],
"answer_title": "Answer: Case 10",
"diagnosis": "Torsades de Pointes (TdP) - Acquired Long QT Syndrome",
"key_findings": [
"Twisting QRS axis around isoelectric baseline ('twisting of points').",
"Rate 200-250 bpm, often self-terminating but can degenerate to VF.",
"Initiated by long-short RR sequence (pause-dependent).",
"Preceded by prolonged QTc (>500ms confers highest risk).",
"Polymorphic VT (as opposed to monomorphic VT in Case 5).",
],
"teaching": (
"Acquired QT prolongation causes: Drugs (Class Ia/III antiarrhythmics, "
"haloperidol, macrolides, fluoroquinolones, methadone, ondansetron), "
"Hypokalemia, Hypomagnesemia, Hypocalcemia, Bradycardia, Intracranial events.\n"
"Treatment of TdP:\n"
"1. IV Magnesium sulfate 2g over 1-2 min (FIRST LINE even if Mg normal)\n"
"2. Correct electrolytes (K+ to 4.5-5 mEq/L, Ca2+, Mg2+ to high-normal)\n"
"3. Stop offending drug immediately\n"
"4. Isoproterenol infusion (shorten QT by increasing HR)\n"
"5. Overdrive pacing at 90-120 bpm (prevents pause-dependent TdP)\n"
"6. AVOID amiodarone (prolongs QT further)"
),
"image_url": None,
},
]
# ═══════════════════════════════════════════════════════════════════════════════
# ECG WAVE REFERENCE TABLE (front-of-book)
# ═══════════════════════════════════════════════════════════════════════════════
REFERENCE_TABLE_DATA = [
["Wave/Interval", "Normal Duration", "Clinical Significance"],
["P wave", "< 0.12 s (< 3 small sq)", "Atrial depolarization\nBroad = left atrial enlargement\nTall = right atrial enlargement"],
["PR interval", "0.12 – 0.20 s", "AV conduction time\n<0.12 = pre-excitation (WPW)\n>0.20 = 1st degree AV block"],
["QRS complex", "0.06 – 0.10 s", "Ventricular depolarization\n>0.12 = bundle branch block or VT"],
["QT interval", "0.36 – 0.44 s (rate-adj)", "Ventricular repolarization\nQTc >440ms M / >460ms F = prolonged\nQTc >500ms = high TdP risk"],
["ST segment", "Isoelectric ± 0.5mm", "Ventricular repolarization plateau\nElevation = STEMI / pericarditis\nDepression = ischemia / NSTEMI"],
["T wave", "Same polarity as QRS", "Ventricular repolarization\nInverted = ischemia / strain\nPeaked narrow = hyperkalemia\nFlat/inverted: hypokalemia"],
["U wave", "Small, follows T wave", "Purkinje repolarization\nProminent U: hypokalemia, bradycardia"],
]
LOCALIZATION_TABLE = [
["Territory", "Leads with Changes", "Artery", "Notes"],
["Anterior", "V1-V4", "LAD", "Largest territory; worst prognosis"],
["Inferior", "II, III, aVF", "RCA (80%)\nLCx (20%)", "Check V4R for RV involvement"],
["Lateral", "I, aVL, V5-V6", "LCx / OM", "Isolated lateral: smaller OM branch"],
["Posterior", "Reciprocal changes\nV1-V3 (ST depr,\ntall R, upright T)", "RCA / LCx", "Get posterior leads V7-V9"],
["Septal", "V1-V2", "LAD septals", "Often with anterior MI"],
["RV Infarct", "ST elev V4R", "Proximal RCA", "Avoid nitrates; give IV fluids"],
]
# ═══════════════════════════════════════════════════════════════════════════════
# BUILD PDF
# ═══════════════════════════════════════════════════════════════════════════════
def build_pdf(output_path):
doc = SimpleDocTemplate(
output_path,
pagesize=letter,
leftMargin=0.65*inch,
rightMargin=0.65*inch,
topMargin=0.65*inch,
bottomMargin=0.65*inch,
)
styles = make_styles()
story = []
# ── COVER ─────────────────────────────────────────────────────────────────
# Dark background via a big table
cover_data = [
[Paragraph("", styles["cover_title"])],
]
cover_bg = Table(
[[Paragraph(
"<font color='#001133'> </font>",
styles["body"]
)]],
colWidths=[PAGE_W - 1.3*inch],
rowHeights=[PAGE_H - 1.3*inch],
)
cover_bg.setStyle(TableStyle([
("BACKGROUND", (0,0), (-1,-1), HexColor("#0A0A1A")),
("VALIGN", (0,0), (-1,-1), "MIDDLE"),
]))
# Build cover elements in a table for centering
cover_content = []
cover_content.append(Spacer(1, 0.5*inch))
cover_content.append(DecorativeECGLine(width=6.5*inch, height=0.7*inch))
cover_content.append(Spacer(1, 0.2*inch))
cover_content.append(Paragraph(
"<font color='#00BFFF'>ECG MASTERY</font>",
styles["cover_title"]
))
cover_content.append(Paragraph(
"<font color='#AADDFF'>Practice Workbook</font>",
ParagraphStyle("cs2", fontSize=22, textColor=HexColor("#AADDFF"),
alignment=1, fontName="Helvetica-Bold")
))
cover_content.append(Spacer(1, 0.15*inch))
cover_content.append(HRFlowable(
width="80%", thickness=2, color=HexColor("#E94560"),
lineCap="round", spaceAfter=10, spaceBefore=4
))
cover_content.append(Paragraph(
"<font color='#CCDDFF'>10 Real-World Cases | Simple to Complex</font>",
styles["cover_sub"]
))
cover_content.append(Paragraph(
"<font color='#AABBCC'>Normal Sinus Rhythm • SVT • Atrial Fibrillation • STEMI<br/>"
"Ventricular Tachycardia • Complete Heart Block • WPW<br/>"
"Hyperkalemia • LBBB • Torsades de Pointes</font>",
styles["cover_note"]
))
cover_content.append(Spacer(1, 0.2*inch))
cover_content.append(DecorativeECGLine(width=6.5*inch, height=0.5*inch))
cover_content.append(Spacer(1, 0.3*inch))
cover_content.append(Paragraph(
"<font color='#667799'>Includes: ECG Strips • Clinical Scenarios • Answer Key<br/>"
"Reference Tables • Teaching Points</font>",
ParagraphStyle("cn2", fontSize=10, textColor=HexColor("#667799"),
alignment=1)
))
cover_content.append(Spacer(1, 0.15*inch))
cover_content.append(Paragraph(
"<font color='#445566'>For educational purposes only | August 2026</font>",
ParagraphStyle("cn3", fontSize=8, textColor=HexColor("#445566"),
alignment=1)
))
# Wrap cover in a dark-background table
cover_outer = Table(
[[cover_content]],
colWidths=[PAGE_W - 1.3*inch],
)
cover_outer.setStyle(TableStyle([
("BACKGROUND", (0,0), (-1,-1), HexColor("#0A0A1A")),
("VALIGN", (0,0), (-1,-1), "TOP"),
("TOPPADDING", (0,0), (-1,-1), 20),
("BOTTOMPADDING", (0,0), (-1,-1), 20),
("LEFTPADDING", (0,0), (-1,-1), 20),
("RIGHTPADDING", (0,0), (-1,-1), 20),
]))
story.append(cover_outer)
story.append(PageBreak())
# ── TABLE OF CONTENTS ─────────────────────────────────────────────────────
story.append(Paragraph("Table of Contents", styles["chapter"]))
story.append(Spacer(1, 0.1*inch))
toc_data = [
["Section", "Topic", "Difficulty", "Page"],
["How to Use This Workbook", "ECG Interpretation Framework", "", "3"],
["Quick Reference", "Normal Intervals & STEMI Localization", "", "4"],
]
for c in CASES:
toc_data.append([
f"Case {c['num']}",
c["title"].split(" - ", 1)[-1],
c["difficulty"],
"",
])
toc_data.append(["Answer Key", "All Cases - Full Explanations", "", ""])
toc_table = Table(toc_data, colWidths=[1.1*inch, 3.8*inch, 1.0*inch, 0.6*inch])
toc_style = TableStyle([
("BACKGROUND", (0,0), (-1,0), SECTION_HEAD),
("TEXTCOLOR", (0,0), (-1,0), WHITE),
("FONTNAME", (0,0), (-1,0), "Helvetica-Bold"),
("FONTSIZE", (0,0), (-1,0), 10),
("ROWBACKGROUNDS", (0,1), (-1,-1), [WHITE, LIGHT_GRAY]),
("FONTSIZE", (0,1), (-1,-1), 9),
("GRID", (0,0), (-1,-1), 0.5, HexColor("#CCCCCC")),
("VALIGN", (0,0), (-1,-1), "MIDDLE"),
("TOPPADDING", (0,0), (-1,-1), 4),
("BOTTOMPADDING", (0,0), (-1,-1), 4),
])
# Color difficulty cells
diff_colors = {"EASY": EASY_GREEN, "MODERATE": MED_ORANGE, "HARD": HARD_RED}
for i, c in enumerate(CASES):
row = i + 3 # header + 2 intro rows + case rows
col = 2
col_color = diff_colors.get(c["difficulty"], MED_GRAY)
toc_style.add("BACKGROUND", (col, row), (col, row), col_color)
toc_style.add("TEXTCOLOR", (col, row), (col, row), WHITE)
toc_style.add("FONTNAME", (col, row), (col, row), "Helvetica-Bold")
toc_table.setStyle(toc_style)
story.append(toc_table)
story.append(PageBreak())
# ── HOW TO USE ────────────────────────────────────────────────────────────
story.append(Paragraph("How to Use This Workbook", styles["chapter"]))
story.append(Spacer(1, 0.1*inch))
story.append(Paragraph("ECG Interpretation - Systematic Approach (The 8-Step Method)", styles["section"]))
steps = [
("1. Rate", "Count R-R intervals. Normal 60-100 bpm. Fast: >100 (tachycardia). Slow: <60 (bradycardia)."),
("2. Regularity", "Are R-R intervals equal? Regular, regularly irregular, or irregularly irregular?"),
("3. P Waves", "Present? Morphology normal? Upright in I and II? One P per QRS?"),
("4. PR Interval", "0.12-0.20 s. Short = pre-excitation. Long = AV block. Variable = Mobitz I/CHB."),
("5. QRS Complex", "Width: narrow (<0.12 s) or wide (>0.12 s)? Morphology? Axis?"),
("6. ST Segment", "Elevation or depression? In which leads? Contiguous? Reciprocal changes?"),
("7. T Waves", "Upright (normal). Inverted = ischemia/strain. Peaked = hyperkalemia. Flat = hypokalemia."),
("8. QT Interval", "Measure QTc. >440ms (male) or >460ms (female) = prolonged. >500ms = high risk TdP."),
]
for step_name, step_desc in steps:
row_data = [
Paragraph(f"<b>{step_name}</b>", styles["body"]),
Paragraph(step_desc, styles["body_sm"]),
]
t = Table([row_data], colWidths=[1.4*inch, 5.1*inch])
t.setStyle(TableStyle([
("BACKGROUND", (0,0), (0,0), ACCENT_BLUE),
("TEXTCOLOR", (0,0), (0,0), WHITE),
("FONTNAME", (0,0), (0,0), "Helvetica-Bold"),
("VALIGN", (0,0), (-1,-1), "TOP"),
("TOPPADDING", (0,0), (-1,-1), 5),
("BOTTOMPADDING", (0,0), (-1,-1), 5),
("LEFTPADDING", (0,0), (-1,-1), 6),
("RIGHTPADDING", (0,0), (-1,-1), 6),
("GRID", (0,0), (-1,-1), 0.5, HexColor("#CCCCCC")),
]))
story.append(t)
story.append(Spacer(1, 2))
story.append(Spacer(1, 0.15*inch))
story.append(Paragraph("ECG Paper Calibration", styles["section"]))
cal_data = [
["Standard Speed", "25 mm/sec", "Small square (1mm) = 0.04 seconds\nLarge square (5mm) = 0.20 seconds"],
["Standard Gain", "10 mm/mV", "Small square (1mm) = 0.1 mV\nLarge square (5mm) = 0.5 mV"],
["Rate (regular)", "300 / # large squares between R-R",
"1 large sq = 300 bpm | 2 = 150 | 3 = 100 | 4 = 75 | 5 = 60 | 6 = 50"],
["Rate (irregular)", "Count complexes in 10s strip x 6",
"Or count in 6s strip x 10"],
]
cal_table = Table(cal_data, colWidths=[1.4*inch, 1.6*inch, 3.5*inch])
cal_table.setStyle(TableStyle([
("BACKGROUND", (0,0), (0,-1), HexColor("#003366")),
("TEXTCOLOR", (0,0), (0,-1), WHITE),
("FONTNAME", (0,0), (0,-1), "Helvetica-Bold"),
("ROWBACKGROUNDS", (0,0), (-1,-1), [HexColor("#EEF5FF"), WHITE]),
("FONTSIZE", (0,0), (-1,-1), 9),
("GRID", (0,0), (-1,-1), 0.5, HexColor("#AAAACC")),
("VALIGN", (0,0), (-1,-1), "TOP"),
("TOPPADDING", (0,0), (-1,-1), 4),
("BOTTOMPADDING", (0,0), (-1,-1), 4),
("LEFTPADDING", (0,0), (-1,-1), 5),
("RIGHTPADDING", (0,0), (-1,-1), 5),
]))
story.append(cal_table)
story.append(PageBreak())
# ── QUICK REFERENCE ───────────────────────────────────────────────────────
story.append(Paragraph("Quick Reference Tables", styles["chapter"]))
story.append(Spacer(1, 0.1*inch))
story.append(Paragraph("Normal ECG Intervals", styles["section"]))
ref_table = Table(REFERENCE_TABLE_DATA, colWidths=[1.4*inch, 1.5*inch, 3.6*inch])
ref_table.setStyle(TableStyle([
("BACKGROUND", (0,0), (-1,0), SECTION_HEAD),
("TEXTCOLOR", (0,0), (-1,0), WHITE),
("FONTNAME", (0,0), (-1,0), "Helvetica-Bold"),
("FONTSIZE", (0,0), (-1,0), 10),
("ROWBACKGROUNDS", (0,1), (-1,-1), [WHITE, LIGHT_GRAY]),
("FONTSIZE", (0,1), (-1,-1), 8.5),
("GRID", (0,0), (-1,-1), 0.5, HexColor("#CCCCCC")),
("VALIGN", (0,0), (-1,-1), "TOP"),
("TOPPADDING", (0,0), (-1,-1), 4),
("BOTTOMPADDING", (0,0), (-1,-1), 4),
("LEFTPADDING", (0,0), (-1,-1), 5),
("RIGHTPADDING", (0,0), (-1,-1), 5),
]))
story.append(ref_table)
story.append(Spacer(1, 0.2*inch))
story.append(Paragraph("STEMI Localization Map", styles["section"]))
loc_table = Table(LOCALIZATION_TABLE, colWidths=[1.0*inch, 1.5*inch, 1.4*inch, 2.6*inch])
loc_table.setStyle(TableStyle([
("BACKGROUND", (0,0), (-1,0), HARD_RED),
("TEXTCOLOR", (0,0), (-1,0), WHITE),
("FONTNAME", (0,0), (-1,0), "Helvetica-Bold"),
("FONTSIZE", (0,0), (-1,0), 10),
("ROWBACKGROUNDS", (0,1), (-1,-1), [WHITE, HexColor("#FFF0F0")]),
("FONTSIZE", (0,1), (-1,-1), 8.5),
("GRID", (0,0), (-1,-1), 0.5, HexColor("#CCCCCC")),
("VALIGN", (0,0), (-1,-1), "TOP"),
("TOPPADDING", (0,0), (-1,-1), 4),
("BOTTOMPADDING", (0,0), (-1,-1), 4),
("LEFTPADDING", (0,0), (-1,-1), 5),
("RIGHTPADDING", (0,0), (-1,-1), 5),
]))
story.append(loc_table)
story.append(PageBreak())
# ── CASES ─────────────────────────────────────────────────────────────────
for case in CASES:
# Case header bar
diff_bg = {"EASY": EASY_GREEN, "MODERATE": MED_ORANGE, "HARD": HARD_RED}
bg = diff_bg.get(case["difficulty"], MED_GRAY)
header_table = Table(
[[Paragraph(f"<font color='white'><b>{case['title']}</b></font>",
styles["body"]),
Paragraph(f"<font color='white'><b>{case['difficulty']}</b></font>",
ParagraphStyle("dh", fontSize=9, textColor=WHITE,
fontName="Helvetica-Bold", alignment=2))]],
colWidths=[5.4*inch, 1.1*inch]
)
header_table.setStyle(TableStyle([
("BACKGROUND", (0,0), (-1,-1), ACCENT_BLUE),
("BACKGROUND", (1,0), (1,0), bg),
("VALIGN", (0,0), (-1,-1), "MIDDLE"),
("TOPPADDING", (0,0), (-1,-1), 7),
("BOTTOMPADDING", (0,0), (-1,-1), 7),
("LEFTPADDING", (0,0), (-1,-1), 8),
("RIGHTPADDING", (0,0), (-1,-1), 8),
]))
story.append(header_table)
story.append(Spacer(1, 6))
# Clinical scenario box
scenario_table = Table(
[[Paragraph(f"<b>Clinical Scenario:</b><br/>{case['scenario']}",
styles["clinical_box"])]],
colWidths=[6.5*inch]
)
scenario_table.setStyle(TableStyle([
("BACKGROUND", (0,0), (-1,-1), HexColor("#EBF5FB")),
("BOX", (0,0), (-1,-1), 1, HexColor("#5DADE2")),
("TOPPADDING", (0,0), (-1,-1), 8),
("BOTTOMPADDING", (0,0), (-1,-1), 8),
("LEFTPADDING", (0,0), (-1,-1), 10),
("RIGHTPADDING", (0,0), (-1,-1), 10),
]))
story.append(scenario_table)
story.append(Spacer(1, 8))
# ECG Strip
story.append(ECGStrip(
case["ecg_func"],
label=f" {case['ecg_label']} (Synthetic representative tracing)",
width=6.5*inch,
height=1.2*inch,
duration=4.5,
color=ECG_LINE2,
))
story.append(Spacer(1, 8))
# Real ECG image (if available)
if case.get("image_url"):
story.append(Paragraph("Real-World ECG Reference:", styles["bold"]))
img = download_image(case["image_url"], 6.5*inch, 2.0*inch)
if img:
img_table = Table([[img]], colWidths=[6.5*inch])
img_table.setStyle(TableStyle([
("BOX", (0,0), (-1,-1), 1, HexColor("#AAAAAA")),
("ALIGN", (0,0), (-1,-1), "CENTER"),
]))
story.append(img_table)
story.append(Spacer(1, 6))
# Questions
story.append(Paragraph("Questions:", styles["section"]))
q_items = []
for q in case["questions"]:
q_items.append([
Paragraph(q, styles["body"]),
Paragraph("_" * 55, ParagraphStyle(
"ans_line", fontSize=9, textColor=HexColor("#AAAAAA")))
])
q_items.append([Spacer(1, 2), Spacer(1, 2)])
q_table = Table(q_items, colWidths=[2.5*inch, 4.0*inch])
q_table.setStyle(TableStyle([
("VALIGN", (0,0), (-1,-1), "TOP"),
("TOPPADDING", (0,0), (-1,-1), 3),
("BOTTOMPADDING", (0,0), (-1,-1), 3),
("LEFTPADDING", (0,0), (-1,-1), 4),
]))
story.append(q_table)
story.append(PageBreak())
# ── ANSWER KEY ────────────────────────────────────────────────────────────
story.append(Paragraph("ANSWER KEY", styles["chapter"]))
story.append(Spacer(1, 6))
story.append(Paragraph(
"The following section provides complete answers, key ECG findings, and "
"teaching points for all 10 cases. Review your answers after completing "
"each case before reading ahead.",
styles["body"]
))
story.append(Spacer(1, 0.1*inch))
for case in CASES:
diff_bg = {"EASY": EASY_GREEN, "MODERATE": MED_ORANGE, "HARD": HARD_RED}
bg = diff_bg.get(case["difficulty"], MED_GRAY)
ans_header = Table(
[[Paragraph(f"<font color='white'><b>{case['answer_title']}</b></font>",
styles["body"]),
Paragraph(f"<font color='white'><b>Diagnosis: {case['diagnosis']}</b></font>",
ParagraphStyle("ah2", fontSize=9, textColor=WHITE,
fontName="Helvetica-Bold", alignment=2))]],
colWidths=[2.5*inch, 4.0*inch]
)
ans_header.setStyle(TableStyle([
("BACKGROUND", (0,0), (-1,-1), bg),
("VALIGN", (0,0), (-1,-1), "MIDDLE"),
("TOPPADDING", (0,0), (-1,-1), 6),
("BOTTOMPADDING", (0,0), (-1,-1), 6),
("LEFTPADDING", (0,0), (-1,-1), 8),
("RIGHTPADDING", (0,0), (-1,-1), 8),
]))
story.append(ans_header)
story.append(Spacer(1, 4))
# Key findings
findings_text = "<b>Key ECG Findings:</b><br/>"
for f in case["key_findings"]:
findings_text += f"• {f}<br/>"
findings_table = Table(
[[Paragraph(findings_text, styles["answer_box"])]],
colWidths=[6.5*inch]
)
findings_table.setStyle(TableStyle([
("BACKGROUND", (0,0), (-1,-1), HexColor("#F0FFF0")),
("BOX", (0,0), (-1,-1), 1, HexColor("#27AE60")),
("TOPPADDING", (0,0), (-1,-1), 6),
("BOTTOMPADDING", (0,0), (-1,-1), 6),
("LEFTPADDING", (0,0), (-1,-1), 10),
("RIGHTPADDING", (0,0), (-1,-1), 10),
]))
story.append(findings_table)
story.append(Spacer(1, 4))
# Teaching point
teach_text = f"<b>Teaching Point:</b><br/>{case['teaching'].replace(chr(10), '<br/>')}"
teach_table = Table(
[[Paragraph(teach_text, styles["body_sm"])]],
colWidths=[6.5*inch]
)
teach_table.setStyle(TableStyle([
("BACKGROUND", (0,0), (-1,-1), HexColor("#FFF8E7")),
("BOX", (0,0), (-1,-1), 1, HexColor("#F5A623")),
("TOPPADDING", (0,0), (-1,-1), 6),
("BOTTOMPADDING", (0,0), (-1,-1), 6),
("LEFTPADDING", (0,0), (-1,-1), 10),
("RIGHTPADDING", (0,0), (-1,-1), 10),
]))
story.append(teach_table)
story.append(Spacer(1, 0.15*inch))
story.append(HRFlowable(
width="100%", thickness=0.5, color=HexColor("#CCCCCC"),
spaceAfter=8, spaceBefore=4
))
# ── FINAL PAGE: Drug / Arrhythmia Quick Card ──────────────────────────────
story.append(PageBreak())
story.append(Paragraph("Antiarrhythmic Drug Quick Reference", styles["chapter"]))
story.append(Spacer(1, 0.1*inch))
drug_data = [
["Drug", "Class", "Mechanism", "Use", "Key Caution"],
["Adenosine", "—", "Blocks AV node transiently", "Terminate SVT/AVRT", "Contraindicated in WPW+AF, asthma"],
["Metoprolol", "II", "Beta-1 blockade", "Rate control AF, SVT", "Avoid in decompensated HF, bradycardia"],
["Amiodarone", "III", "K+ channel block + multi-channel", "VT, AF conversion", "Thyroid, pulmonary, hepatic toxicity"],
["Lidocaine", "Ib", "Na+ channel block", "Stable VT (2nd line)", "Ineffective in AF; CNS toxicity"],
["Procainamide", "Ia", "Na+ channel block, QT prolongation","VT, WPW+AF", "Avoid in LQTS; hypotension IV"],
["Sotalol", "III", "K+ channel + beta block", "AF maintenance, VT", "Prolongs QT -> TdP risk"],
["Verapamil", "IV", "Ca2+ channel block", "Rate control AF, SVT", "NEVER in WPW, wide-complex tachycardia"],
["Digoxin", "—", "Vagal tone, Na/K-ATPase inhibit", "Rate control AF (chronic)", "Narrow therapeutic window; AVOID WPW"],
["Atropine", "—", "Anticholinergic (increases HR)", "Symptomatic bradycardia", "Less effective in infranodal block"],
["Magnesium", "—", "Membrane stabilization", "TdP (FIRST LINE), VF", "Caution in renal failure"],
]
drug_table = Table(drug_data, colWidths=[1.1*inch, 0.55*inch, 1.6*inch, 1.5*inch, 1.75*inch])
drug_table.setStyle(TableStyle([
("BACKGROUND", (0,0), (-1,0), SECTION_HEAD),
("TEXTCOLOR", (0,0), (-1,0), WHITE),
("FONTNAME", (0,0), (-1,0), "Helvetica-Bold"),
("FONTSIZE", (0,0), (-1,0), 9),
("ROWBACKGROUNDS", (0,1), (-1,-1), [WHITE, LIGHT_GRAY]),
("FONTSIZE", (0,1), (-1,-1), 8),
("GRID", (0,0), (-1,-1), 0.5, HexColor("#CCCCCC")),
("VALIGN", (0,0), (-1,-1), "TOP"),
("TOPPADDING", (0,0), (-1,-1), 3),
("BOTTOMPADDING", (0,0), (-1,-1), 3),
("LEFTPADDING", (0,0), (-1,-1), 4),
("RIGHTPADDING", (0,0), (-1,-1), 4),
]))
story.append(drug_table)
story.append(Spacer(1, 0.2*inch))
story.append(Paragraph("ECG Mastery Tips", styles["section"]))
tips = [
"Never treat an ECG in isolation - always correlate with the clinical picture.",
"Wide-complex tachycardia = VT until proven otherwise, especially in structural heart disease.",
"When in doubt about SVT vs VT: treat as VT (safer).",
"Always get an old ECG for comparison - 'new' changes matter most.",
"Posterior MI is commonly missed - always look for reciprocal changes in V1-V3.",
"Right ventricular infarction: get V4R, and withhold nitrates + give IV fluids.",
"QTc >500ms: stop offending drugs, correct electrolytes, consider TdP prophylaxis.",
"Sgarbossa criteria: use to unmask MI hidden within LBBB pattern.",
"CHA2DS2-VASc: calculate for every new AF patient before discharge.",
"Calcium FIRST in hyperkalemia with ECG changes (stabilizes the membrane within minutes).",
]
for i, tip in enumerate(tips, 1):
story.append(Paragraph(f"<b>{i}.</b> {tip}", styles["body_sm"]))
story.append(Spacer(1, 2))
story.append(Spacer(1, 0.15*inch))
story.append(HRFlowable(width="100%", thickness=1, color=SECTION_HEAD,
spaceBefore=4, spaceAfter=6))
story.append(Paragraph(
"ECG Mastery Practice Workbook | For educational purposes only. "
"Clinical decisions must be made by qualified healthcare professionals. "
"August 2026",
ParagraphStyle("footer", fontSize=7.5, textColor=MED_GRAY, alignment=1)
))
# Build
doc.build(story)
print(f"PDF built: {output_path}")
if __name__ == "__main__":
OUTPUT = "/tmp/workspace/ecg-practice/ECG_Mastery_Practice_Workbook.pdf"
build_pdf(OUTPUT)
cd /tmp/workspace/ecg-practice && python build_ecg_pdf.py 2>&1
ls -lh /tmp/workspace/ecg-practice/ECG_Mastery_Practice_Workbook.pdf
ECG Mastery Practice Workbook
PDF Document · PDF
What's in the Workbook
Structure
- Cover page with decorative ECG tracing and dark-theme design
- Table of Contents with difficulty color-coding
- How to Use - the 8-step systematic ECG interpretation method + paper calibration guide
- Quick Reference Tables - normal intervals, wave significance, and STEMI localization map
- 10 Progressive Cases - each with a clinical scenario, drawn ECG strip, and questions
- Full Answer Key - all 10 cases with key findings and teaching points
- Antiarrhythmic Drug Quick Card - 10 drugs with class, mechanism, indication, and cautions
- 10 Clinical ECG Tips
The 10 Cases (Simple to Complex)
| Case | Diagnosis | Difficulty |
|---|---|---|
| 1 | Normal Sinus Rhythm | Easy |
| 2 | SVT (AVNRT) | Easy |
| 3 | Atrial Fibrillation with RVR | Easy |
| 4 | Anterior STEMI (LAD) | Moderate |
| 5 | Monomorphic Ventricular Tachycardia | Moderate |
| 6 | Complete (3rd-degree) AV Block | Moderate |
| 7 | Wolff-Parkinson-White Syndrome | Moderate |
| 8 | Severe Hyperkalemia (K+ 7.2) | Hard |
| 9 | New LBBB - STEMI Equivalent (Sgarbossa) | Hard |
| 10 | Torsades de Pointes / Long QT | Hard |
Features
- Each case includes a synthetic ECG rhythm strip drawn on authentic pink-gridded ECG paper
- Selected cases include real-world reference ECG photos from clinical publications
- Answer sections include both key findings AND management/teaching points
- Questions are designed to test a full clinical chain: recognize → diagnose → treat