
Micturition reflex
Reading File
The micturition reflex is the neural mechanism coordinating bladder emptying, involving both spinal and supraspinal pathways. Let me pull the full content from the medical library.
Searching sources...
Finding Sources
Finding Sources
Reading File
Reading File
Reading File
Reading File
Reading File
Reading File
Reading File
Reading File
Reading File
Now let me fetch the key diagram images for a complete visual response.
Loading Image
Loading Image
Loading Image
Here is a complete, structured overview of the micturition reflex drawn from Guyton & Hall, Medical Physiology (Boron & Boulpaep), and Smith & Tanagho's General Urology.
Micturition Reflex
Definition
Micturition (voiding) is the process by which the urinary bladder empties when it becomes filled. The nervous component of this process is the micturition reflex - an autonomic spinal cord reflex that can be inhibited or facilitated by higher brain centers.
Anatomy of the Bladder and Sphincters
The bladder consists of:
- Detrusor muscle - smooth muscle that forms the bladder body; gap junctions allow coordinated whole-bladder contraction
- Trigone - smooth triangular area on the posterior wall between the two ureteric orifices and the urethral opening
- Bladder neck (posterior urethra) - 2-3 cm long; contains the internal sphincter (smooth muscle, involuntary)
- External sphincter - skeletal (striated) muscle in the urogenital diaphragm; under voluntary control via the pudendal nerve
Innervation
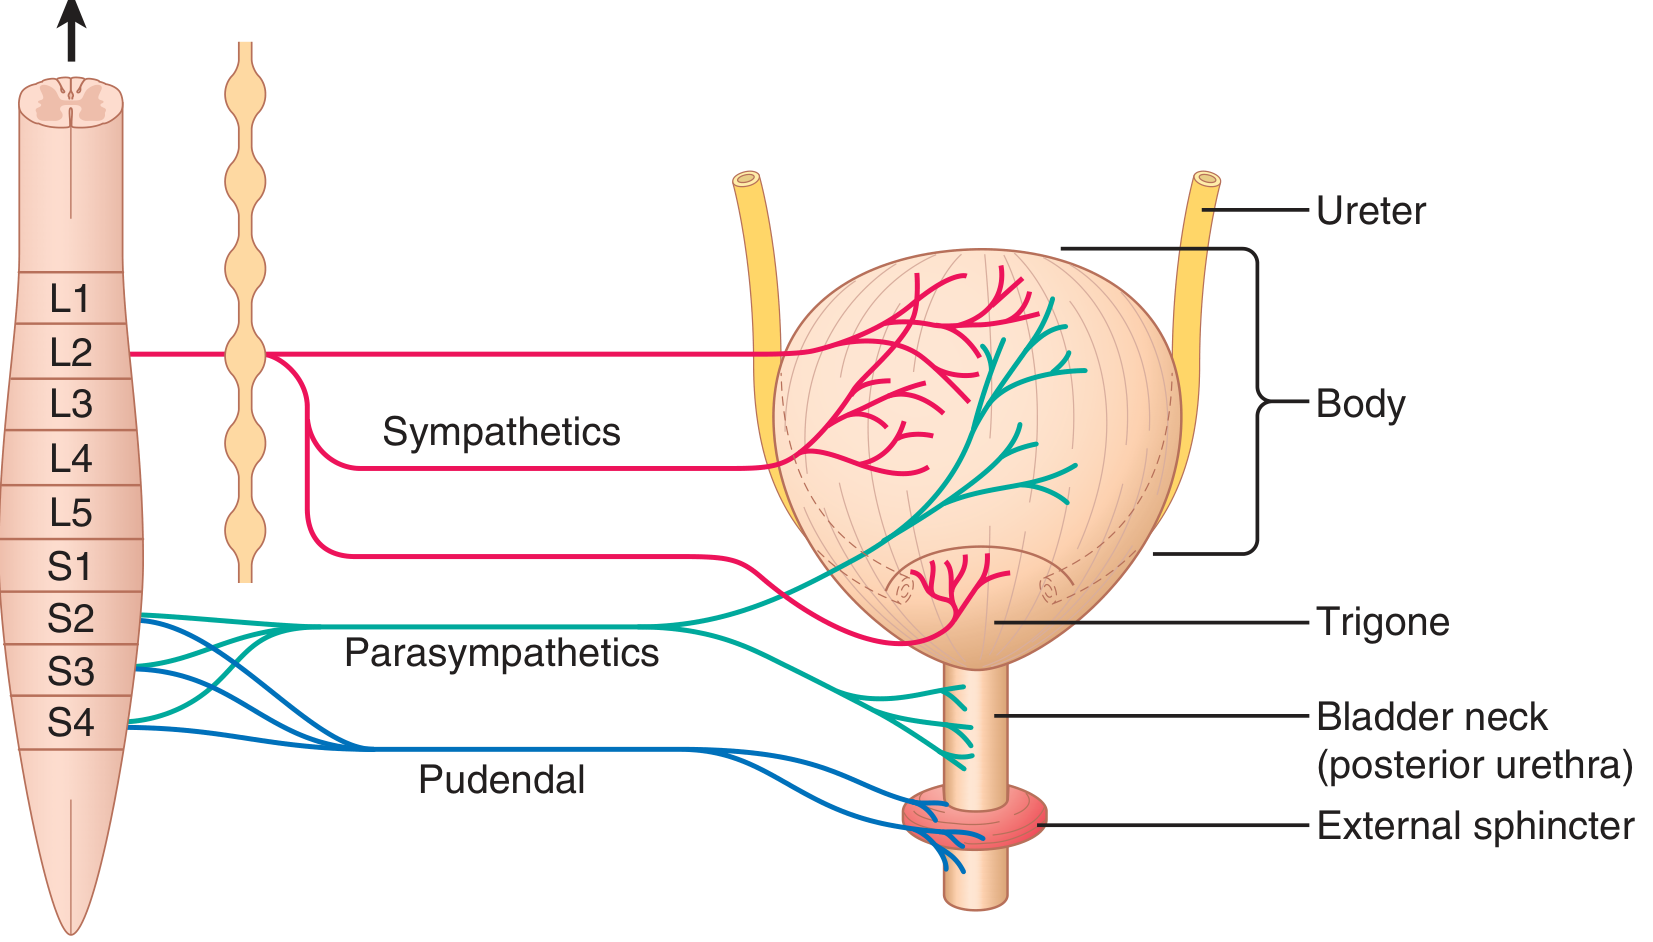
Figure: Innervation of the urinary bladder (Guyton & Hall)
| Nerve | Origin | Function |
|---|---|---|
| Pelvic nerve (parasympathetic) | S2-S4 | Carries sensory stretch signals to cord AND motor signals back to detrusor - the main nerve of micturition |
| Pudendal nerve (somatic) | S2-S4 (Onuf's nucleus) | Voluntary control of external sphincter |
| Hypogastric nerve (sympathetic) | L1-L3 | Mainly supplies blood vessels; mediates bladder neck contraction during storage; inhibits parasympathetic ganglia |
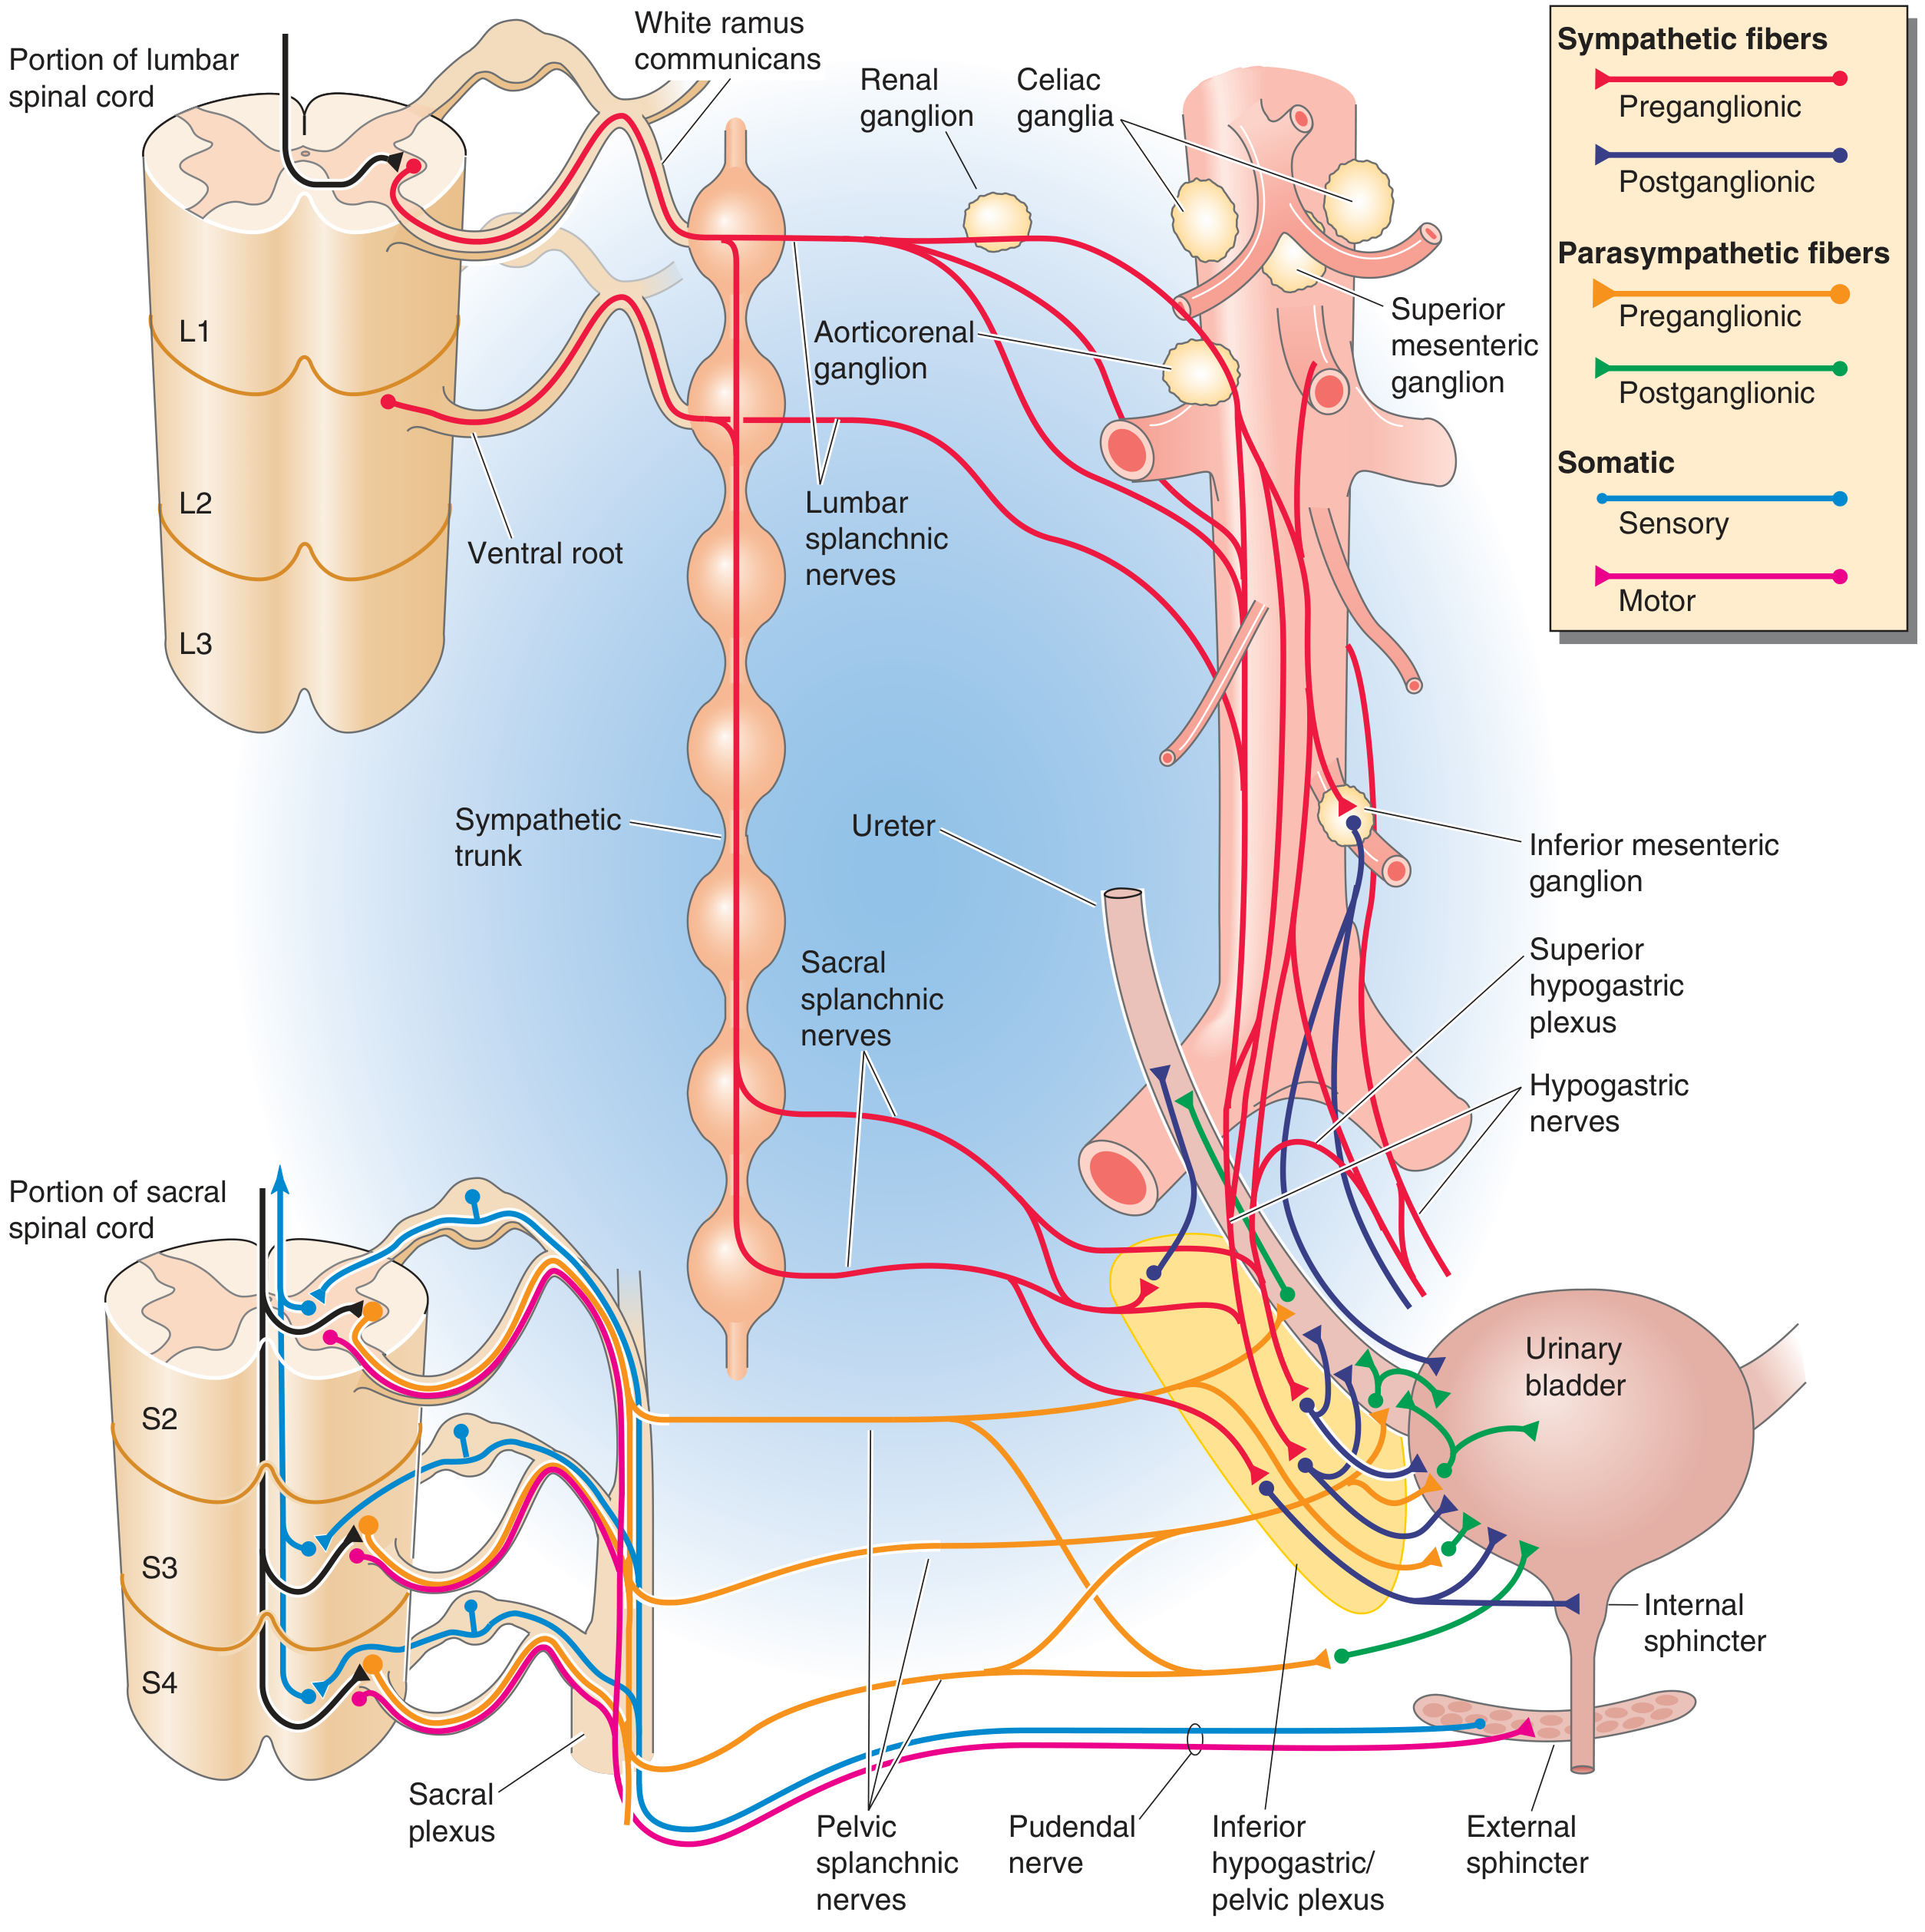
Figure: Complete autonomic and somatic innervation showing sympathetic (L1-L3), parasympathetic (S2-S4), and somatic pudendal pathways
Bladder Filling and Cystometrogram
- Empty bladder: intravesical pressure ~0 cmH₂O
- 30-50 mL: pressure rises to 5-10 cmH₂O
- 200-300 mL: pressure stays nearly flat (high compliance due to detrusor relaxation - stress relaxation)
-
300-400 mL: steep pressure rise
- First urge to void: ~150 mL; sense of fullness: 400-500 mL
Superimposed on this basal curve are periodic micturition waves (dashed spikes) - these are the micturition reflexes.
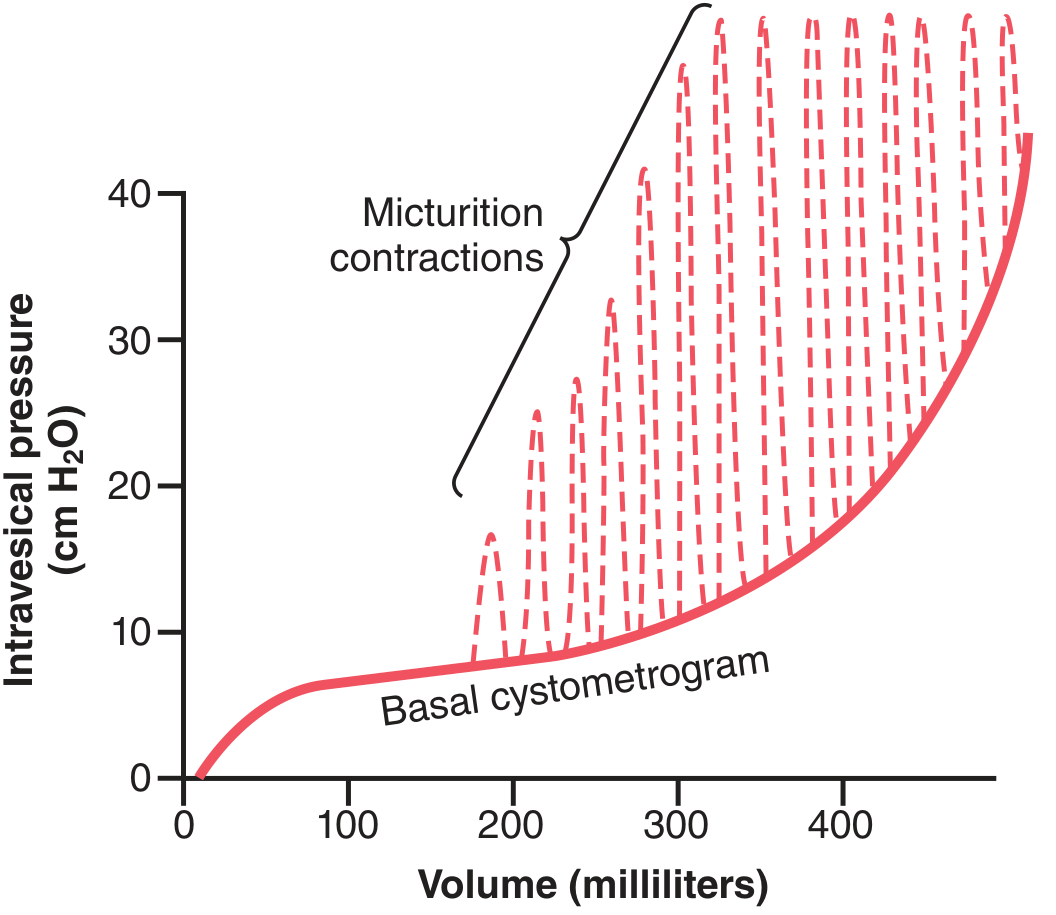
Figure: Normal cystometrogram. The solid red curve is the basal pressure-volume relationship; dashed spikes are micturition reflex contractions.
The Micturition Reflex: Mechanism
Afferent Limb
- Bladder stretch activates tension/stretch receptors in the detrusor wall - particularly in the posterior urethra
- Signals travel via myelinated Aδ-fibers in the pelvic nerves to the sacral cord (S2-S4)
Spinal Reflex Arc
- Sacral spinal cord integrates the afferent stretch signals
- Sends parasympathetic efferent signals back through the pelvic nerve to the detrusor → detrusor contraction
- Simultaneously inhibits the external sphincter via the pudendal nerve
Self-Regenerative (Positive Feedback) Cycle
Once initiated, the micturition reflex is self-regenerating:
- Bladder contraction further stretches the posterior urethra
- This activates more stretch receptors
- Which increases afferent firing
- Which increases detrusor contraction further
This positive feedback cycle continues until the bladder reaches maximum contraction, then fatigues and ceases - this constitutes one complete micturition reflex cycle:
- Progressive, rapid pressure rise
- Sustained peak pressure
- Return to baseline
If the reflex does not succeed in voiding (e.g., sphincter remains closed), the reflex elements stay inhibited for minutes to >1 hour before repeating. As the bladder fills further, reflexes occur more frequently and powerfully.
Supraspinal Control: The Brain's Role
The spinal reflex alone does not produce controlled voluntary voiding. Higher centers are essential:
Pontine Micturition Center (PMC) - "Barrington's Center"
- Located in the pons (dorsomedial tegmentum)
- The PMC acts as a switch: it inhibits parasympathetic output during storage and activates it during voiding
- Coordinates detrusor contraction with sphincter relaxation (prevents detrusor-sphincter dyssynergia)
- Receives integrated afferent information from the periaqueductal gray (PAG), which in turn receives input from cortex, hypothalamus, and bladder afferents
- The PMC threshold is set by GABAergic inhibitory mechanisms and inputs from rostral brain regions
Cerebral Cortex
- Primarily inhibitory - keeps the reflex suppressed until a socially appropriate time
- Can also facilitate the sacral micturition center when voiding is desired
Summary of Higher Control (Guyton & Hall):
- Higher centers keep the micturition reflex partially inhibited during storage
- They can prevent voiding (via tonic voluntary external sphincter contraction) even when the reflex fires
- When ready to void, the cortex facilitates the sacral center and simultaneously relaxes the external sphincter
Two Types of Micturition Reflex
| Type | Pathway | Afferent Fiber | Conditions |
|---|---|---|---|
| Vesicobulbovesical (normal) | Bladder → PAG → PMC → sacral cord → detrusor | Aδ (myelinated) | Normal voiding with coordinated sphincter relaxation |
| Vesicospinovesical (after spinal cord injury above sacral cord) | Bladder → sacral cord → detrusor (no supraspinal input) | C-fibers (unmyelinated) | Seen in chronic spinal injury; leads to detrusor-sphincter dyssynergia; blocked by capsaicin |
Storage Reflexes (preventing unwanted voiding)
Two reflexes maintain continence during filling:
-
Sympathetic storage reflex (vesicospinovesical storage): Bladder distension (Aδ afferents) → lumbar sympathetic (L1-L3) → inhibits parasympathetic ganglia (β3-AR stimulation relaxes detrusor) + contracts bladder neck (α-AR)
-
Somatic guarding/continence reflex (pelvic-to-pudendal): Sudden rise in intra-abdominal pressure (cough, sneeze) → Aδ afferents → sacral cord (Onuf's nucleus) + PAG/PMC → pudendal nerve → external sphincter contraction (rhabdosphincter)
Voluntary Initiation of Voiding
- Person voluntarily contracts abdominal muscles → raises intravesical pressure
- Urine enters the bladder neck and posterior urethra under pressure
- This stretches the posterior urethra → activates stretch receptors
- Excites the micturition reflex AND simultaneously inhibits the external sphincter
- Bladder empties completely (normally <5-10 mL residual urine)
Pathophysiology of Micturition
| Lesion | Bladder Type | Mechanism | Clinical Result |
|---|---|---|---|
| Sensory nerve destruction (afferent loss, e.g. tabes dorsalis) | Atonic bladder | No stretch signals reach cord; efferent pathway intact but reflex cannot initiate | Overflow incontinence |
| Spinal cord injury above sacral cord (sacral cord intact) | Automatic bladder | Vesicobulbovesical path interrupted; vesicospinovesical reflex slowly recovers via C-fibers | Periodic reflex voiding; often with detrusor-sphincter dyssynergia |
| Spinal cord/sacral cord damage (complete) | Flaccid/decentralized bladder | Both afferent and efferent arcs severed | Initial distension; later small autonomous contractions |
| Cortical lesions (e.g. stroke, frontal lobe) | Uninhibited bladder | Loss of cortical inhibition over PMC | Urge incontinence/overactive bladder |
Sources:
- Guyton and Hall Textbook of Medical Physiology, Chapter 26 (Micturition)
- Medical Physiology (Boron & Boulpaep), Chapter 33
- Smith and Tanagho's General Urology, 19th Ed., Chapter on Neural Control of Bladder
Cardiac output and its regulation MBBS
Reading File
Cardiac output (CO) is the volume of blood pumped by the heart per minute, normally about 5 L/min at rest. It is determined by heart rate and stroke volume, and regulated by preload, afterload, contractility, and autonomic tone. Let me pull comprehensive content from the medical library now.
Searching sources...
Finding Sources
Finding Sources
Reading File
Reading File
Reading File
Reading File
Reading File
Reading File
Finding Sources
Reading File
Finding Sources
Reading File
Finding Sources
Reading File
Finding Sources
Finding Sources
Loading Image
Finding Sources
Loading Image
Reading File
Reading File
I now have comprehensive content from multiple authoritative sources. Let me fetch the cardiac output curve image and compile the full answer.
Loading Image
Loading Image
I now have all the material needed for a complete, MBBS-level answer. Here it is:
Cardiac Output and Its Regulation
1. Definition
Cardiac output (CO) is the total volume of blood pumped by the heart (left ventricle) into the aorta per minute. It equals the sum of blood flows to all tissues of the body and is therefore one of the most important parameters of cardiovascular function.
CO = Stroke Volume (SV) × Heart Rate (HR)
2. Normal Values
| Parameter | Value |
|---|---|
| Resting CO (adult male, 70 kg) | ~5.6 L/min |
| Resting CO (adult female) | ~4.9 L/min (≈15% lower) |
| Commonly stated average | ~5 L/min |
| Stroke Volume (SV) | ~70 mL/beat |
| Heart Rate (HR) | ~72 beats/min |
| End-Diastolic Volume (EDV) | ~120-140 mL |
| End-Systolic Volume (ESV) | ~50-70 mL |
| Ejection Fraction (EF) | SV/EDV = 50-70% |
Sample calculation: SV = EDV - ESV = 140 - 70 = 70 mL; CO = 70 × 72 = ~5,040 mL/min
Cardiac Index
To normalize for body size:
Cardiac Index (CI) = CO / Body Surface Area (BSA)
Normal CI = 3 L/min/m² (in a 70 kg adult with BSA of ~1.7 m²)
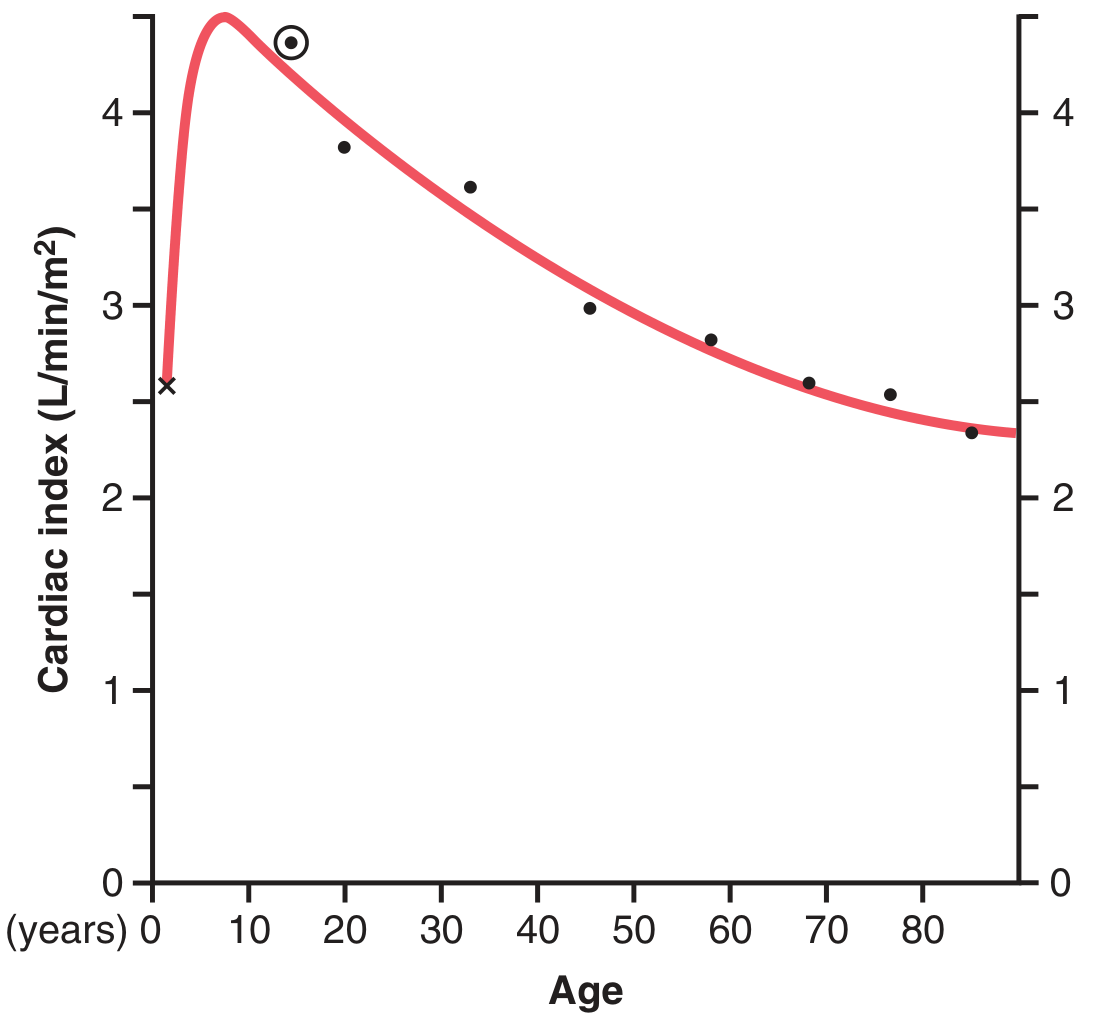
Cardiac index peaks at age ~10 years (>4 L/min/m²) and declines to ~2.4 L/min/m² by age 80, paralleling declining metabolic activity.
3. Components: Determinants of CO
CO is determined by 4 main factors - two intrinsic to the heart (affecting SV) and one rate factor:
A. Preload
- The load on the ventricle at the end of diastole, before contraction begins
- Equivalent to end-diastolic volume (EDV) or end-diastolic fiber length
- Clinically estimated by: Central Venous Pressure (CVP) for right ventricle, Pulmonary Capillary Wedge Pressure (PCWP) for left ventricle
- Increased preload → increased SV (Frank-Starling mechanism)
- Increased by: high venous return, blood transfusion, bradycardia (longer filling time)
- Decreased by: hemorrhage, dehydration, venodilation (nitrates)
B. Afterload
- The systolic load opposing ventricular ejection - wall stress during contraction
- Clinically approximated by systemic vascular resistance (SVR) or systolic blood pressure
- Formally defined using Laplace's Law: Wall stress (σ) = (P × R) / (2h) where P = pressure, R = radius, h = wall thickness
- Increased afterload → decreased SV (harder for ventricle to eject)
- Increased by: hypertension, aortic stenosis, arteriolar vasoconstriction
- Decreased by: vasodilators (e.g., ACE inhibitors, nitroprusside)
Note: The ventricle compensates for chronically increased afterload by hypertrophy (↑ wall thickness h), which reduces wall stress per Laplace's law.
C. Contractility (Inotropy)
- The intrinsic force-generating ability of the myocardium, independent of preload and afterload
- Reflects the number of cross-bridges formed at a given sarcomere length
- Increased by: sympathetic stimulation (β₁-receptors → ↑ cAMP → ↑ intracellular Ca²⁺), digoxin, catecholamines, exercise
- Decreased by: heart failure, myocardial ischemia, β-blockers, acidosis, hypoxia
- On Frank-Starling curves: positive inotropy shifts the curve upward; negative inotropy shifts it downward
D. Heart Rate (Chronotropy)
- CO = SV × HR - directly determines output at any given SV
- Increased by: sympathetic stimulation (β₁), catecholamines, thyroid hormone, fever
- Decreased by: parasympathetic (vagal) stimulation, β-blockers, hypothyroidism
- Extreme tachycardia (>160-180/min) paradoxically decreases CO because diastolic filling time is too short → reduced EDV → reduced SV
4. The Frank-Starling Law (Intrinsic Regulation)
The Frank-Starling law states: the volume of blood ejected per beat is directly proportional to the end-diastolic volume (within physiological limits).
Mechanism:
- Increased venous return → ↑ EDV → stretches sarcomeres → more optimal overlap of actin-myosin filaments → stronger contraction → ↑ SV
- Physiological basis: at sarcomere lengths of 1.8-2.2 µm, greater stretch = more cross-bridge formation
Physiological significance:
- The left and right ventricles automatically match their outputs - preventing pulmonary congestion
- Ensures cardiac output equals venous return in steady state
- Acts as a beat-to-beat self-regulating mechanism
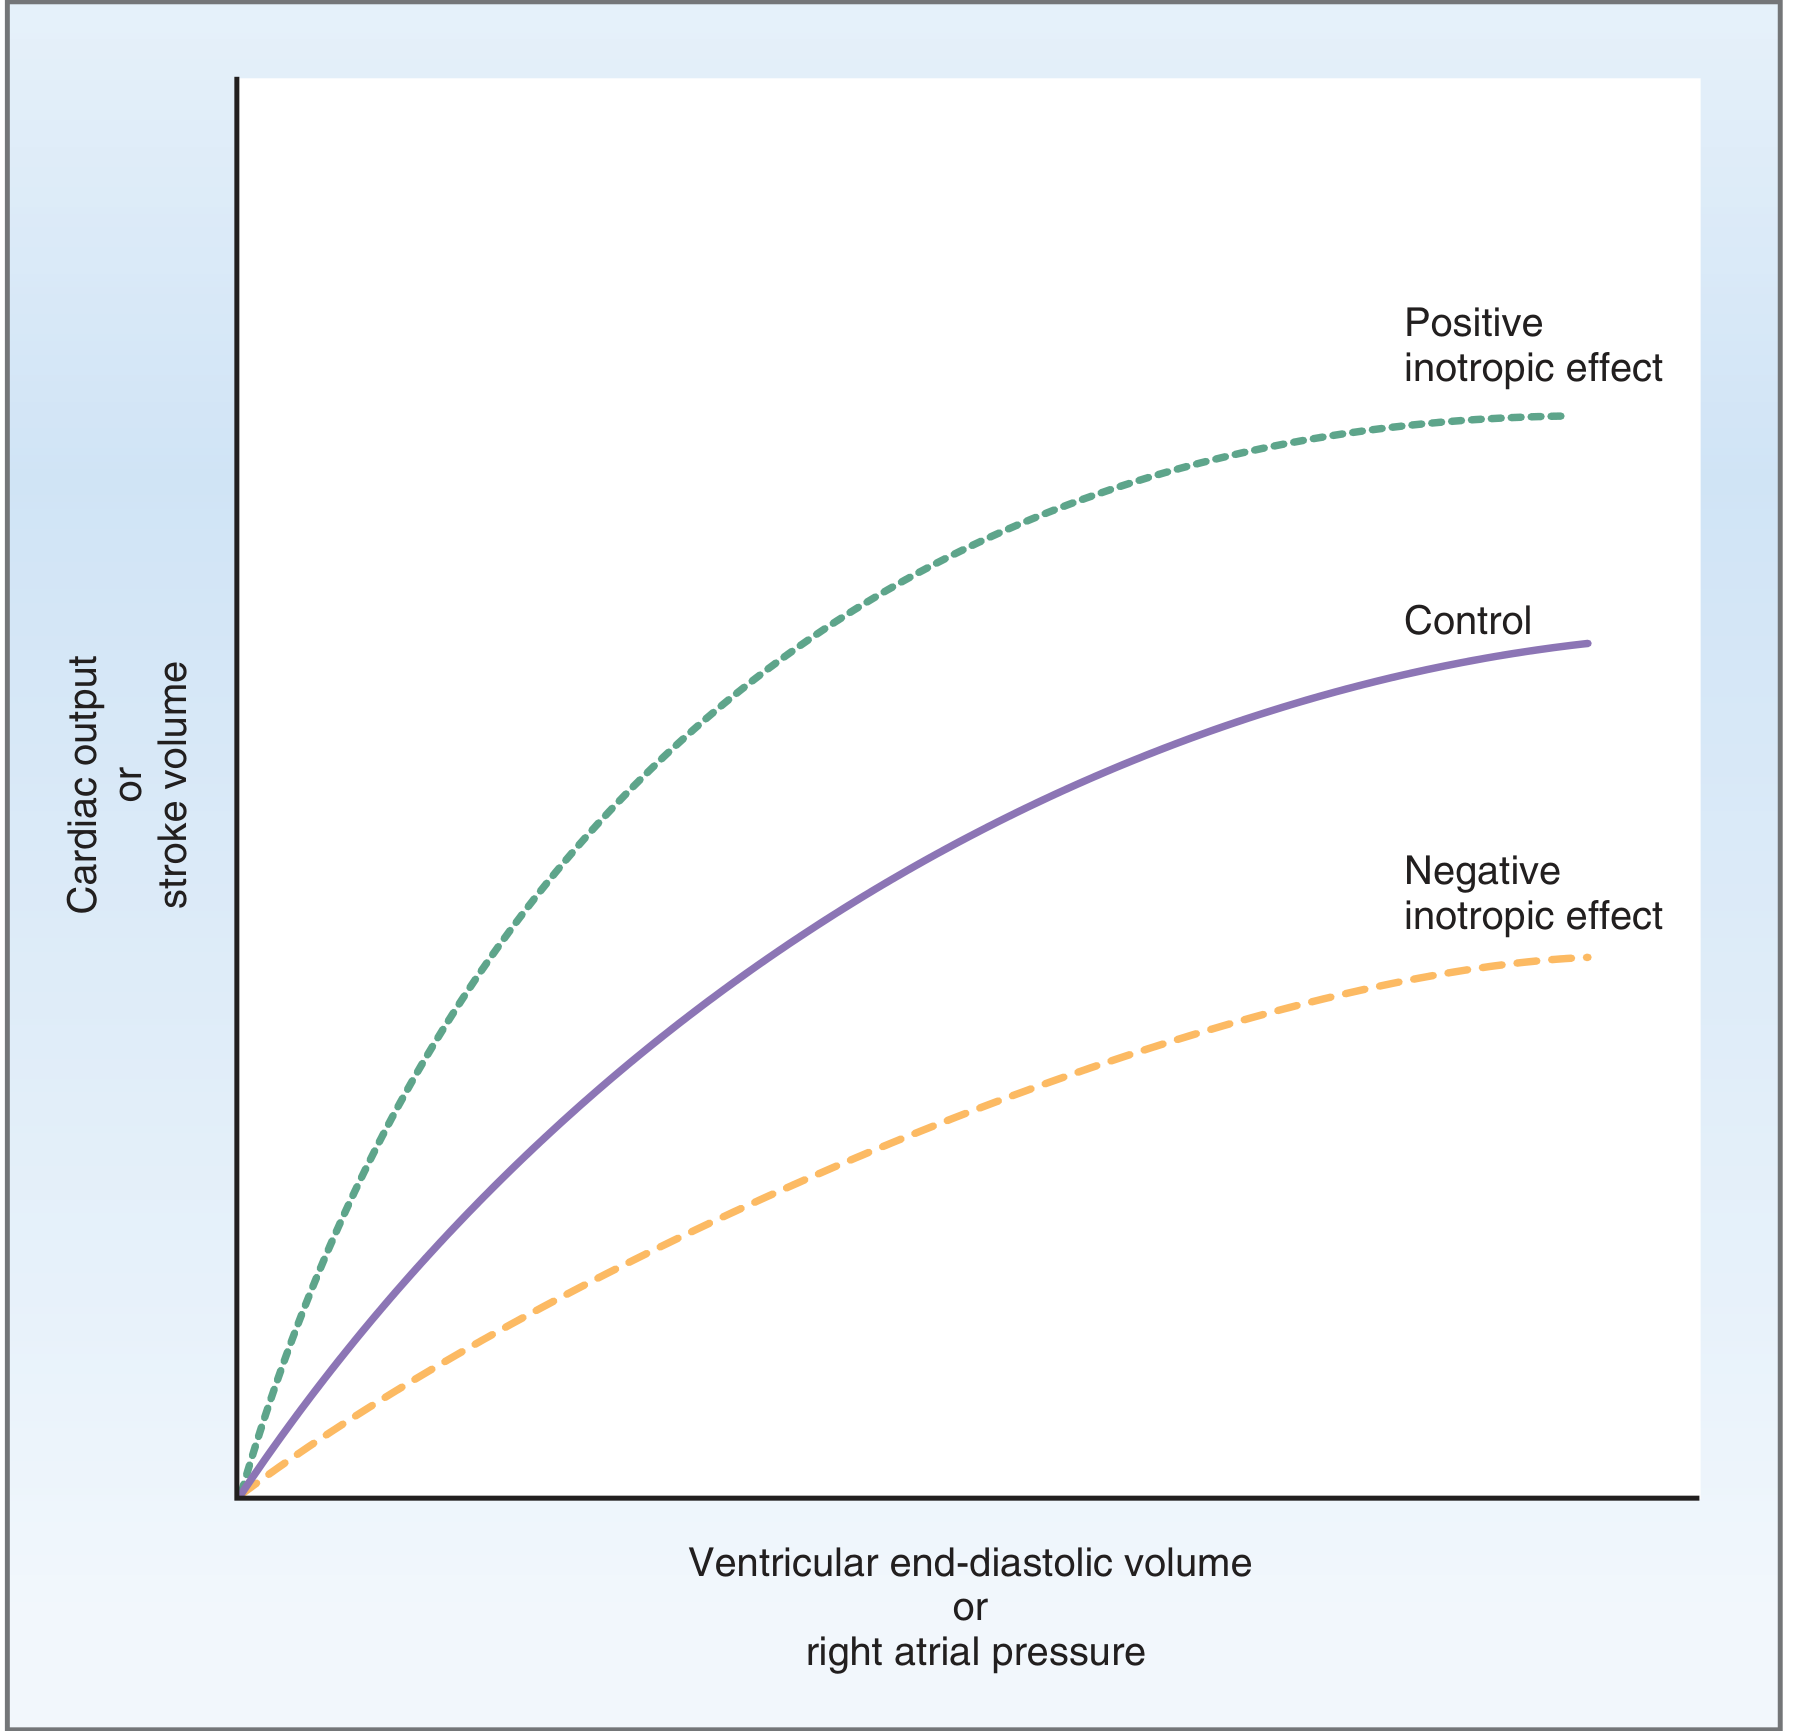
The Frank-Starling relationship. Positive inotropic agents shift the curve upward (more CO/SV for the same preload); negative inotropic agents shift it downward.
5. The Cardiac Output Curve (Cardiac Function Curve)
- Plots right atrial pressure (RAP) vs. cardiac output
- At normal RAP (~0 mmHg), CO = ~5 L/min
- The curve plateaus at ~13 L/min in a normal heart (2.5× resting CO)
- Hypereffective heart (sympathetic stimulation, hypertrophy): curve shifts upward
- Hypoeffective heart (heart failure, MI, drugs): curve shifts downward and flattens
The intersection of the cardiac output curve with the venous return curve determines the actual operating CO at any moment.
6. Venous Return and Its Role (Peripheral Regulation)
"The venous return to the heart is the primary controller of cardiac output under normal conditions." - Guyton & Hall
CO = Venous Return (in steady state)
The key principle: CO is controlled primarily by peripheral factors (tissue blood flow), not by the heart itself. The heart acts as a passive responder that pumps whatever returns to it via the Frank-Starling mechanism.
CO = Arterial Pressure / Total Peripheral Resistance
- ↓ TPR (vasodilation) → ↑ venous return → ↑ CO (e.g., exercise, AV fistula, anemia)
- ↑ TPR (vasoconstriction) → ↓ CO (e.g., hypertension)
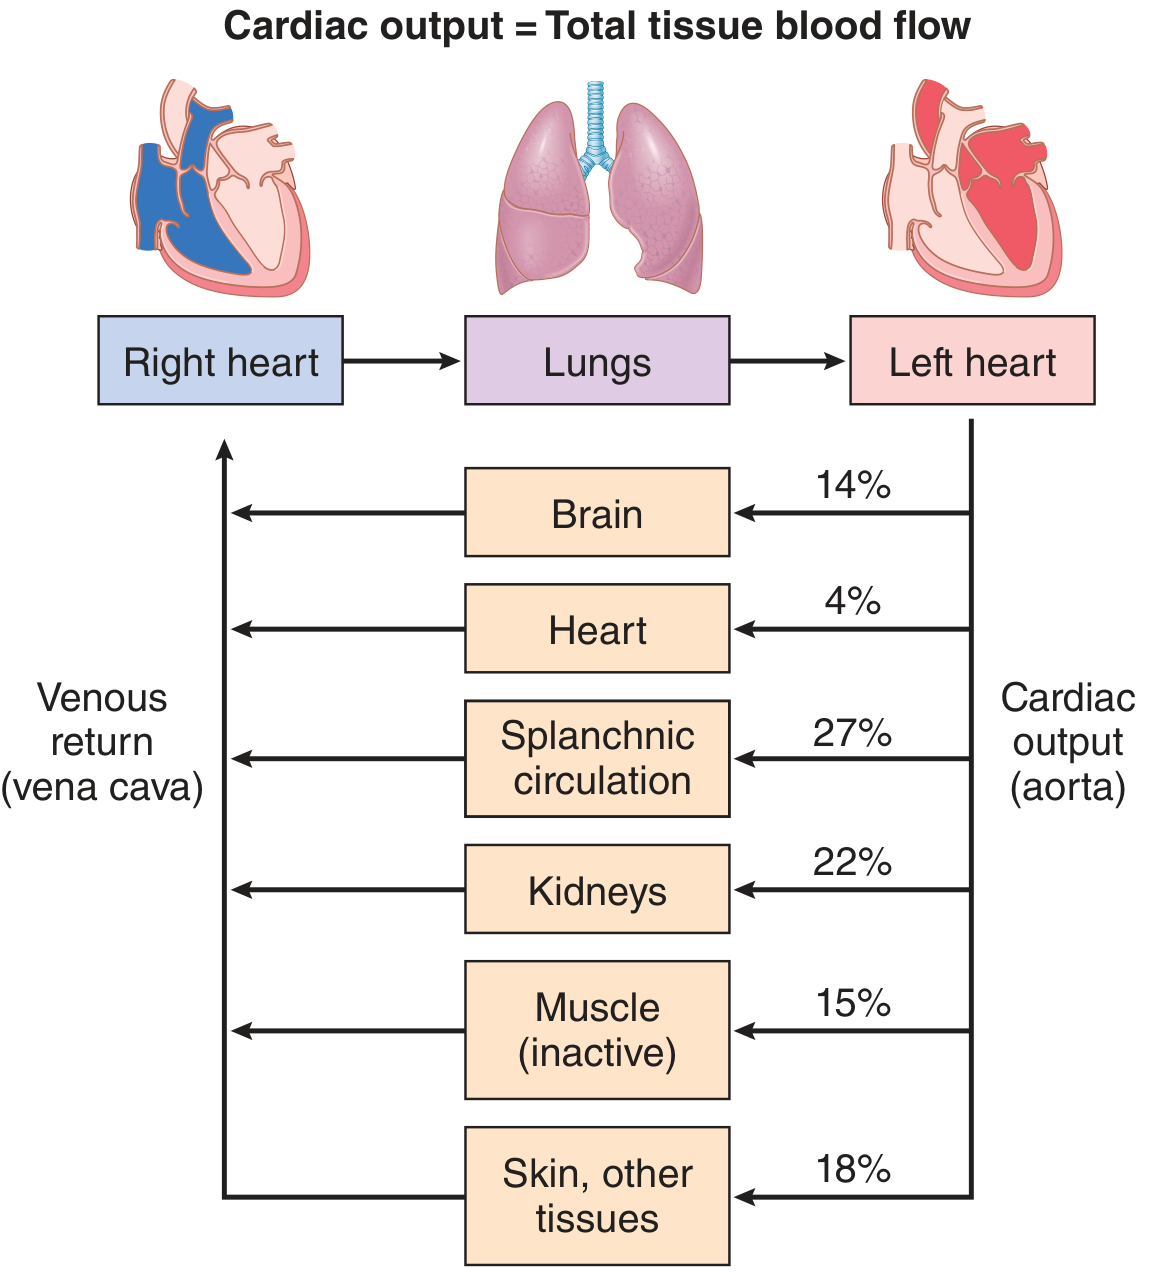
Cardiac output distributed to tissues at rest: splanchnic 27%, kidneys 22%, muscle 15%, brain 14%, skin/other 18%, heart 4%.
Factors increasing venous return (↑ CO):
- Increased blood volume
- Venoconstriction (sympathetic stimulation)
- Skeletal muscle pump (exercise)
- Respiratory pump (negative intrathoracic pressure during inspiration)
- Decreased venous capacitance
7. Nervous System Regulation (Extrinsic)
Sympathetic Nervous System
- Chronotropy: ↑ HR via β₁ receptors on SA node
- Inotropy: ↑ contractility via β₁ receptors on ventricular myocardium
- Vasomotor tone: maintains arterial pressure → prevents fall in CO when TPR falls
- During exercise: sympathetic activation raises BP above normal → "pushes" additional blood through active muscles (adds 30-100% to CO above what local vasodilation alone achieves)
Parasympathetic (Vagus)
- Primarily slows HR (negative chronotropy) via M₂ receptors on SA/AV nodes
- Minimal direct effect on ventricular contractility
Bainbridge Reflex
- Stretch of right atrial wall → afferent signals to vasomotor center → sympathetic efferents back to SA node → ↑ HR by 10-15%
- A direct intrinsic response to increased venous return that helps the heart keep up
8. CO During Exercise
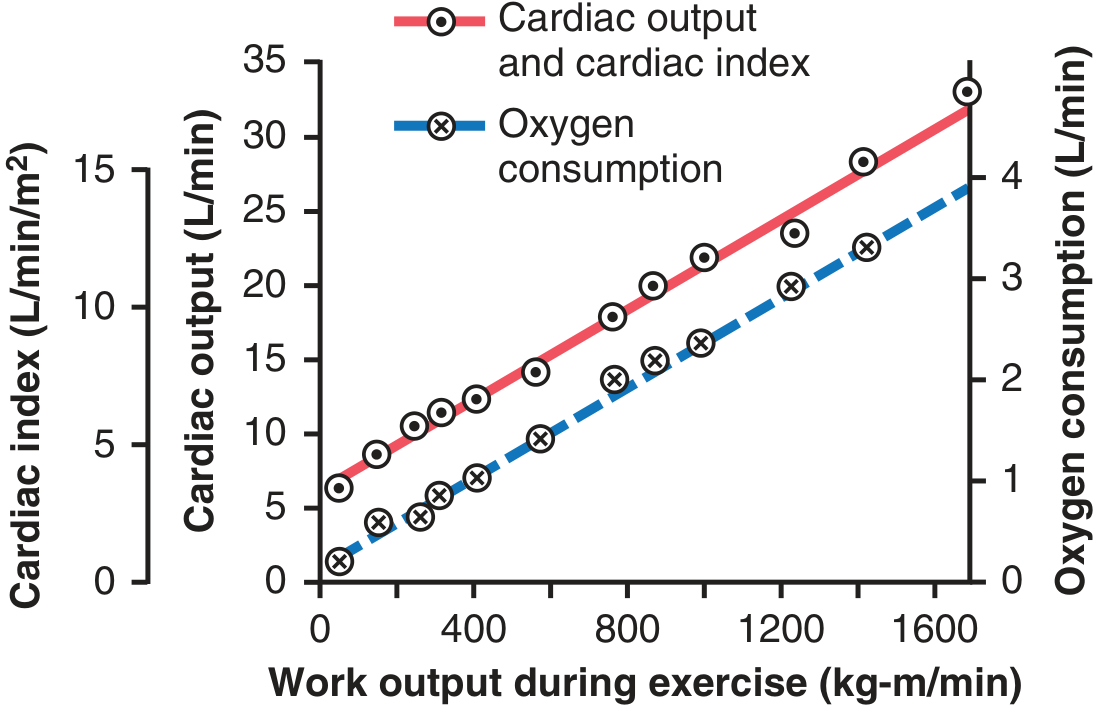
- CO rises linearly with oxygen consumption and work output
- Resting CO of ~5 L/min can reach 20-25 L/min in an average adult
- Trained athletes: up to 30-40 L/min (due to cardiac hypertrophy + strong sympathetic drive)
- Mechanism: ↑ skeletal muscle metabolism → local vasodilation → ↓ TPR → ↑ venous return → Frank-Starling ↑ SV + simultaneous sympathetic ↑ HR
9. Hormonal Regulation
| Hormone | Effect on CO | Mechanism |
|---|---|---|
| Catecholamines (adrenaline, noradrenaline) | ↑ CO | β₁: ↑ HR + ↑ contractility |
| Thyroid hormone (T3/T4) | ↑ CO | ↑ HR, ↑ contractility, ↓ TPR |
| ANP/BNP | ↓ preload | Vasodilation, natriuresis → ↓ venous return |
| Angiotensin II | ↑ CO (indirectly) | Vasoconstriction + aldosterone → ↑ blood volume |
10. Pathological Changes in CO
Abnormally HIGH CO (due to ↓ TPR)
| Condition | Mechanism |
|---|---|
| Beriberi (Vit B₁ deficiency) | Tissue unable to use nutrients → compensatory vasodilation → ↓ TPR |
| AV fistula | Direct arteriovenous shunting → ↓ TPR |
| Hyperthyroidism | ↑ metabolism → vasodilation → ↓ TPR; CO can ↑ 40-80% |
| Anemia | ↓ blood viscosity + tissue hypoxia → vasodilation |
| Pregnancy | ↑ blood volume, ↓ SVR |
Abnormally LOW CO
| Condition | Cause |
|---|---|
| Myocardial infarction | Cardiac pump failure |
| Aortic/mitral stenosis | Obstruction to flow |
| Cardiac tamponade | Compression of heart → ↓ filling |
| Cardiogenic shock | Severe pump failure; CO insufficient for tissue nutrition |
| Hemorrhage | ↓ blood volume → ↓ venous return |
| Severe hypertension | ↑ afterload → ↓ SV |
| Hypothyroidism | ↓ metabolic demand → ↓ CO |
11. Summary: Regulation of Cardiac Output
CARDIAC OUTPUT = STROKE VOLUME × HEART RATE
                        ↑
          ┌─────────────┴──────────────┐
       PRELOAD               AFTERLOAD (inverse)
    (Frank-Starling)      (SVR, aortic compliance)
          ↑                        ↑
    Venous return           Vascular resistance

       CONTRACTILITY
    (Sympathetic, catecholamines,
     digoxin, Ca²⁺)

       HEART RATE
    (Sympathetic ↑, Vagal ↓,
     Catecholamines, Thyroid)
Sources:
- Guyton and Hall Textbook of Medical Physiology, Chapter 20 (Cardiac Output, Venous Return, and Their Regulation)
- Costanzo Physiology, 7th Edition, Chapter 4 (Cardiac Output)
- Medical Physiology (Boron & Boulpaep), Chapter on Regulation of Cardiac Output
- Braunwald's Heart Disease, Chapter 46 (Wall Stress, Preload, Afterload)
- Miller's Anesthesia, 10th Edition, Chapter 13 (Preload and Afterload)
Pacemaker potential physiology mbbs
Reading File
The pacemaker potential (prepotential/slow diastolic depolarization) is the spontaneous, gradual depolarization of SA node cells during diastole that triggers each heartbeat. It is driven by the "funny current" (If), a declining K⁺ conductance, and a rising Ca²⁺ conductance. Let me pull the full textbook content now.
Searching sources...
Finding Sources
Finding Sources
Finding Sources
Reading File
Reading File
Reading File
Reading File
Finding Sources
Reading File
Finding Sources
Reading File
Finding Sources
Reading File
Finding Sources
Finding Sources
Loading Image
Loading Image
Finding Sources
Reading File
Loading Image
Loading Image
All the content and images are now in hand. Here is the complete MBBS-level answer:
Pacemaker Potential (Prepotential) - Physiology
1. What Is the Pacemaker Potential?
The pacemaker potential (also called the prepotential or slow diastolic depolarization) is the spontaneous, gradual depolarization of SA node cells that occurs during Phase 4 of each cardiac cycle, bringing the membrane potential from its most negative value up to the threshold for the next action potential.
This property is called automaticity - the ability of certain cardiac cells to spontaneously generate action potentials without any external neural stimulus.
2. SA Node vs. Ventricular Action Potential: Key Comparison
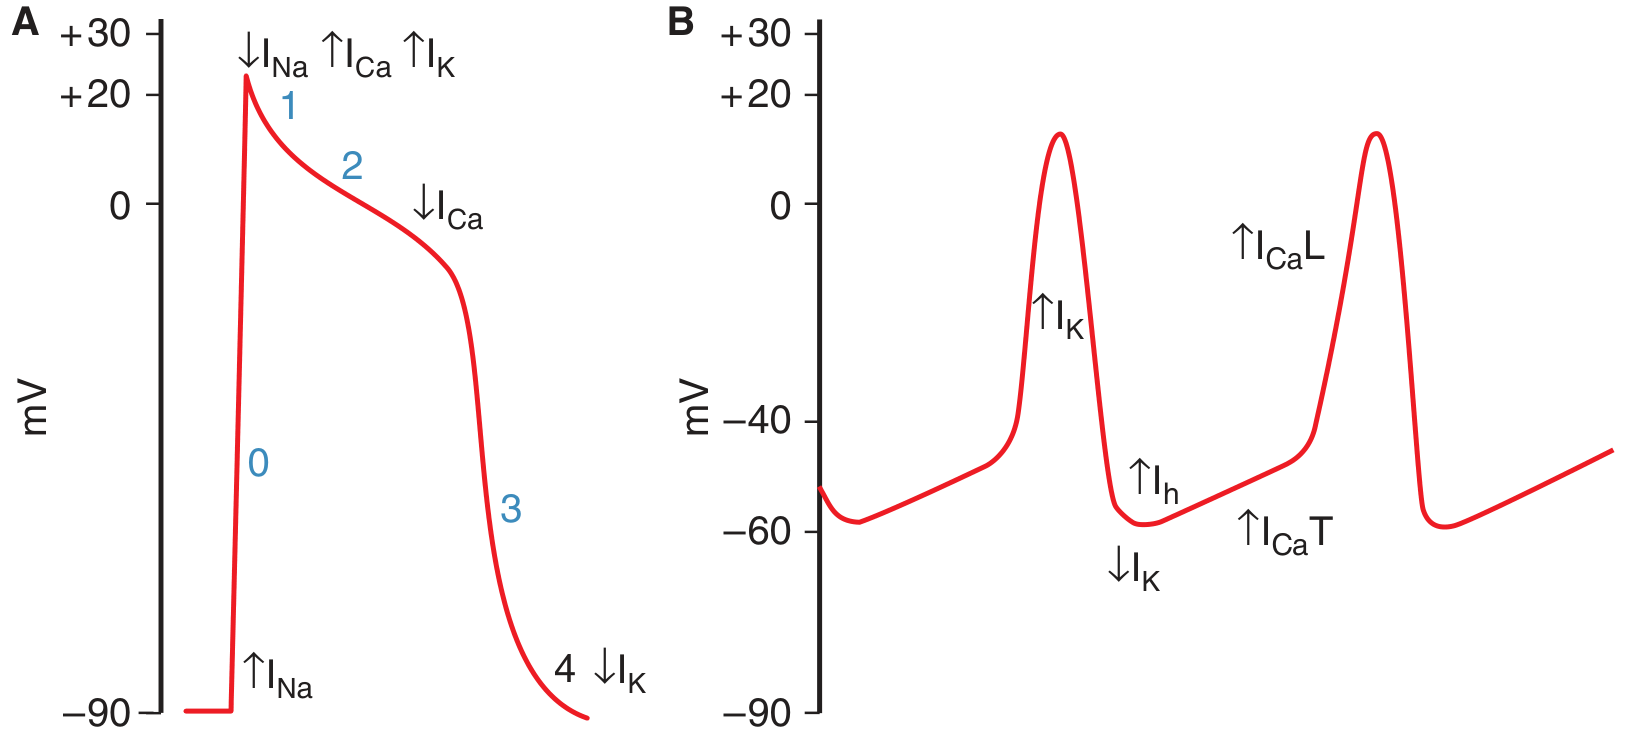
Panel A = Ventricular muscle action potential (phases 0-4)
Panel B = SA node pacemaker potential (shows the slow upslope of phase 4, then upstroke)
| Feature | Ventricular/Atrial/Purkinje | SA Node |
|---|---|---|
| Resting potential | -90 mV (stable) | -65 mV (unstable, slowly rising) |
| Phase 0 upstroke | Fast Na⁺ current (INa) - steep | Slow L-type Ca²⁺ current (ICaL) - gradual |
| Phase 1 | Present (rapid repolarization) | Absent |
| Phase 2 (plateau) | Present | Absent |
| Phase 3 (repolarization) | K⁺ efflux (IK) | K⁺ efflux (IK) |
| Phase 4 | Stable (flat) | Spontaneous depolarization (pacemaker potential) |
| Action potential duration | 150-300 ms | ~150 ms |
3. Ionic Basis of the Pacemaker Potential (Phase 4)
The pacemaker potential is generated by three sequential ionic events:
Step 1 - Declining K⁺ conductance (↓ IK)
- At the end of each action potential (after repolarization), the IK current that caused repolarization gradually declines
- Since K⁺ was driving the membrane toward EK (very negative), as IK falls, there is less outward current holding the membrane at the most negative value
- Maximum diastolic potential (MDP): approximately -65 mV
Step 2 - Activation of the "Funny" Current (If / Ih)
- As the membrane repolarizes and becomes negative, HCN (Hyperpolarization-activated Cyclic Nucleotide-gated) channels open
- These are activated by hyperpolarization (hence "h" channels) and carry a mixed Na⁺ + K⁺ inward current
- This current is called If (funny current) because it is paradoxically activated by hyperpolarization (opposite to most voltage-gated channels)
- If drives the first part of the slow depolarization (roughly -65 mV to -50 mV)
Step 3 - T-type Ca²⁺ channel activation (ICa,T)
- As the membrane depolarizes to around -50 mV, T-type (Transient) Ca²⁺ channels open
- These generate an inward Ca²⁺ current (ICa,T) that completes the prepotential, depolarizing the membrane to threshold (~-40 mV)
- Evidence also exists for Ca²⁺ sparks (local Ca²⁺ release from the SR) contributing at this stage
Step 4 - Upstroke: L-type Ca²⁺ channels (ICa,L)
- Once threshold (~-40 mV) is reached, L-type (Long-lasting) Ca²⁺ channels open
- This generates the action potential upstroke in SA nodal cells
- Note: There is no fast Na⁺ current (INa) contributing to the SA node upstroke - this is why SA node action potentials are "slow response" action potentials
Step 5 - Repolarization (IK)
- K⁺ conductance increases → outward IK repolarizes the membrane back to ~-65 mV (MDP)
- The cycle then repeats automatically
4. Summary of Ionic Events in the SA Node Action Potential
Membrane potential
     +10 mV ─────────────────┐ (upstroke: ICa,L opens)
                             │
      -40 mV ─ ─ ─(threshold)│
             T-Ca²⁺ opens ↑  │
                          ↑  │
      -50 mV ─────If(funny)  │
             starts here     │
                          ↑  │  (repolarization: IK↑)
      -65 mV ─────(MDP)──────────────── (IK declines)
              ← Phase 4 →   └────────────────────
              (Pacemaker potential)
              IK declines → If activates → ICa,T → reaches threshold → ICa,L fires
5. Phases of SA Node Action Potential (No Phase 0,1,2)
| Phase | Name | Mechanism |
|---|---|---|
| Phase 4 (longest) | Pacemaker potential / Spontaneous diastolic depolarization | ↓IK → ↑If (Na⁺/K⁺) → ↑ICa,T → reaches threshold |
| Phase 0 (slow, shallow) | Upstroke | L-type Ca²⁺ channels open (no fast INa) |
| Phase 3 | Repolarization | ↑IK (outward K⁺ current) returns to MDP |
| Phases 1 & 2 | ABSENT | - |
6. Latent Pacemakers and Overdrive Suppression
Several cardiac tissues have the capacity for automaticity but are normally suppressed:
| Location | Intrinsic Firing Rate |
|---|---|
| SA node | 70-80/min (fastest = dominant pacemaker) |
| AV node | 40-60/min |
| Bundle of His | ~40/min |
| Purkinje fibers | 15-20/min |
Rule: The tissue with the fastest rate of Phase 4 depolarization controls heart rate.
Overdrive Suppression: The SA node fires fastest and continuously drives all lower pacemakers. Since these latent pacemakers are activated by SA node impulses before they can self-depolarize to threshold, their own automaticity is suppressed. If the SA node fails, the next fastest tissue (AV node) takes over as an escape pacemaker.
Ectopic pacemaker conditions:
- SA node firing rate decreases (vagal stimulation, disease)
- Intrinsic rate of a latent pacemaker increases (ischemia, digoxin toxicity)
- Conduction block from SA node to rest of heart
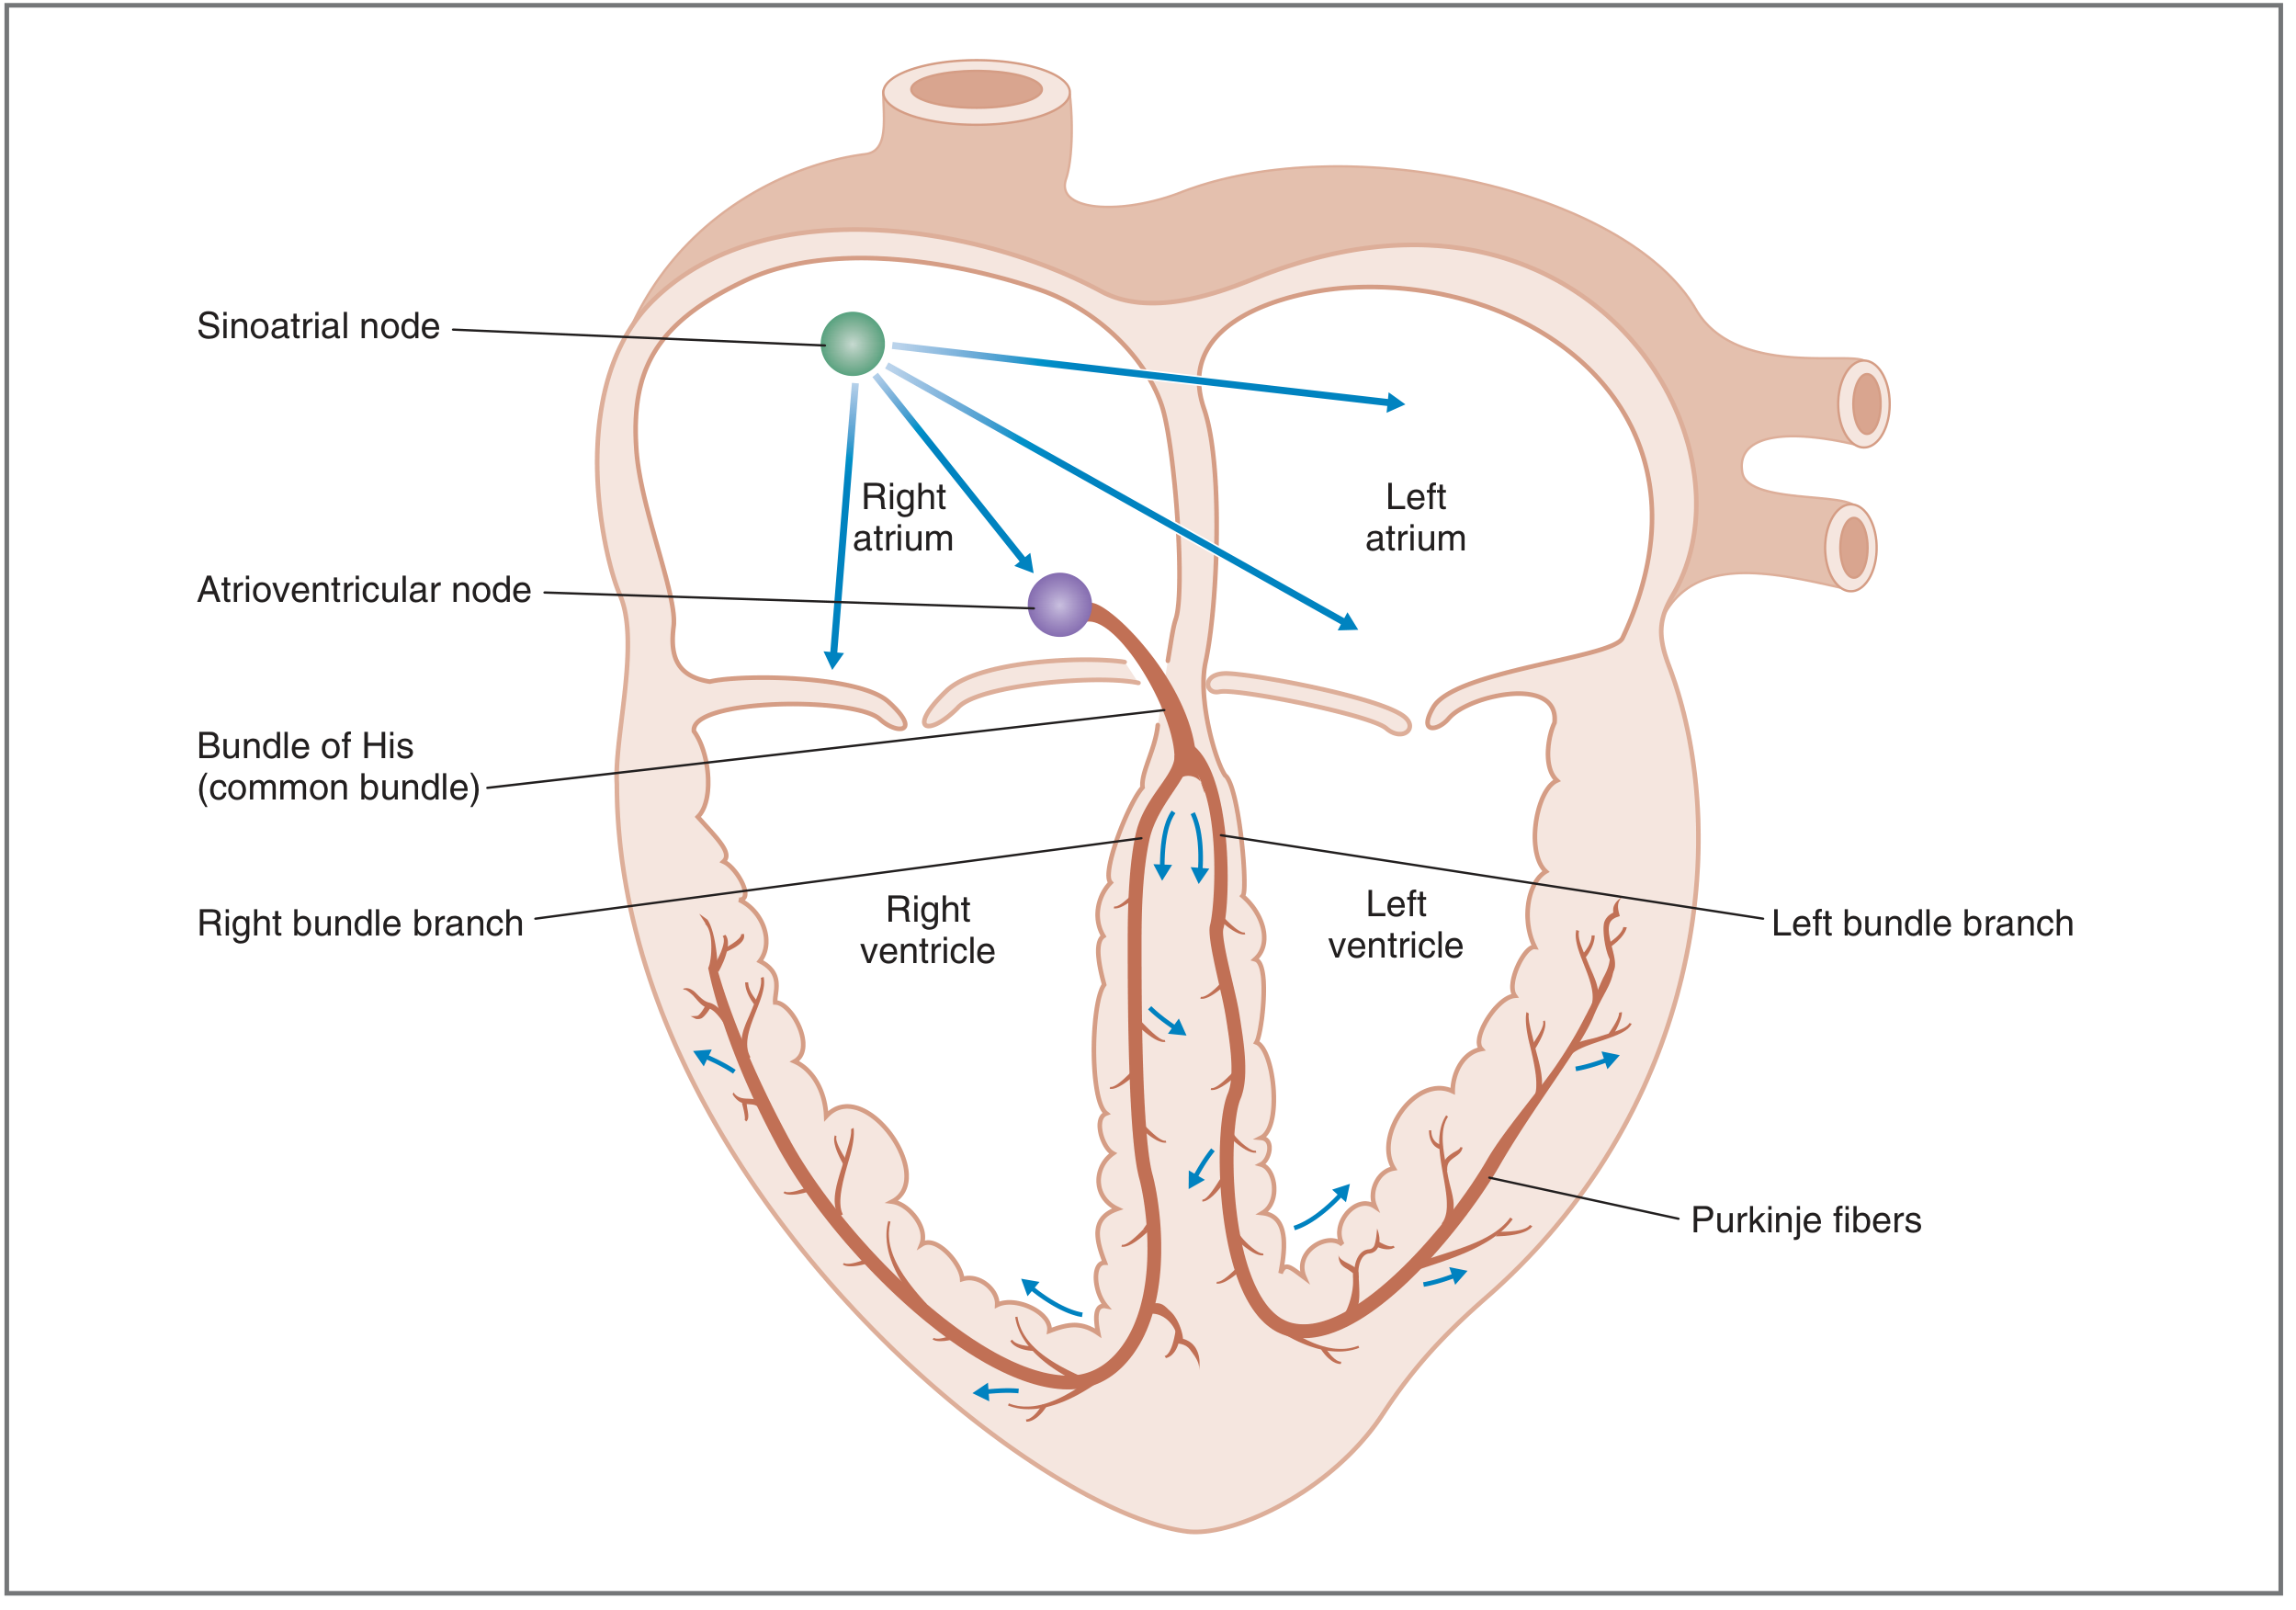
The action potential originates in the SA node and spreads sequentially through atria → AV node → Bundle of His → bundle branches → Purkinje fibers → ventricles.
7. Autonomic Nervous System Control of Pacemaker Potential
The rate of Phase 4 depolarization is the key variable. Changing it changes heart rate.
Sympathetic Stimulation (↑ Heart Rate - Positive Chronotropy)
Mechanism:
- Norepinephrine binds β₁ receptors on SA node → activates Gs protein → ↑ adenylyl cyclase → ↑ cAMP
- ↑ cAMP has two effects:
- ↑ If (funny current) → steeper, faster Phase 4 depolarization
- ↑ ICa,L → threshold potential decreases (less depolarization needed to fire)
- Result: threshold reached faster → more action potentials per minute → ↑ HR
Parasympathetic Stimulation (↓ Heart Rate - Negative Chronotropy)
Mechanism:
- Acetylcholine binds M2 (muscarinic) receptors on SA node → activates Gi protein (Gk) → ↓ adenylyl cyclase → ↓ cAMP
- Three combined effects:
- ↓ If → slower Phase 4 depolarization (less steep slope)
- ↑ IKACh (K⁺-Ach channels open via Gk directly) → hyperpolarizes MDP further from threshold
- ↓ ICa → threshold potential increases (more depolarization needed to fire)
- Strong vagal stimulation → complete cessation of SA node firing (vagal arrest)
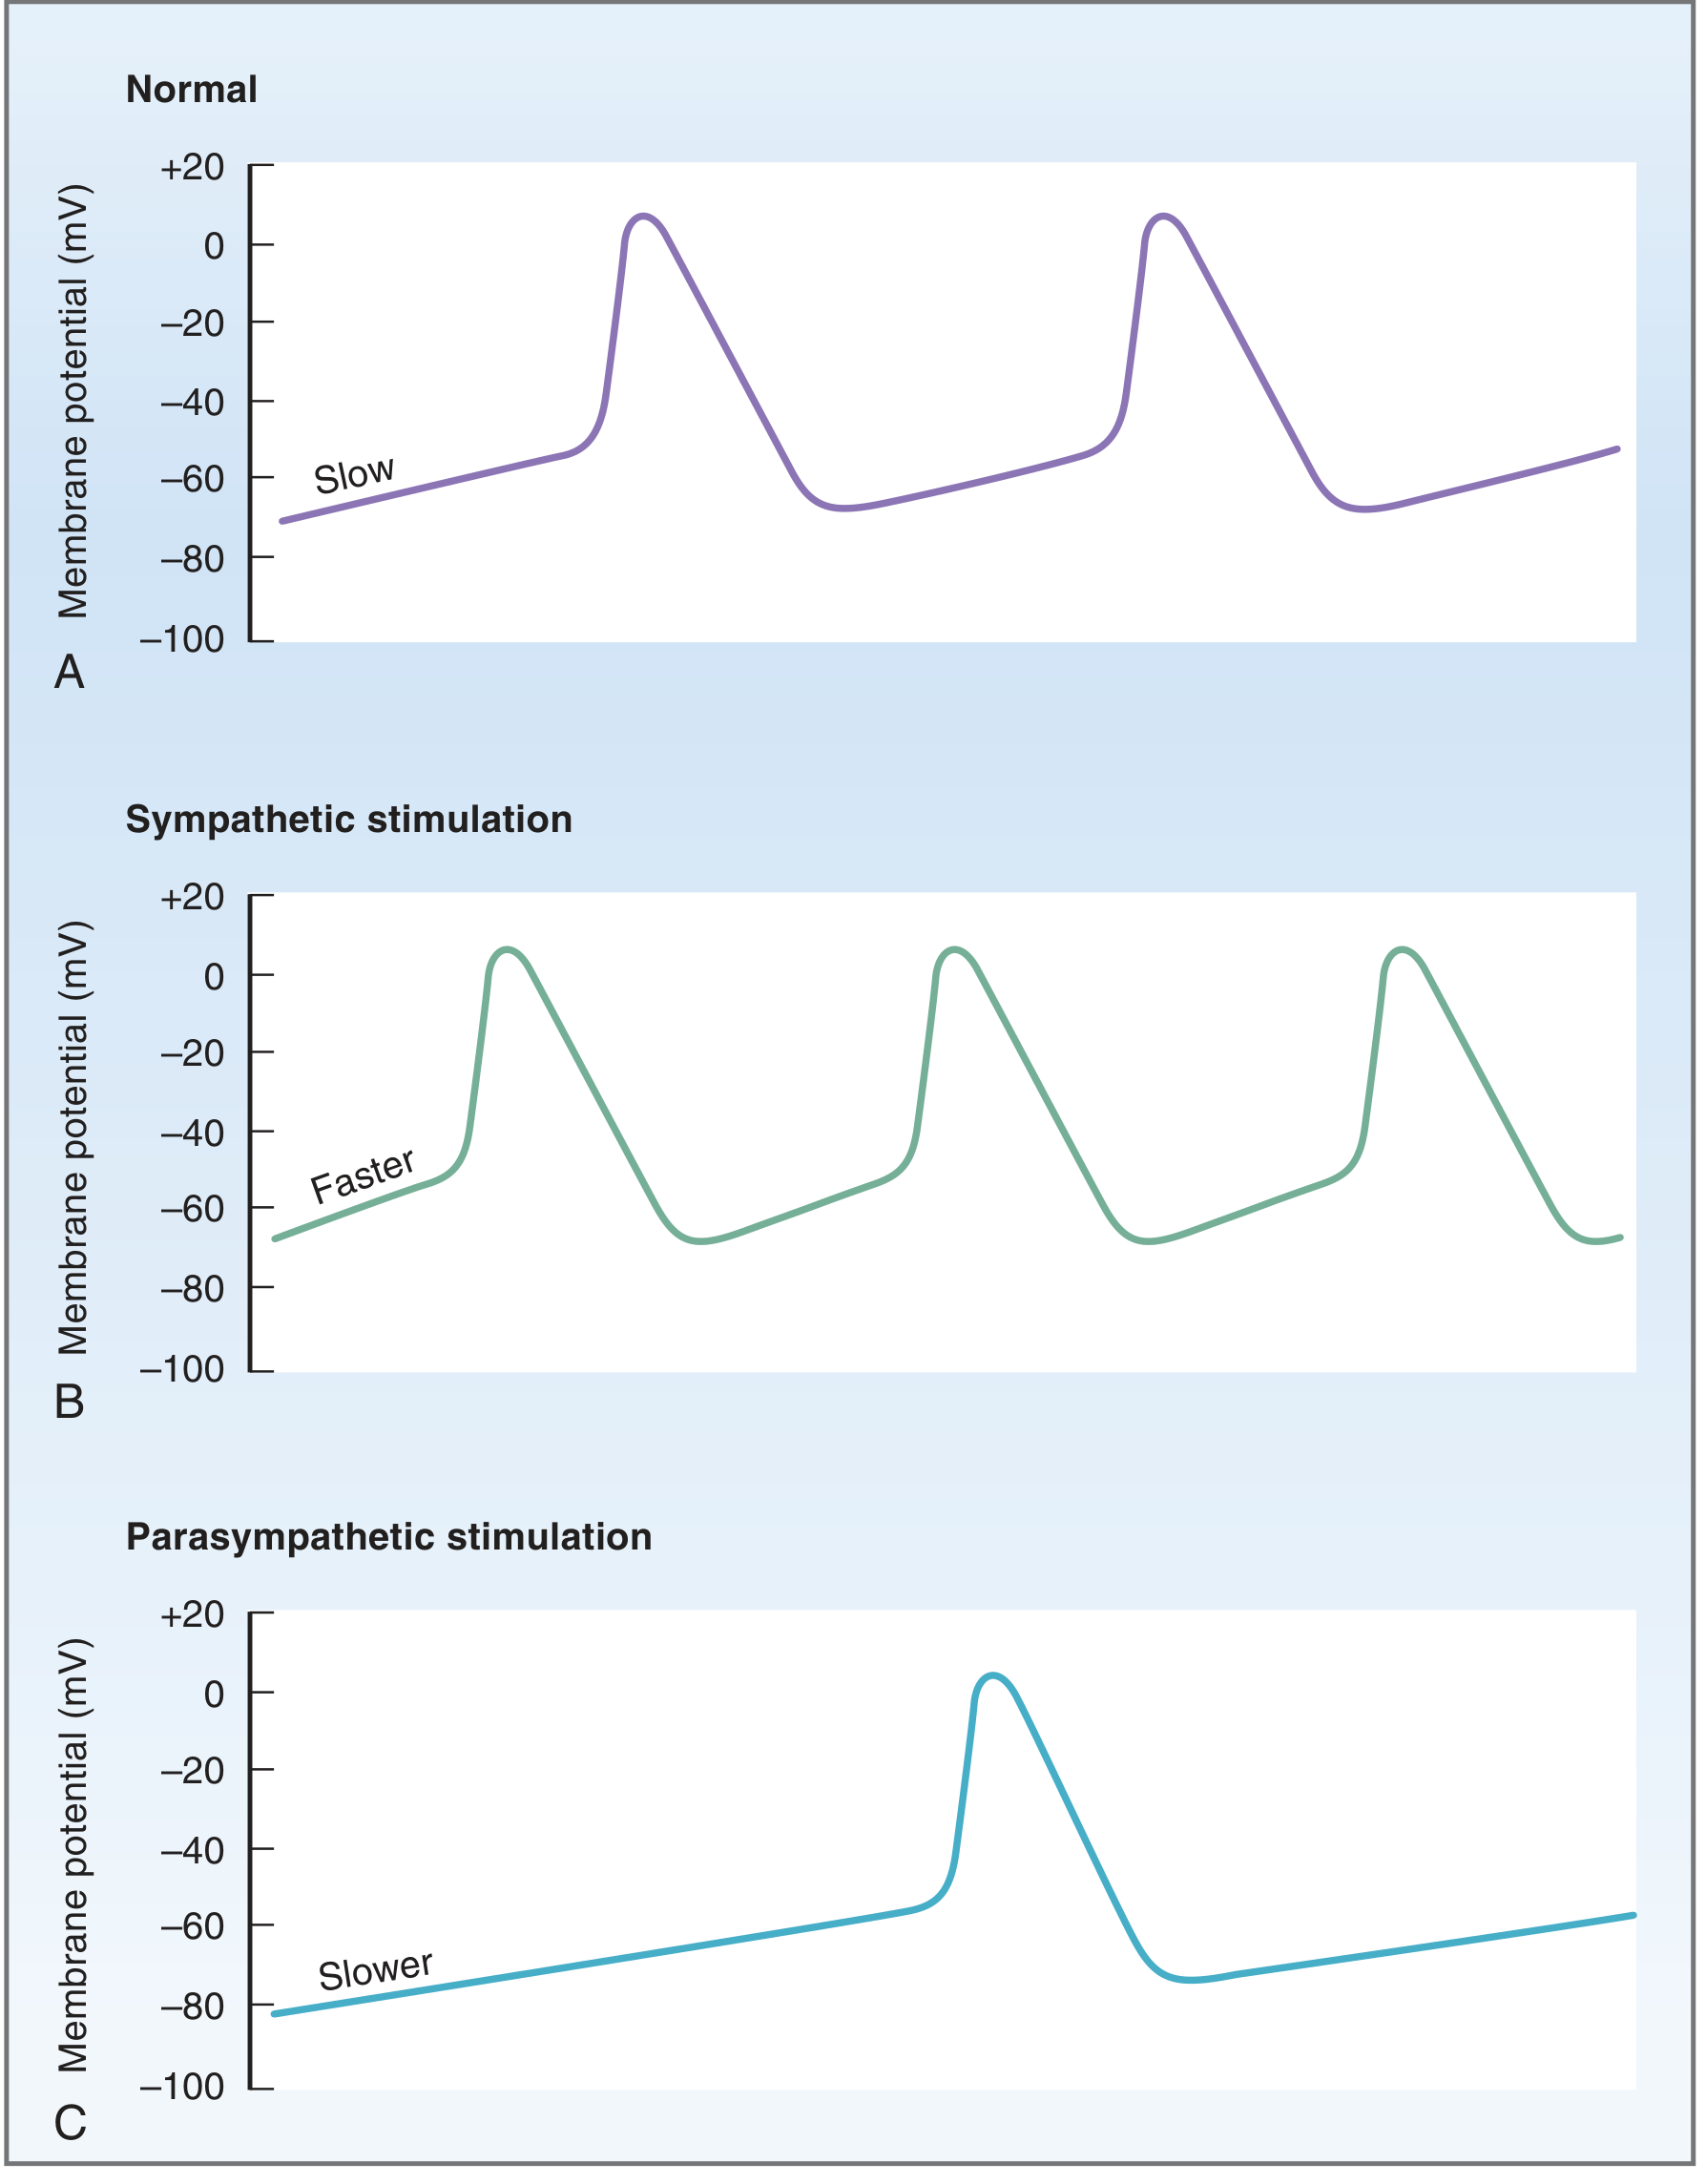
A: Normal SA node firing. B: Sympathetic stimulation - steeper Phase 4, increased firing rate. C: Parasympathetic stimulation - shallower Phase 4, hyperpolarized MDP, decreased firing rate.
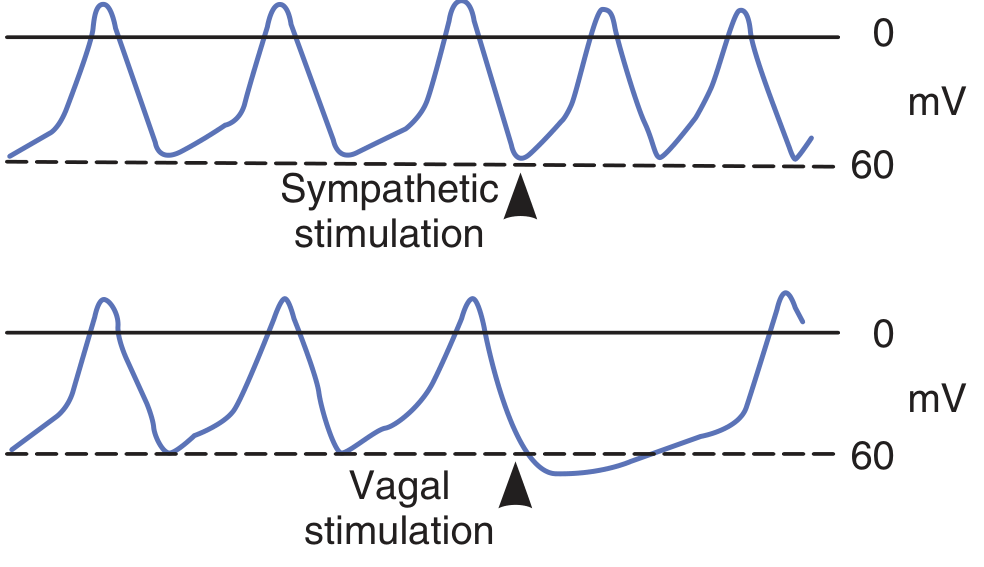
Note the reduced slope of the prepotential with vagal stimulation and increased spontaneous discharge rate with sympathetic stimulation.
8. How Autonomic Inputs Change Heart Rate: Summary Table
| Stimulus | Phase 4 slope | MDP | Threshold | Heart Rate |
|---|---|---|---|---|
| Sympathetic (NE, β₁) | ↑ Steeper (↑If, ↑ICa,L) | Unchanged | ↓ (lower) | ↑ Tachycardia |
| Parasympathetic (ACh, M2) | ↓ Flatter (↓If) | ↓ More negative (↑IKACh) | ↑ (higher) | ↓ Bradycardia |
| Thyroid hormone | ↑ Steeper | - | ↓ | ↑ HR |
| Hypercalcemia | Slower | - | ↑ | ↓ HR |
| Hypoxia/ischemia | Abnormal | Depolarized | Variable | Ectopic rhythms |
9. Clinical Relevance
| Drug/Condition | Effect on Pacemaker | Clinical Use |
|---|---|---|
| Ivabradine | Directly blocks If (HCN channels) | ↓ HR in angina, heart failure (pure rate-lowering without affecting contractility) |
| β-blockers (propranolol) | Block β₁ → ↓If, ↓ICa → slower Phase 4 | Tachyarrhythmias, angina, hypertension |
| Digoxin | ↑ vagal tone on SA/AV node | Atrial fibrillation (rate control) |
| Atropine | Blocks M2 → removes vagal inhibition | Symptomatic bradycardia |
| Hypokalaemia | Hyperpolarizes MDP, but also increases automaticity | Ventricular arrhythmias |
| Complete SA node failure | AV node becomes dominant pacemaker | Junctional escape rhythm (40-60/min) |
| Complete heart block | Purkinje fibers become dominant | Idioventricular rhythm (15-20/min), requires pacemaker |
10. Quick Revision Summary
PACEMAKER POTENTIAL (Phase 4) ionic sequence:
1. ↓ IK (K⁺ conductance falls after repolarization)
2. ↑ If = funny current (HCN channels: Na⁺+K⁺ inward) ← main driver
3. ↑ ICa,T (T-type Ca²⁺) ← completes prepotential to threshold
4. ↑ ICa,L (L-type Ca²⁺) ← ACTION POTENTIAL upstroke (NO fast Na⁺)
5. ↑ IK → repolarization → cycle repeats

Rate determined by: slope of Phase 4, level of MDP, and threshold potential
Sympathetic → ↑ slope + ↓ threshold → FASTER rate
Parasympathetic → ↓ slope + lower MDP + ↑ threshold → SLOWER rate
Sources:
- Costanzo Physiology, 7th Edition, Chapter 4 (Cardiac Action Potentials, Phase 4, Latent Pacemakers, Autonomic Effects)
- Ganong's Review of Medical Physiology, 26th Edition, Chapter 29 (Pacemaker Potentials)
- Medical Physiology (Boron & Boulpaep), Chapter on Autonomic Modulation of Pacemaker Activity
This is a shared conversation. Sign in to Orris to start your own chat.