
Capnographs
I'll look up capnographs from the medical library for a thorough answer.
Reading File
Now let me search the medical library and web in parallel for comprehensive capnograph coverage.
Finding Sources
Searching the Web
capnography capnograph monitoring clinical uses waveform interpretation
Good results. Now let me read the most detailed textbook sections in parallel.
Reading File
Reading File
Reading File
Excellent content. Let me now get the Roberts & Hedges block 7 content (more detailed capnography procedures) and fetch the waveform image, plus check Morgan & Mikhail for technology/types detail.
Reading File
Loading Image
Finding Sources
Let me get the Morgan & Mikhail and Murray & Nadel detailed content on capnograph types and clinical considerations.
Reading File
Reading File
Loading Image
I now have rich content from multiple authoritative sources. Let me also grab the Morgan & Mikhail waveform image and the Scott-Brown section on inspired/expired CO2 for completeness.
Reading File
Loading Image
I have all the content needed for a comprehensive answer. Let me now compose the full response.
Capnographs
A capnograph is a monitor that continuously measures and displays the CO2 concentration in exhaled (and inhaled) gas, breath by breath. The numerical value of CO2 at the end of each exhalation is called end-tidal CO2 (EtCO2 or PETCO2). Normal EtCO2 is approximately 35-45 mmHg, and it approximates PaCO2 with a physiologic gradient of 2-5 mmHg (EtCO2 is normally slightly lower).
Technology: How It Works
Most capnographs rely on infrared (IR) light absorption by CO2, governed by the Beer-Lambert law. CO2 absorbs IR at a specific wavelength; a sample cell is compared against a CO2-free reference chamber to yield a concentration reading.
There are two main sampling types:
| Feature | Sidestream (Diverting) | Mainstream (Non-diverting) |
|---|---|---|
| Gas sampling | Aspirates gas from circuit (50-250 mL/min) | Sensor sits directly in the airway circuit |
| Size | Small bedside monitor | Sensor adds dead space to circuit |
| Usability | Works with nasal cannula, mask, non-intubated patients | Best for intubated/ventilated patients |
| Lag time | Longer (aspiration delay) | Minimal |
| Pitfalls | Water precipitation, line obstruction, dilution of pediatric tidal volumes at high flow | Heavier sensor, adds dead space |
Sidestream devices can be used with modified nasal cannulas (with an integrated CO2 sampling port) or with IV catheters inserted into simple face masks - making them highly adaptable for non-intubated patients during monitored anesthesia care (MAC).
- Morgan and Mikhail's Clinical Anesthesiology, 7e, p. 226-227
- Barash Clinical Anesthesia, 9e, p. 2492
The Normal Capnogram Waveform
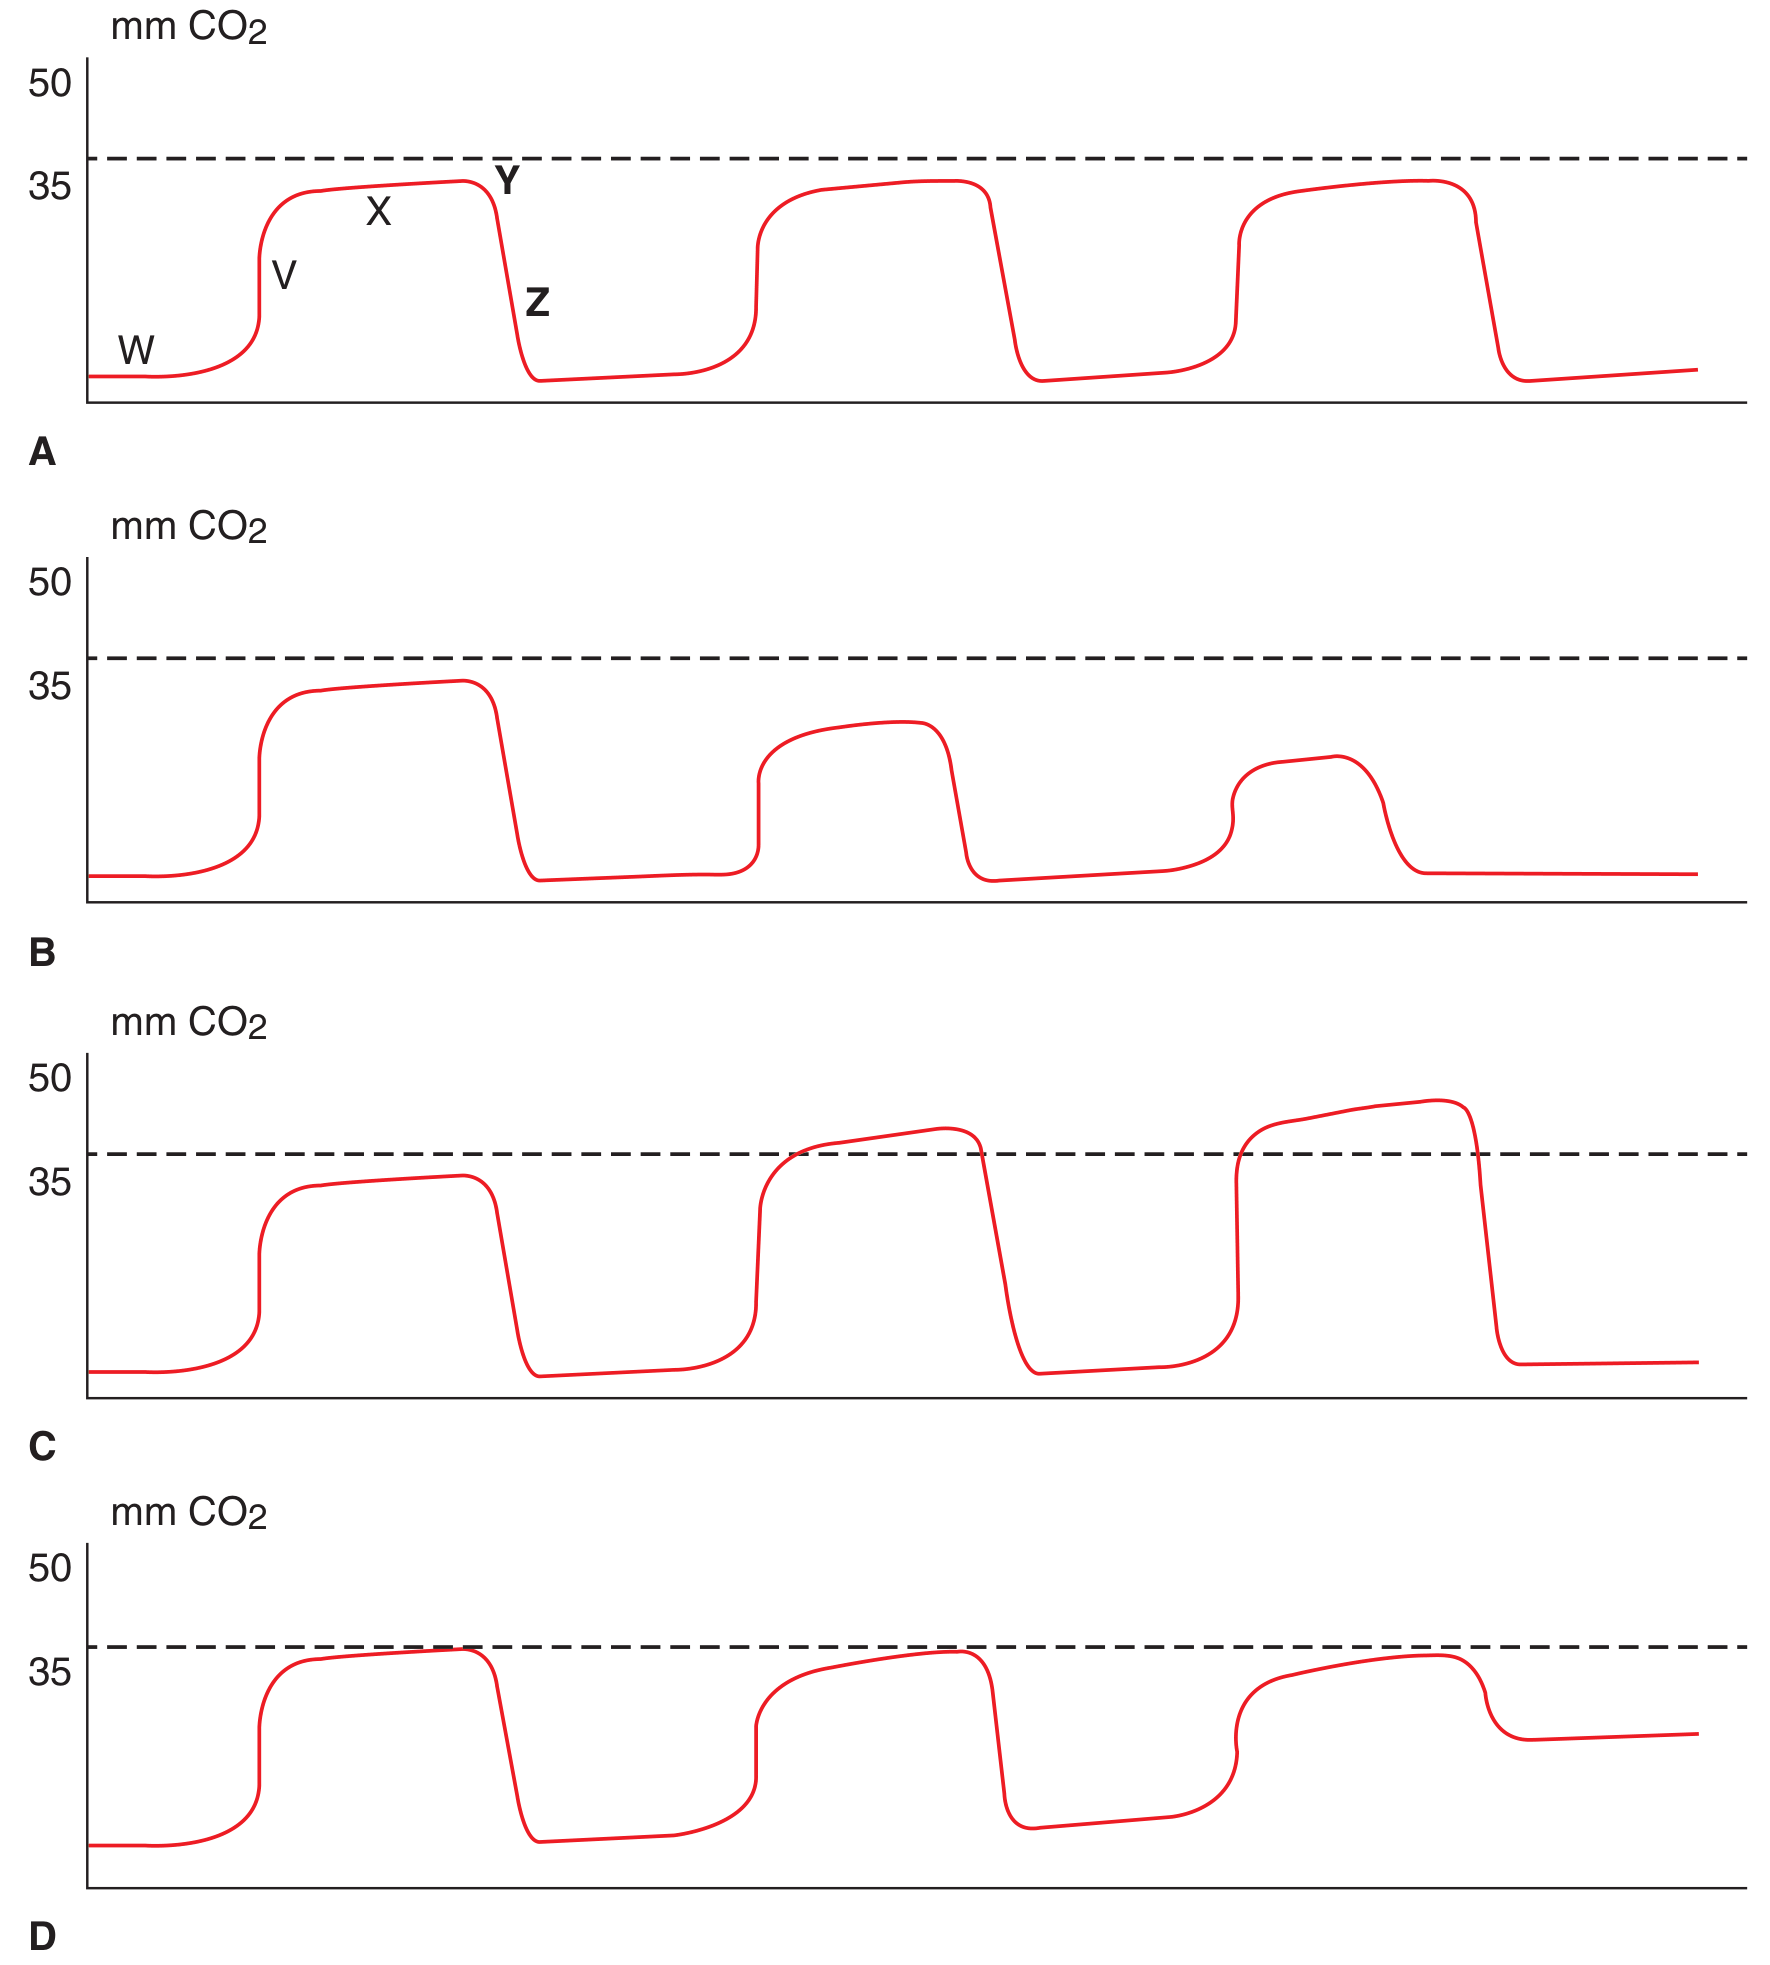
The capnogram is a time-CO2 plot with five recognizable phases (labeled W-Z in the diagram below):
-
W - Inspiratory baseline (zero CO2 during inspiration)
-
V - Expiratory upstroke (initial rise as dead-space gas mixes with alveolar gas)
-
X - Expiratory plateau (alveolar gas; near-flat segment)
-
Y - Peak EtCO2 (highest point at end-exhalation)
-
Z - Inspiratory downstroke (rapid fall as fresh gas enters)
-
Tintinalli's Emergency Medicine, p. 122 (Fig. 16-2)
Abnormal Waveform Patterns
| Pattern | What it Looks Like | Clinical Meaning |
|---|---|---|
| Apnea | Serial decreasing or absent waveforms | No gas exchange; respiratory arrest |
| Hypoventilation | Rising plateau, higher EtCO2 | Sedation, CNS depression, obstruction |
| Rebreathing/Air trapping | Elevated baseline (>0) | Exhausted CO2 absorber, stuck expiratory valve, COPD with air trapping |
| COPD pattern | No plateau reached before next inspiration; "shark fin" | Obstructive physiology; EtCO2 underestimates PaCO2 |
| Esophageal intubation | Low-level CO2 that rapidly tapers to zero after a few breaths | ETT in esophagus (some CO2 from swallowed gas, washed out quickly) |
| Sudden flat line | Abrupt drop to zero | Circuit disconnect, tube kinking, cardiac arrest |
| Malignant hyperthermia | Rapidly rising EtCO2 | Massively increased metabolic CO2 production |
- Morgan and Mikhail's Clinical Anesthesiology, 7e, p. 227
- Scott-Brown's Otorhinolaryngology, Vol 1, p. 390
EtCO2 During Cardiac Arrest
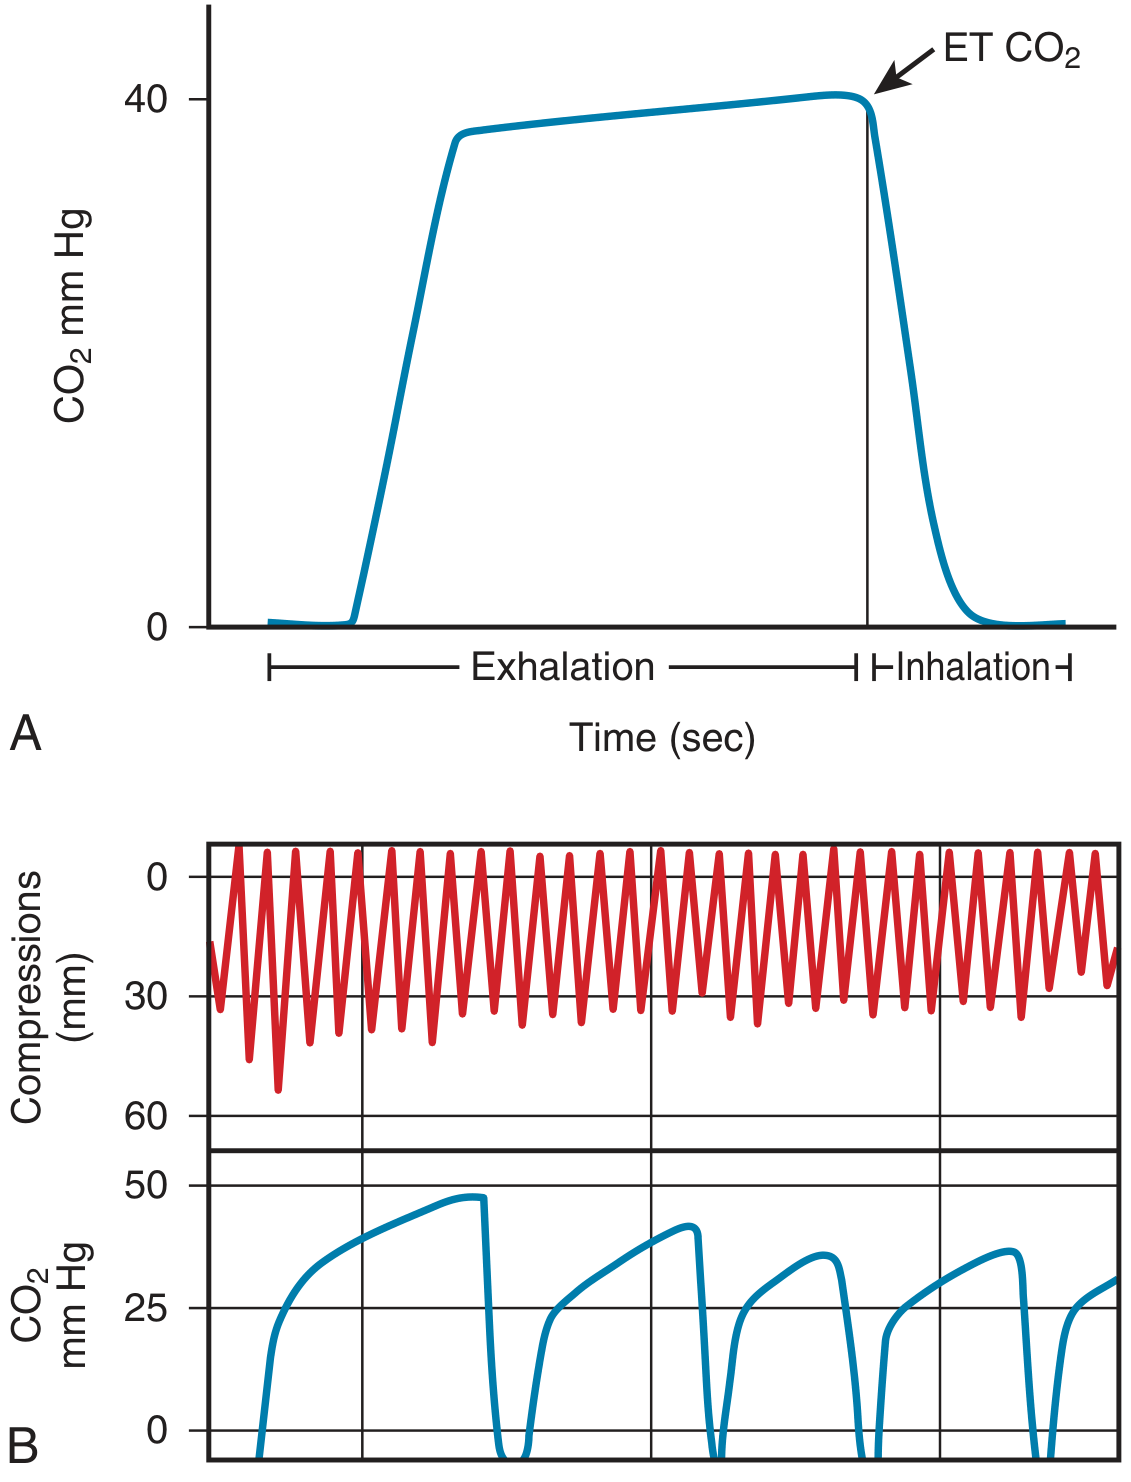
The image below illustrates capnography during CPR:
-
At cardiac arrest onset, PETCO2 falls abruptly
-
During effective CPR, PETCO2 rises and correlates with cardiac output, coronary perfusion pressure, and compression efficacy
-
A sudden rise in EtCO2 during CPR signals return of spontaneous circulation (ROSC) before pulse can be palpated
-
Persistently very low PETCO2 (<10 mmHg) after 20 minutes of adequate CPR may support a decision to terminate resuscitation
-
The 2015 resuscitation guidelines recommend continuous waveform capnography for all intubated patients during resuscitation
-
Roberts and Hedges' Clinical Procedures in Emergency Medicine, p. 415
Clinical Applications
1. Confirm Endotracheal Tube Placement
- Most reliable method for confirming tracheal vs. esophageal intubation
- Tracheal placement: sustained CO2 waveform over multiple breaths
- Esophageal placement: brief, declining CO2 signal that disappears within ~6 breaths
- Does not reliably detect mainstem bronchial intubation (both lungs must be assessed separately)
2. Monitor Ventilation Adequacy
- Continuous breath-by-breath respiratory rate (more accurate than impedance-based monitoring, which can misread chest wall movement without airflow)
- Detects hypoventilation, apnea, and airway obstruction earlier than pulse oximetry, especially when supplemental O2 is being given
- In one study, respiratory depression was 17.6 times more likely to be detected with capnography than standard monitoring alone
3. Procedural Sedation and Analgesia (PSA)
- Capnography detects earliest respiratory compromise during sedation
- Hypoxemia (SpO2 <90%) occurred an average of 45.6 seconds after the onset of apnea/disordered breathing detected by capnography
- All episodes of apnea >20 seconds in one MAC study were missed by the anesthesia provider but caught by capnography
- ACEP gives capnography a Level B recommendation for PSA in the ED
4. Pulmonary Embolism / Decreased Cardiac Output
- Pulmonary embolism increases alveolar dead space → widens PaCO2-EtCO2 gradient
- A sudden fall in EtCO2 with no change in ventilation = suspect PE, air embolism, or abrupt drop in cardiac output
- Very sensitive for venous air embolism during neurosurgery (sitting position)
5. Malignant Hyperthermia
- Rapidly rising EtCO2 with fever/rigidity is an early metabolic warning sign
6. COPD Management
- In COPD, the absence of an expiratory plateau makes EtCO2 an unreliable surrogate for PaCO2; transcutaneous CO2 (tcCO2) monitoring is preferred in these patients
Limitations
- EtCO2 is always slightly lower than PaCO2 (normal gradient 2-5 mmHg)
- In critically ill patients with V/Q mismatch, the gradient can be much wider and EtCO2 should not be used to estimate PaCO2
- Mouth breathing entrains room air and lowers readings
- Sampling line obstruction or water precipitation causes false low readings
- High aspiration rates in sidestream devices may dilute readings in small pediatric patients
Summary Table
| Clinical Scenario | EtCO2 Finding | Interpretation |
|---|---|---|
| Normal ventilation | 35-45 mmHg | Adequate alveolar ventilation |
| Hypoventilation | Rising >45 mmHg | Sedation excess, CNS depression |
| Hyperventilation | Falling <35 mmHg | Anxiety, pain, metabolic acidosis (compensatory) |
| Esophageal intubation | Transient low → zero | ETT misplaced |
| Cardiac arrest | Abrupt fall | Cessation of pulmonary perfusion |
| Effective CPR | 10-20+ mmHg | Proportional to cardiac output |
| ROSC | Sudden spike | Spontaneous circulation returned |
| PE / Air embolism | Sudden fall | Dead space increase |
| Malignant hyperthermia | Rapid rise | Hypermetabolic state |
| Rebreathing | Elevated baseline | CO2 absorber failure/valve leak |
Sources: Roberts and Hedges' Clinical Procedures in Emergency Medicine | Tintinalli's Emergency Medicine | Morgan and Mikhail's Clinical Anesthesiology, 7e | Barash Clinical Anesthesia, 9e | Scott-Brown's Otorhinolaryngology Head & Neck Surgery | Murray & Nadel's Textbook of Respiratory Medicine
This is a shared conversation. Sign in to Orris to start your own chat.