
Indices of thermal comfort - air pollution from the park textbook spm
Reading File
The query is about "indices of thermal comfort" and "air pollution from the park textbook SPM" - this sounds like it's from a specific textbook (possibly a public health or environmental health textbook, "park" likely refers to Park's Textbook of Preventive and Social Medicine). Let me search the library.
Finding Sources
Finding Sources
Both topics are in Park's Textbook of Preventive and Social Medicine, block 10. Let me read that block around both sections.
Reading File
Reading File
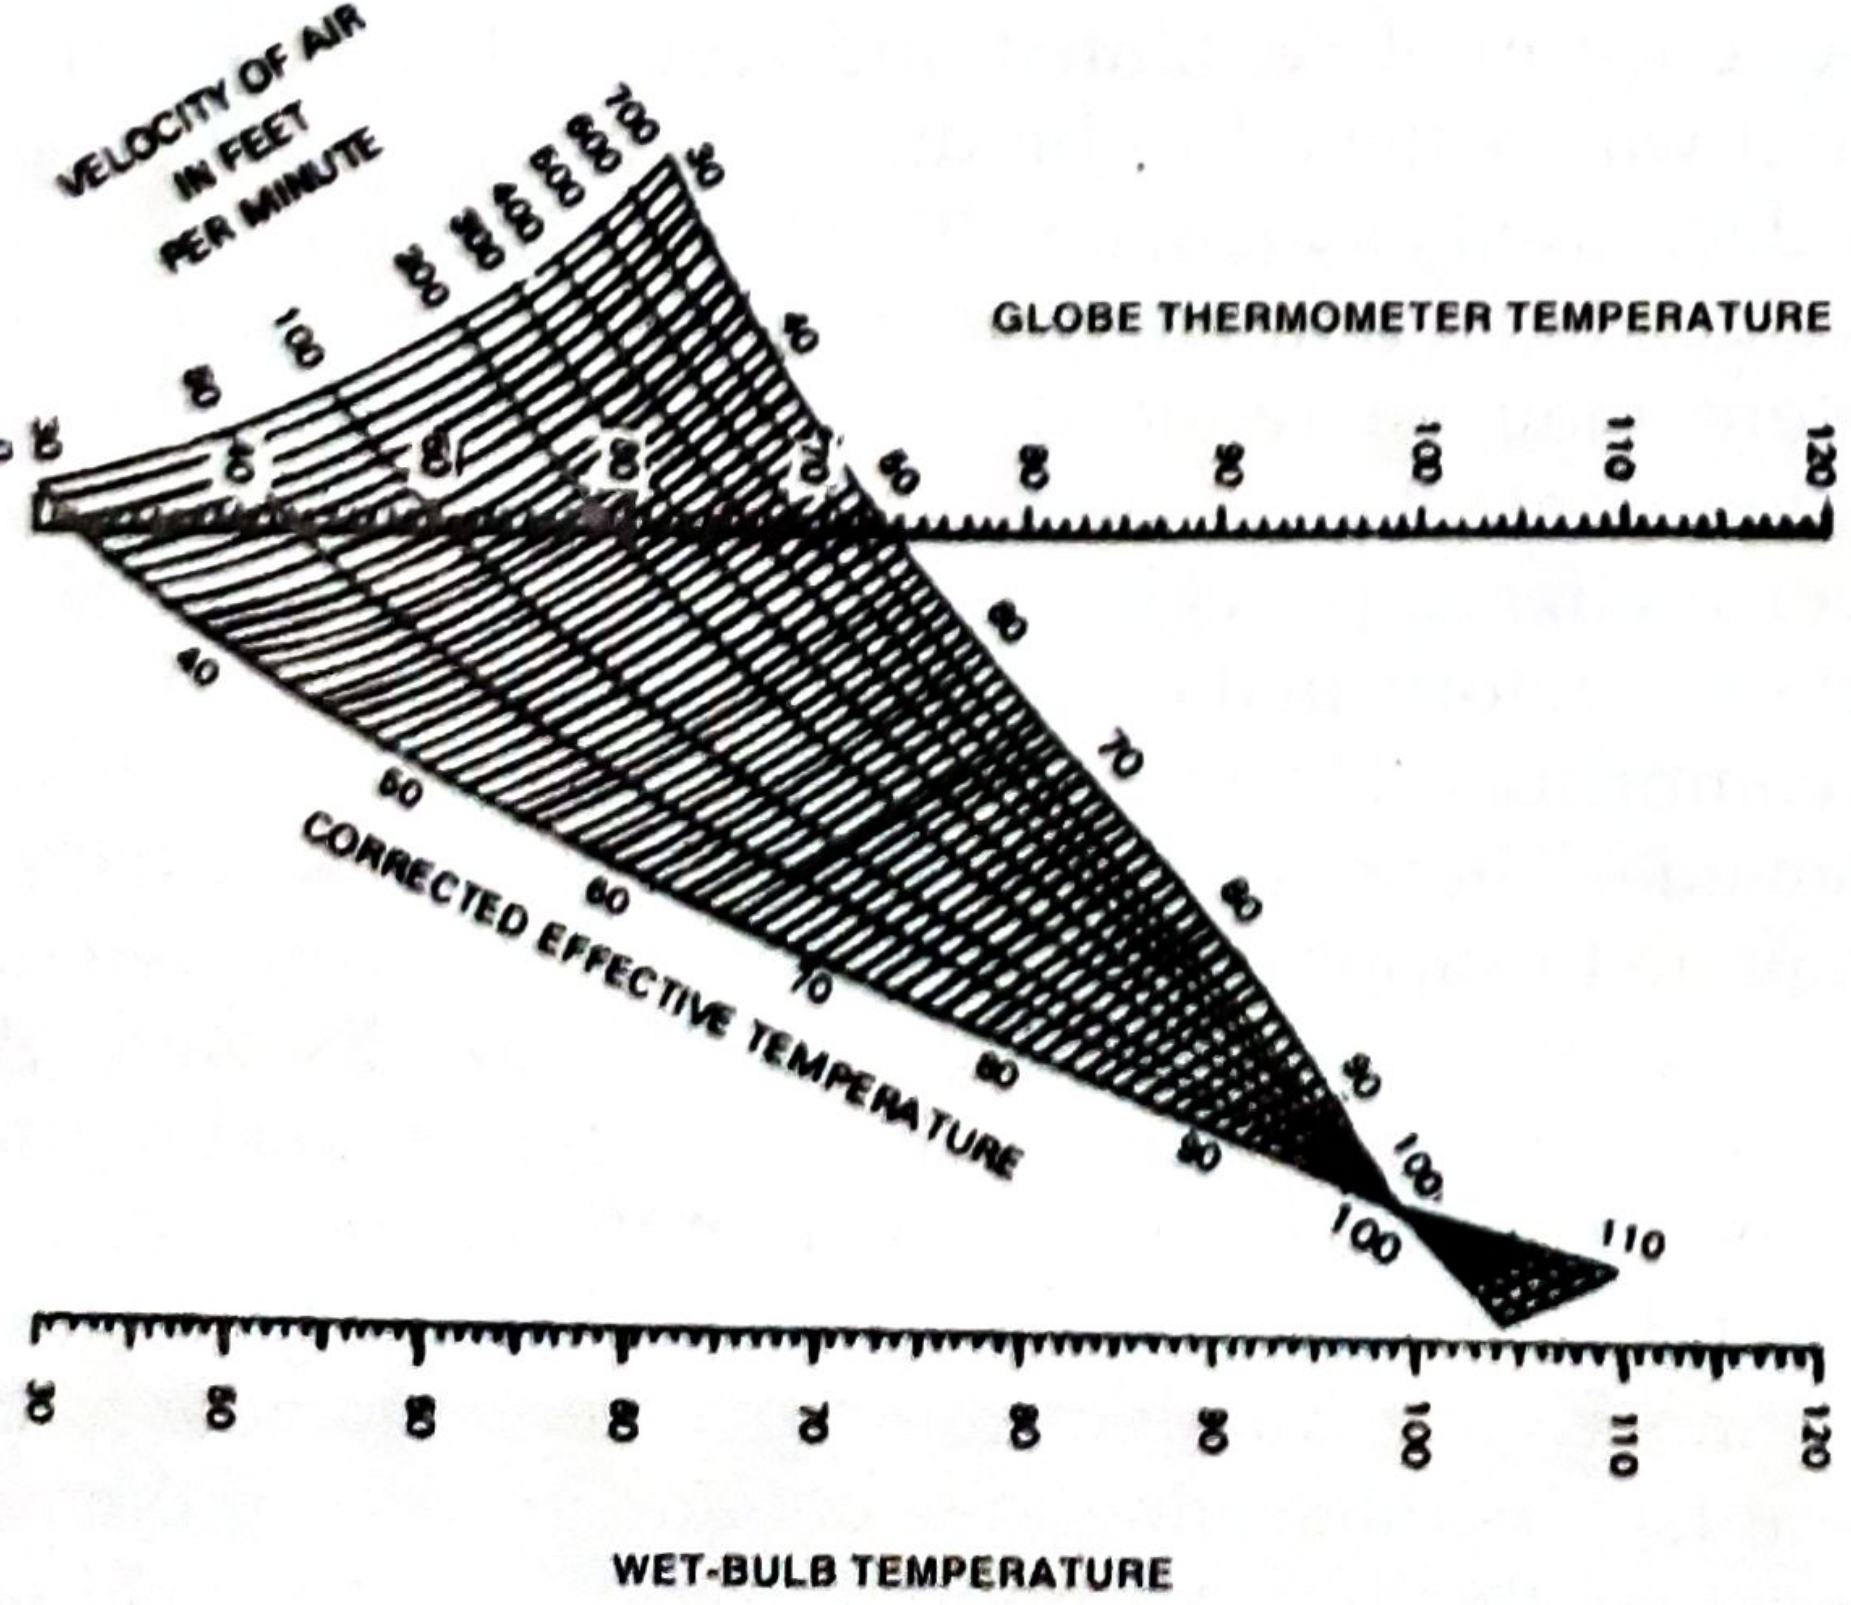
I have enough content for both topics. Let me also fetch the effective temperature chart image to include in the response.
Loading Image
Reading File
I now have all the content needed for both topics. Here is the comprehensive answer from Park's Textbook of Preventive and Social Medicine:
Indices of Thermal Comfort
(Park's Textbook of Preventive and Social Medicine)
Thermal comfort is a complex entity. Several indices have been developed over time to express thermal comfort and heat stress:
1. Air Temperature
For a long time, air temperature alone was used as an index, but it was found to be inadequate on its own.
2. Air Temperature and Humidity
Air temperature combined with humidity was tried next, but this too proved unsatisfactory.
3. Cooling Power (Kata Thermometer)
Air temperature, humidity, and air movement were combined and expressed as the "cooling power" of air. Hill devised the Kata Thermometer to measure this.
- Dry Kata reading: ≥6 = thermal comfort
- Wet Kata reading: ≥20 = thermal comfort
Further research showed Kata cooling powers are also not reliable.
4. Effective Temperature (ET)
Effective temperature is an arbitrary index that combines the effect of temperature, humidity, and air movement on the sensation of warmth or cold. The ET value is defined as:
The temperature of still, saturated air that would induce the same sensation of warmth or cold as the given conditions.
- Developed in 1923 by Houghton and Yaglou at the Pittsburgh Laboratory of the American Society of Heating and Ventilation Engineers.
- Two scales: one for men stripped to the waist, another for men in full indoor clothing.
- Limitation: Ignores radiant heat from surrounding structures.
5. Corrected Effective Temperature (CET)
An improvement over ET. Instead of dry bulb temperature, the Globe Thermometer reading is used to account for radiant heat. CET covers all four factors:
| Factor | Included in ET | Included in CET |
|---|---|---|
| Air temperature | Yes | Yes (via globe thermometer) |
| Air velocity | Yes | Yes |
| Humidity | Yes | Yes |
| Mean radiant heat | No | Yes |
- CET is read from prepared nomograms using globe thermometer temperature, wet bulb temperature, and air speed.
- CET is preferred whenever a source of radiation is present.
- Both ET and CET scales are currently widely used as indices of thermal comfort.
6. McArdle's Predicted Four-Hour Sweat Rate (P4SR)
McArdle and associates took 4.5 litres of sweat in 4 hours as the maximum allowable sweat rate compatible with normal physiological reaction in acclimatized, healthy young men. A P4SR value of 3 is the upper limit of the comfort zone.
Comfort Zones (Evaluated in India)
Based on Corrected Effective Temperature (CET)
| Category | CET (°C) |
|---|---|
| Pleasant and cool | 20 |
| Comfortable and cool | 20-25 |
| Comfortable | 25-27 |
| Hot and uncomfortable | 27-28 |
| Extremely hot | 28+ |
| Intolerably hot | 30+ |
Based on P4SR
| Category | P4SR (litres) |
|---|---|
| Comfort zone | 1-3 |
| Just tolerable | 3-4.5 |
| Intolerable | 4.5+ |
Air Pollution
(Park's Textbook of Preventive and Social Medicine)
Definition: Air pollution signifies the presence in the ambient atmosphere of substances (gases, mixtures of gases, particulate matter) generated by human activities in concentrations that interfere with human health, safety, or comfort, or are injurious to vegetation, animals, and other environmental media.
Basic Definitions
Primary Air Pollutants
Pollutants emitted directly into the atmosphere from a source such as a factory chimney, exhaust pipe, or through suspension of contaminated dusts by wind. Can be measured at the source itself.
Secondary Air Pollutants
Pollutants formed within the atmosphere from chemical reactions of primary pollutants, often involving oxygen and water. The most familiar example is ozone, which arises almost entirely from atmospheric chemical reactions.
By Physical State
- Gaseous air pollutants: Present as gases or vapors (individual small molecules). Readily enter the respiratory system; water-soluble ones deposit in the upper respiratory tract and may not reach the deep lung.
- Particulate air pollutants: Material in solid or liquid phase suspended in the atmosphere. Range in size from 1-2 μm (secondary particles) to 100 μm (coarse dust/sea salt). Fine particles <2.5 μm (PM2.5) penetrate deep into the lungs.
By Scale of Distribution
| Scale | Examples | Lifetime |
|---|---|---|
| Local | Biomass burning (household/neighbourhood) | Short |
| Urban | Nitrogen oxides, CO from road traffic | Hours |
| Regional | Fine particles (<2.5 μm), ozone | Days to weeks |
| Hemispheric/Global | CO₂, N₂O, methane (greenhouse gases) | Years |
Sources of Air Pollution
(a) Automobiles: Major urban source. Emit hydrocarbons, carbon monoxide, lead, nitrogen oxides, and particulate matter. In strong sunlight, hydrocarbons + NOx form photochemical oxidant pollutants. Diesel engines emit black smoke and malodorous fumes when misused.
(b) Other sources (from the text) include industrial factories, combustion of biomass fuels (especially in developing countries), and various chemical reactions within the atmosphere.
Source: Park's Textbook of Preventive and Social Medicine, pp. 833-834
Heat stress index?
The Heat Stress Index (HSI) was developed by Belding and Hatch. It compares the evaporative cooling required to maintain thermal balance against the maximum evaporative capacity of the environment, expressed as a percentage.
Searching sources...
Finding Sources
Finding Sources
Reading File
Here is the full content from Park's on the Heat Stress Index:
Heat Stress Indices
(Park's Textbook of Preventive and Social Medicine)
Heat stress is the burden or load of heat that must be dissipated if the body is to remain in thermal equilibrium. The factors that influence it are:
- Metabolic rate
- Air temperature
- Humidity
- Air movement
- Radiant temperature
The amount of heat gained by the body must equal the amount lost from it.
Many heat stress indices have been devised, but none is adequate to be valid in all possible complexities of work rate, air temperature, air movement, etc. The three main ones are:
(a) Equatorial Comfort Index (ECI)
Denotes the temperature of still, saturated air which is physiologically equivalent to the climate under consideration.
(b) Heat Stress Index (HSI)
- Takes into consideration the metabolic rate and the principal channels of heat exchange between the human body and the environment.
- The HSI represents the percentage of the heat storage capacity of an average man.
- Nomograms have been provided from which the HSI value can be easily calculated.
Interpretation of HSI Values
| HSI Value | Interpretation |
|---|---|
| 0 | No thermal stress |
| 10-30 | Moderate to mild heat strain |
| 40-60 | Severe heat strain |
| 70-90 | Very severe heat strain |
| 100 | Upper limit of heat tolerance |
(c) Predicted Four-Hour Sweat Rate (P4SR)
- The rate at which a man sweats is a good index of heat stress.
- 4.5 litres in 4 hours = upper limit of tolerance for work in a hot environment.
- 2.5 litres in 4 hours = optimal sweat rate for a working man.
- P4SR is applicable only when sweating occurs.
Effects of Heat Stress
Up to 14 disorders from heat exposure have been recognized. The important ones include:
-
Heat Stroke - Failure of the heat-regulating mechanism. Body temperature may rise to 110°F (43.3°C). Characterized by delirium, convulsions, loss of consciousness, and dry/hot skin (classically no sweating). Death/case ratio can reach 40% or more even with prompt treatment.
-
Other disorders (heat exhaustion, heat cramps, heat syncope, etc.) are also described in the text.
Source: Park's Textbook of Preventive and Social Medicine, p. 849
This is a shared conversation. Sign in to Orris to start your own chat.