
Signal transduction
signal transduction pathways diagram receptor second messenger
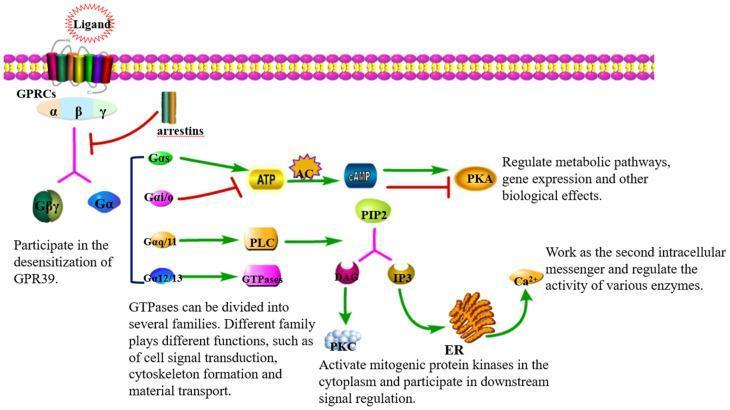
This pathophysiology diagram illustrates G-protein-coupled receptor (GPCR) signal transduction pathways across a plasma membrane. The schematic details four primary Gα subunit cascades. The Gαs pathway activates adenylate cyclase (AC) to convert ATP into cAMP, which stimulates Protein Kinase A (PKA). Conversely, Gαi/o inhibits AC, reducing cAMP and inhibiting PKA activity. The Gαq/11 pathway activates Phospholipase C (PLC), which cleaves PIP2 into diacylglycerol (DAG) and inositol triphosphate (IP3). DAG subsequently activates Protein Kinase C (PKC), while IP3 triggers calcium (Ca2+) release from the endoplasmic reticulum (ER) to serve as a second messenger. The Gα12/13 pathway is shown activating GTPases, involved in cytoskeleton and signal regulation. Additionally, the diagram depicts GPCR desensitization through arrestins and the dissociation of the Gβγ complex. The visual highlights the molecular mechanisms by which extracellular ligands regulate metabolic pathways, gene expression, and enzyme activity in human cellular physiology.
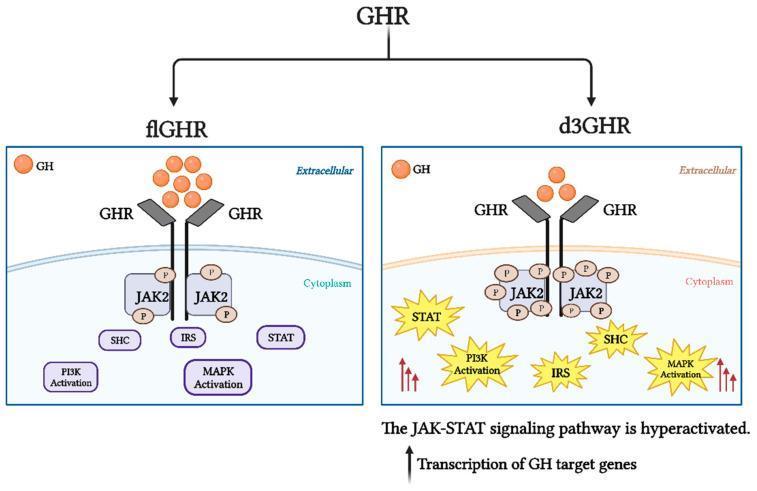
This pathophysiology diagram compares the intracellular signaling pathways of the full-length growth hormone receptor (flGHR) and the exon 3-deleted growth hormone receptor (d3GHR). Both pathways illustrate Growth Hormone (GH) binding to the extracellular domain of the GHR, leading to the recruitment and phosphorylation of Janus kinase 2 (JAK2) in the cytoplasm. Downstream signal transduction involves the activation of SHC, IRS, STAT, PI3K, and MAPK pathways. In the d3GHR variant, the diagram depicts hyperactivation of these signaling cascades, visually indicated by 'burst' icons around the cytoplasmic proteins (STAT, PI3K, IRS, MAPK), multiple phosphorylation markers on JAK2, and red upward arrows. This hyperactivation in the d3GHR pathway is associated with increased sensitivity of the JAK-STAT pathway, resulting in enhanced transcription of GH target genes compared to the standard flGHR isoform. The illustration serves as an educational tool for endocrinology and molecular biology to demonstrate how genetic variations in receptor structure influence hormonal signal intensity and gene expression.
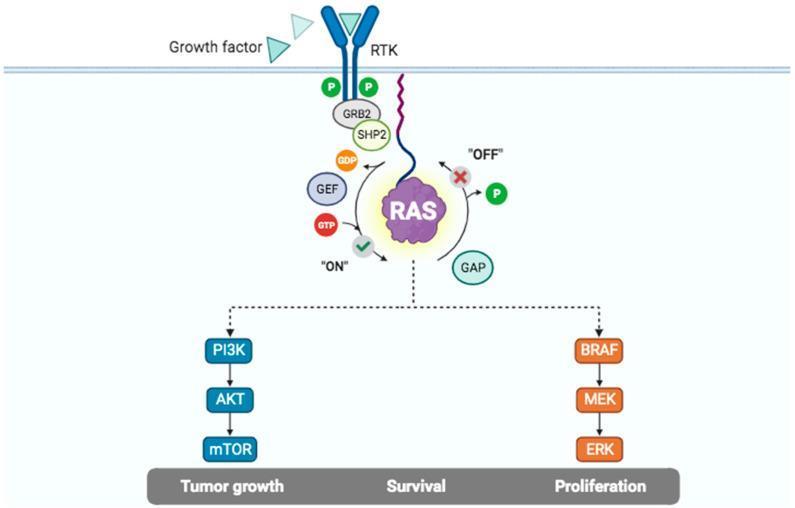
This pathophysiology diagram illustrates the Receptor Tyrosine Kinase (RTK) and RAS signaling pathway, highlighting mechanisms of intracellular signal transduction. The process initiates at the plasma membrane where 'Growth factors' bind to the extracellular domain of an RTK. This triggers intracellular autophosphorylation, represented by green 'P' markers, which recruits adapter proteins GRB2 and SHP2. The central component is the RAS molecular switch, shown cycling between an 'ON' state (GTP-bound) and an 'OFF' state (GDP-bound). Transition to the active 'ON' state is facilitated by Guanine Nucleotide Exchange Factors (GEF), while inactivation is mediated by GTPase-activating proteins (GAP). Activated RAS triggers two primary downstream effector cascades: the PI3K/AKT/mTOR pathway and the BRAF/MEK/ERK (MAPK) pathway. The diagram links these pathways to critical biological outcomes including 'Tumor growth', 'Survival', and 'Proliferation'. This educational visual is designed to explain oncogenic signaling and cellular regulation at a level suitable for medical and biomedical students.
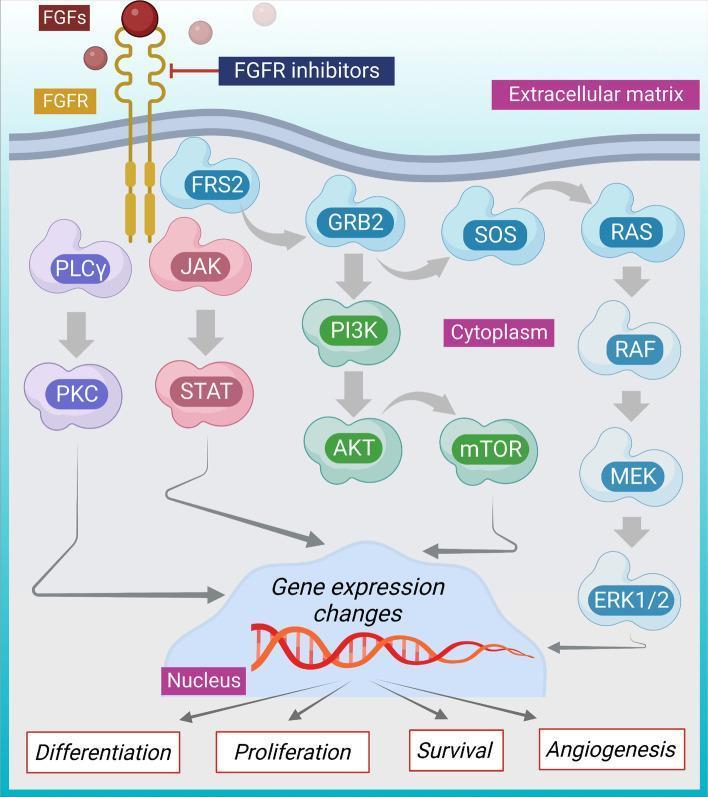
This medical illustration depicts the Fibroblast Growth Factor Receptor (FGFR) signaling pathway, a key mechanism in oncology, particularly breast cancer. The diagram is organized vertically, showing signal transduction from the extracellular matrix, through the cell membrane and cytoplasm, to the nucleus. At the top, Fibroblast Growth Factors (FGFs) bind to the transmembrane FGFR, inducing receptor dimerization. FGFR inhibitors are shown targeting this initial step. Intracellularly, the signal branches into four major cascades: 1. PLCγ leading to Protein Kinase C (PKC) activation. 2. JAK activating STAT proteins. 3. FRS2/GRB2/SOS activating the PI3K/AKT/mTOR pathway. 4. The RAS/RAF/MEK/ERK1/2 (MAPK) pathway. All four pathways converge on the nucleus to induce 'Gene expression changes,' illustrated by a DNA double helix. These genomic changes drive downstream oncogenic cellular responses including differentiation, proliferation, survival, and angiogenesis. The diagram uses arrows to indicate activation and T-bars to represent therapeutic inhibition, serving as an educational model for targeted cancer therapy.
Signal Transduction
1. Modes of Cell Communication
| Mode | Mechanism | Example |
|---|---|---|
| Endocrine | Ligand enters circulation, acts on distant organ | Insulin from pancreas acting on muscle |
| Paracrine | Ligand acts on neighboring cells in same tissue | Cytokines in a lymph node |
| Autocrine | Cell signals itself | Growth factors in some tumors |
| Juxtacrine | Direct cell-to-cell or cell-matrix contact | Notch-Delta signaling in development |
- Medical Physiology, p. (block 1, lines 1464-1482)
2. Types of Receptors
A. Receptor Tyrosine Kinases (RTKs)
B. Non-Receptor Tyrosine Kinases (e.g., Src-family)
C. G Protein-Coupled Receptors (GPCRs)
- Gαs - activates adenylate cyclase → ↑cAMP → activates PKA
- Gαi/o - inhibits adenylate cyclase → ↓cAMP → inhibits PKA
- Gαq/11 - activates phospholipase C (PLC) → cleaves PIP2 into IP3 (triggers Ca²⁺ release from ER) + DAG (activates PKC)
- Gα12/13 - activates Rho GTPases → cytoskeletal remodeling
D. Nuclear Receptors
E. Notch Receptors
F. Wnt/Frizzled Pathway
- Robbins, Cotran & Kumar, pp. 32-35
3. Core Second Messenger Systems
| Second Messenger | Source | Key Effectors |
|---|---|---|
| cAMP | Adenylate cyclase from ATP | PKA → CREB (transcription), phosphorylase kinase, ion channels |
| IP3 | PLC from PIP2 | Binds IP3R on ER → Ca²⁺ release |
| DAG | PLC from PIP2 | Activates PKC (with Ca²⁺) |
| Ca²⁺ | ER (via IP3) or extracellular | Calmodulin → CaM kinases, MLCK, calpain |
| cGMP | Guanylate cyclase (NO-stimulated) | PKG, PDE inhibition, smooth muscle relaxation |
4. Major Downstream Pathways
RAS-MAPK Pathway
PI3K-AKT-mTOR Pathway
JAK-STAT Pathway
NF-κB Pathway
- Firestein & Kelley's Textbook of Rheumatology, pp. 1330-1634
5. Signaling Networks, Nodes, and Hubs
- Enzyme activation or inactivation
- Nuclear/cytoplasmic shuttling of transcription factors
- Actin polymerization or depolymerization
- Protein stabilization or degradation
- Feedback loop activation
- Robbins, Cotran & Kumar, p. 34
6. Receptor Diagrams
7. Clinical Relevance
| Disease/Drug | Pathway Involved |
|---|---|
| Cancer (many types) | Mutated RAS (constitutively active), loss of PTEN, amplified RTKs (EGFR in lung, HER2 in breast) |
| Rheumatoid Arthritis | JAK-STAT pathway; targeted by JAK inhibitors (tofacitinib, baricitinib) |
| Bipolar Disorder | Lithium inhibits GSK3β and phosphoinositide enzymes upstream of PKC |
| Diabetes (Type 2) | Defective insulin receptor (RTK) or post-receptor PI3K-AKT signaling |
| Hirschsprung disease | Loss-of-function mutations in RET receptor tyrosine kinase |
| Wnt pathway cancers | β-catenin accumulation (colorectal cancer - APC mutations) |
| Targeted therapies | Imatinib (BCR-ABL kinase), erlotinib (EGFR), vemurafenib (BRAF V600E) |
- Harrison's Principles of Internal Medicine 22E (2025), p. 3696
Summary
- Reception - extracellular ligand binds a receptor
- Transduction - receptor activates intracellular intermediaries (G proteins, kinase cascades, second messengers)
- Amplification - kinase cascades exponentially amplify the signal
- Integration - multiple pathways converge on transcription factors
- Response - altered gene expression, enzyme activity, cell behavior
- Termination - phosphatases, GTPase activity, receptor internalization, and feedback loops shut off the signal