
Mitochondrial shuttlesystem as a duagrams
Mitochondrial Shuttle Systems
1. Glycerol 3-Phosphate Shuttle
Diagram (Basic Medical Biochemistry, Fig. 24.9):
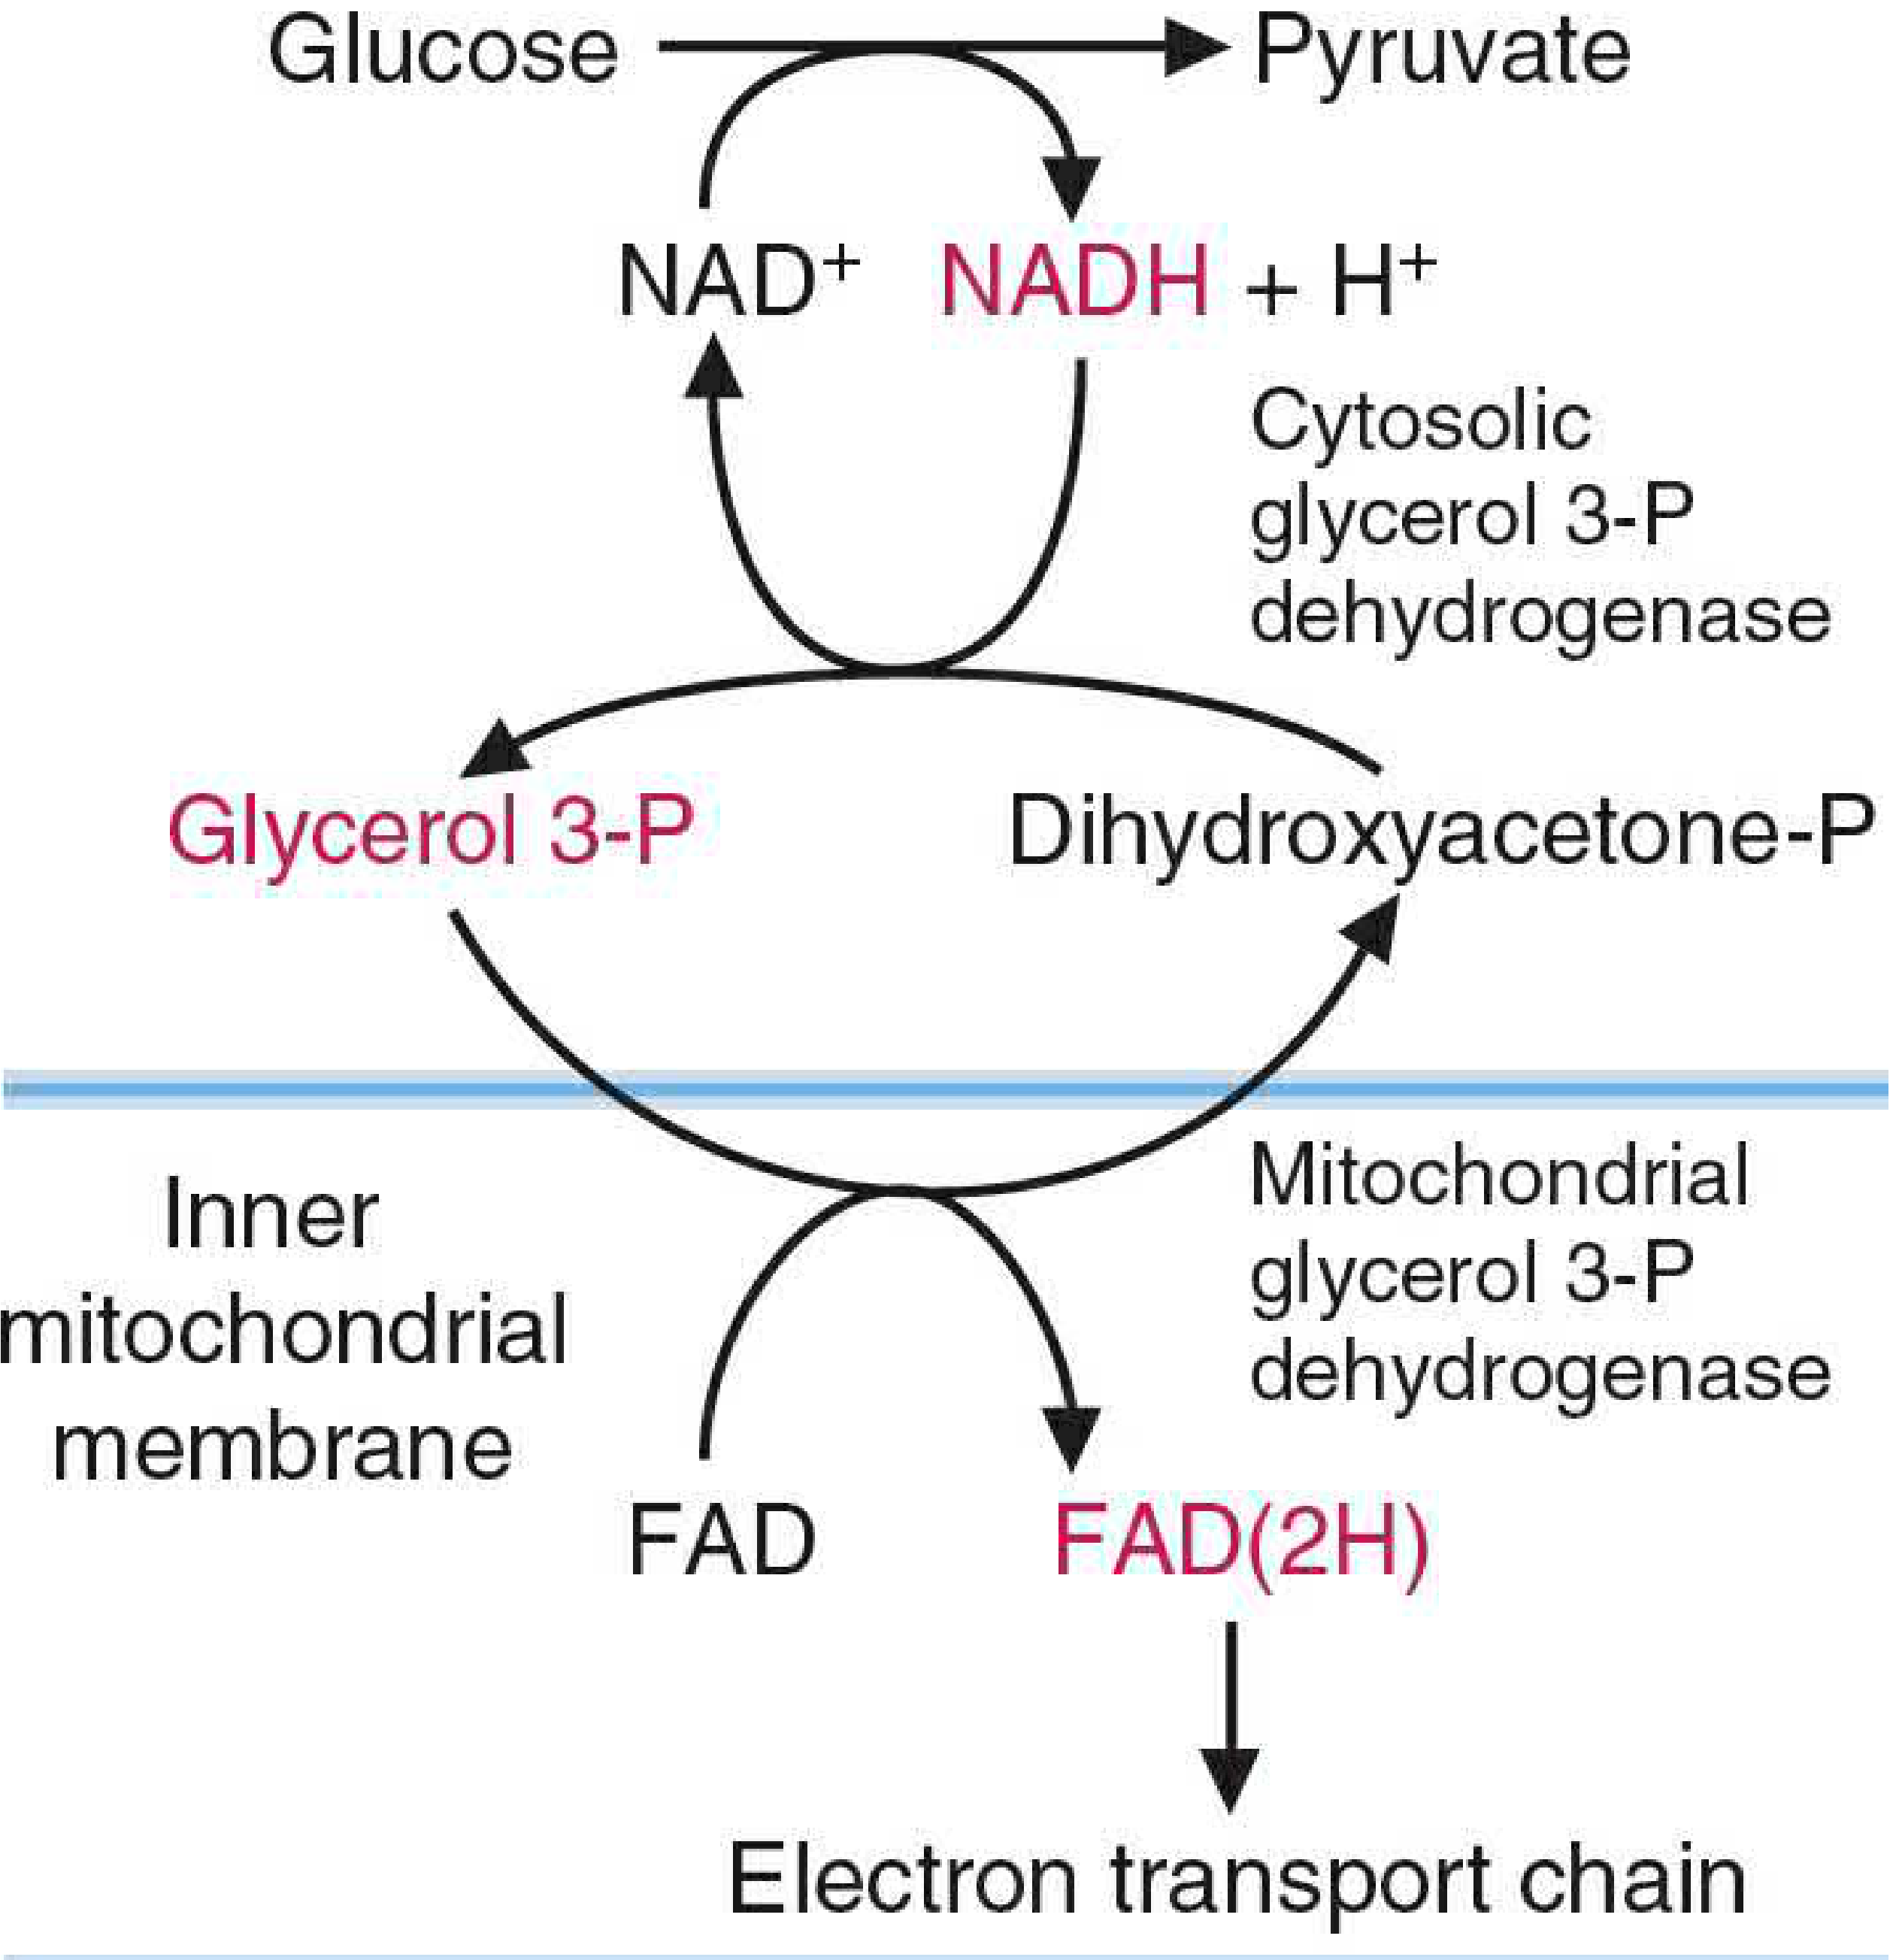
Diagram (Lippincott Biochemistry, Fig. 6.17A - with chemical structures):
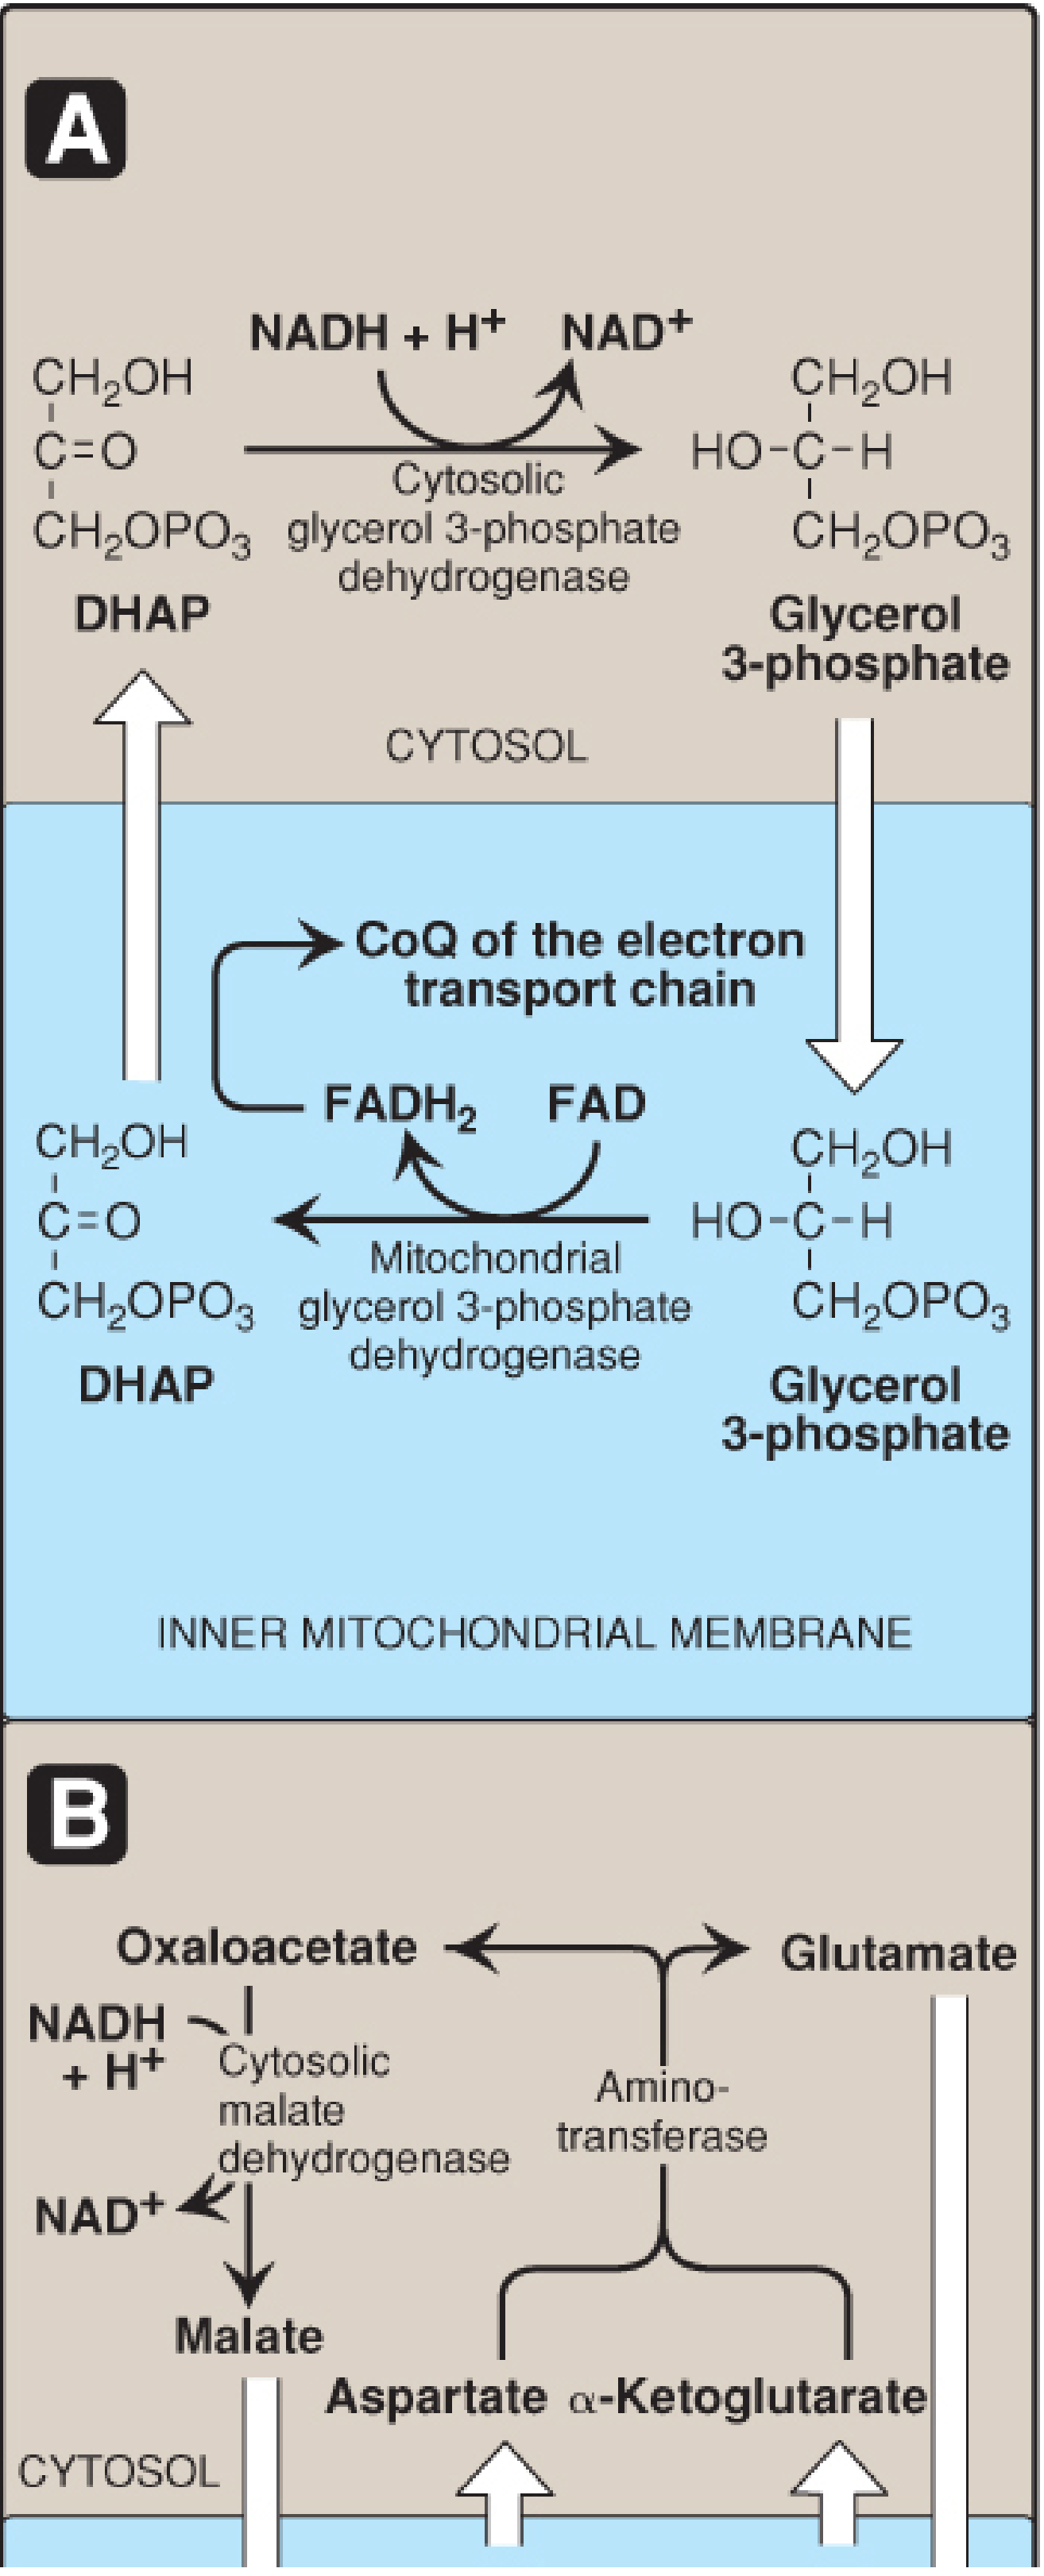
Steps:
| Step | Location | Reaction |
|---|---|---|
| 1 | Cytosol | DHAP + NADH + H+ → Glycerol 3-P + NAD+ (cytosolic glycerol 3-P dehydrogenase) |
| 2 | Glycerol 3-P diffuses | Passes through outer membrane to the IMM surface |
| 3 | IMM (outer face) | Glycerol 3-P + FAD → DHAP + FADH2 (mitochondrial glycerol 3-P dehydrogenase) |
| 4 | DHAP returns | Back to cytosol to continue the shuttle |
| 5 | FADH2 | Donates electrons to CoQ → ETC → ~1.5 ATP |
NADH(cytosol) + FAD(mitochondria) → NAD+(cytosol) + FADH2(mitochondria)
2. Malate-Aspartate Shuttle
Diagram (Basic Medical Biochemistry, Fig. 24.10):
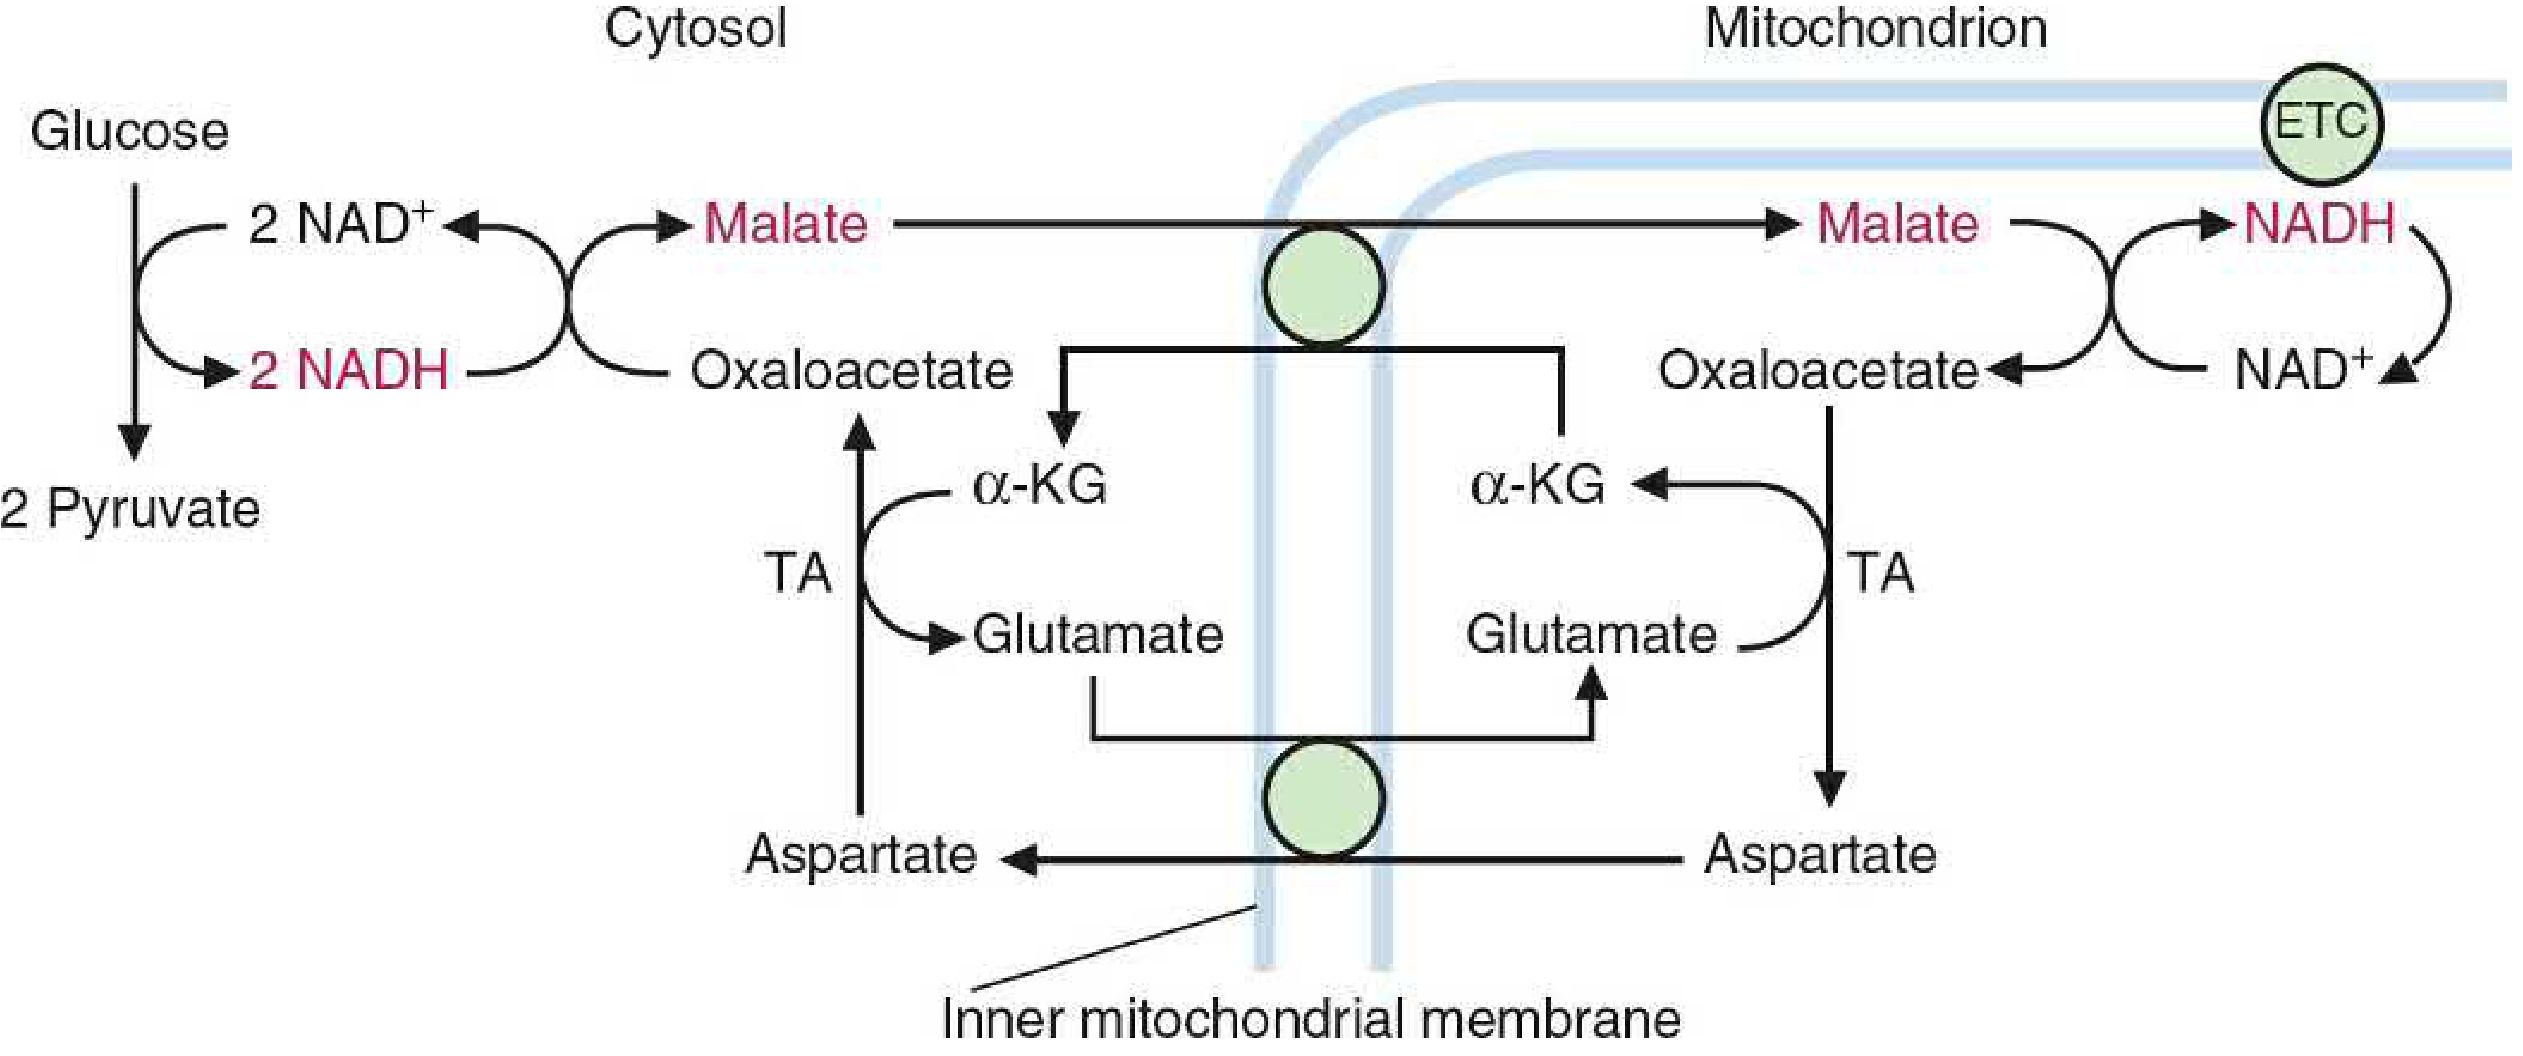
Diagram (Lippincott Biochemistry, Fig. 6.17B - matrix side detail):
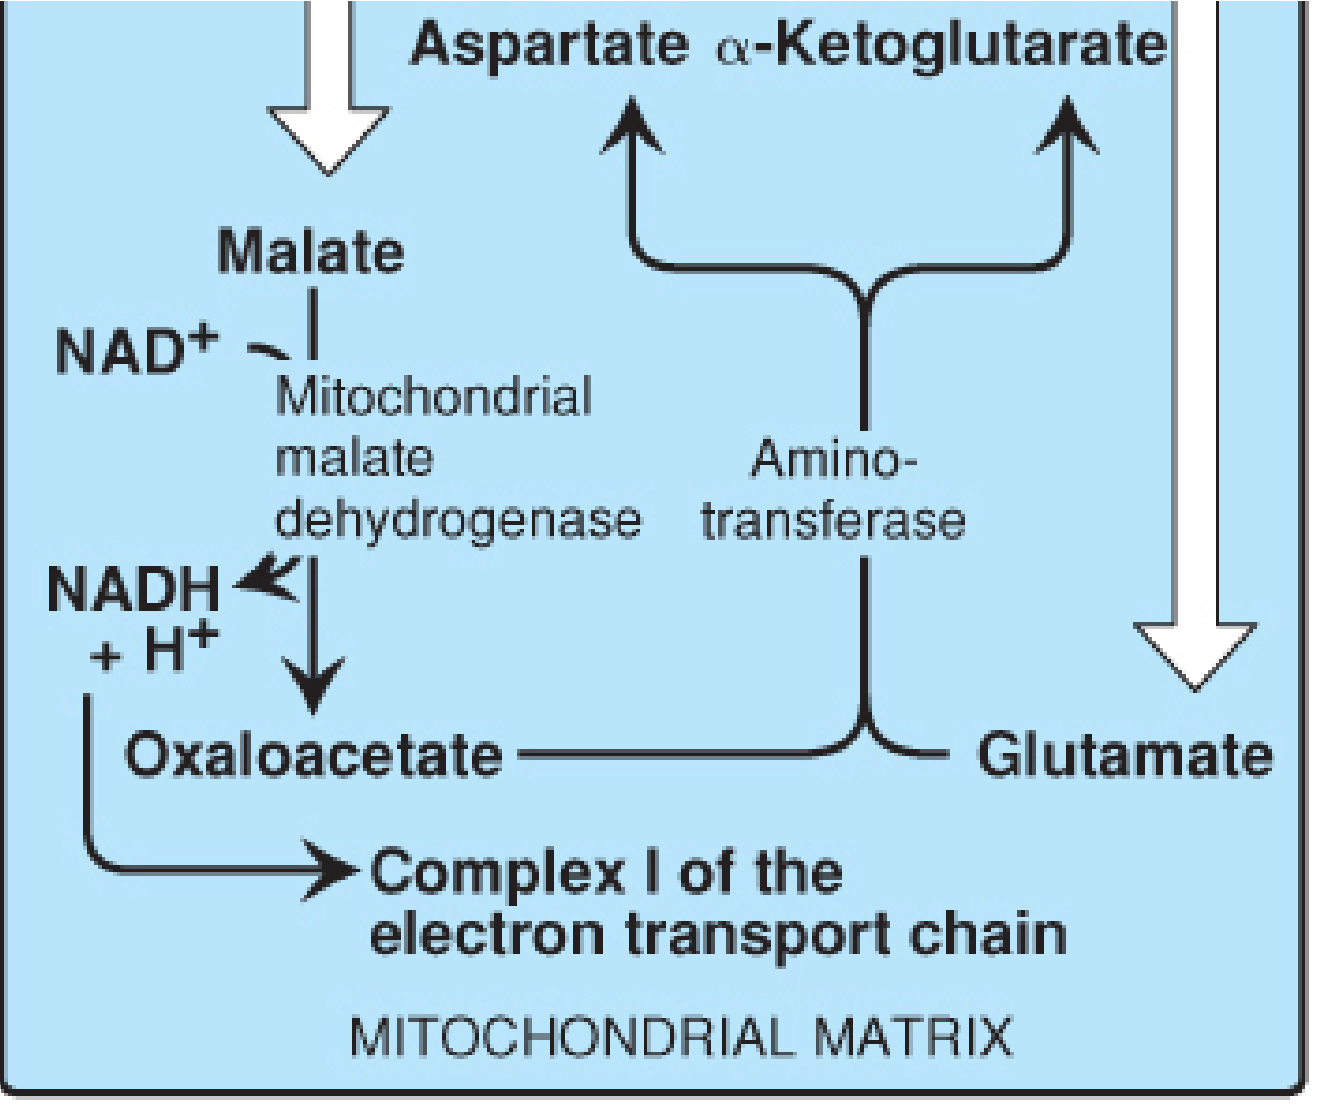
Steps (6-step cycle):
| Step | Location | Reaction |
|---|---|---|
| 1 | Cytosol | OAA + NADH + H+ → Malate + NAD+ (cytosolic malate dehydrogenase) |
| 2 | IMM transporter | Malate enters matrix via malate-α-ketoglutarate exchanger |
| 3 | Matrix | Malate + NAD+ → OAA + NADH (mitochondrial malate dehydrogenase) → NADH feeds Complex I |
| 4 | Matrix | OAA + Glutamate → Aspartate + α-KG (aspartate aminotransferase / transamination) |
| 5 | IMM transporter | Aspartate exits via glutamate-aspartate exchanger; α-KG exits via malate-α-KG exchanger |
| 6 | Cytosol | Aspartate + α-KG → OAA + Glutamate (cytosolic aspartate aminotransferase) → OAA restarts cycle |
NADH(cytosol) + NAD+(matrix) → NAD+(cytosol) + NADH(matrix)
- Malate-α-ketoglutarate exchanger - imports malate, exports α-KG
- Glutamate-aspartate exchanger - imports glutamate, exports aspartate
Comparison Table
| Feature | Glycerol 3-P Shuttle | Malate-Aspartate Shuttle |
|---|---|---|
| Tissues | Skeletal muscle, brain | Heart, liver, kidney |
| Electron acceptor | FAD | NAD+ |
| ETC entry point | CoQ (Complex II level) | Complex I |
| ATP yield | ~1.5 ATP/NADH | ~2.5 ATP/NADH |
| Reversibility | Irreversible | Reversible |
| Cofactor regenerated | NAD+ in cytosol | NAD+ in cytosol |
| Carriers used | DHAP / Glycerol 3-P | Malate, Aspartate, Glutamate, α-KG |
Why Two Shuttles?
- With glycerol 3-P shuttle: ~30 ATP per glucose
- With malate-aspartate shuttle: ~32 ATP per glucose
Maje it simple
Mitochondrial Shuttle Systems — Simplified
The Core Problem
Glycolysis makes NADH in the cytosol, but the ETC is inside the mitochondria. NADH cannot cross the inner mitochondrial membrane. So the cell uses shuttle systems to sneak the electrons in.
Shuttle 1 — Glycerol 3-Phosphate Shuttle
Cytosol:      DHAP  +  NADH  →  Glycerol 3-P  +  NAD⁺
                                      ↓ (crosses membrane)
Mitochondria: Glycerol 3-P  +  FAD  →  DHAP  +  FADH₂  →  ETC
| Found in | Skeletal muscle, brain |
| ATP made | ~1.5 ATP per NADH |
| Why less ATP? | Electrons skip Complex I, enter at CoQ |
Shuttle 2 — Malate-Aspartate Shuttle
Cytosol:      OAA  +  NADH  →  Malate  +  NAD⁺
                                   ↓ (crosses membrane)
Mitochondria: Malate  +  NAD⁺  →  OAA  +  NADH  →  Complex I → ETC

(OAA can't cross back directly, so it becomes Aspartate → exits → reforms OAA in cytosol)
| Found in | Heart, liver, kidney |
| ATP made | ~2.5 ATP per NADH |
| Why more ATP? | NADH enters at Complex I |
Side-by-Side Summary
| Glycerol 3-P Shuttle | Malate-Aspartate Shuttle | |
|---|---|---|
| Speed | Fast | Slower |
| ATP yield | 1.5 | 2.5 |
| Electron carrier into mito | Glycerol 3-P | Malate |
| Electron acceptor inside | FAD | NAD⁺ |
| Tissue | Muscle, Brain | Heart, Liver, Kidney |
Create a comparison diagram poster (glycerol 3-P vs malate-aspartate)
A clean educational biochemistry comparison poster showing two mitochondrial shuttle systems side by side. LEFT SIDE - "Glycerol 3-Phosphate Shuttle" (blue theme): - Label at top: "GLYCEROL 3-PHOSPHATE SHUTTLE" - Subtitle: "Fast • Less Efficient • Muscle & Brain" - Show CYTOSOL section at top and MITOCHONDRIAL MATRIX at bottom, separated by a membrane (labeled "Inner Mitochondrial Membrane") - In cytosol: DHAP + NADH → Glycerol 3-P + NAD⁺ (enzyme: cytosolic G3P dehydrogenase) - Arrow going DOWN through membrane: Glycerol 3-P enters mitochondria - In membrane/matrix: Glycerol 3-P + FAD → DHAP + FADH₂ (enzyme: mitochondrial G3P dehydrogenase) - DHAP arrow going back UP to cytosol - FADH₂ arrow going to "CoQ → ETC" with label "~1.5 ATP" - Badge: "ATP YIELD: 1.5 per NADH" RIGHT SIDE - "Malate-Aspartate Shuttle" (green/orange theme): - Label at top: "MALATE-ASPARTATE SHUTTLE" - Subtitle: "Efficient • More Steps • Heart, Liver & Kidney" - Same membrane division - In cytosol: OAA + NADH → Malate + NAD⁺ (cytosolic malate dehydrogenase) - Arrow DOWN: Malate enters matrix via malate-α-KG transporter - In matrix: Malate + NAD⁺ → OAA + NADH → Complex I → ETC - OAA + Glutamate → Aspartate + α-KG (aspartate aminotransferase) - Aspartate exits UP via glutamate-aspartate transporter - α-KG exits UP via malate-α-KG transporter - Aspartate + α-KG → OAA + Glutamate in cytosol (cycle restarts) - Badge: "ATP YIELD: 2.5 per NADH" CENTER DIVIDER - comparison table: Feature | G3P Shuttle | Malate-Asp Shuttle Tissue: Muscle/Brain | Heart/Liver/Kidney Carrier: DHAP/Glycerol-3P | Malate/Aspartate Electron acceptor: FAD | NAD⁺ ETC entry: CoQ | Complex I ATP yield: 1.5 | 2.5 Steps: Simple (2) | Complex (6) BOTTOM - bold text: "Both shuttles transfer cytosolic NADH electrons into the mitochondria — NADH itself cannot cross the inner membrane" Overall style: Clean white background, bold colored arrows, professional medical textbook style, well-organized, easy to read fonts, color-coded sections
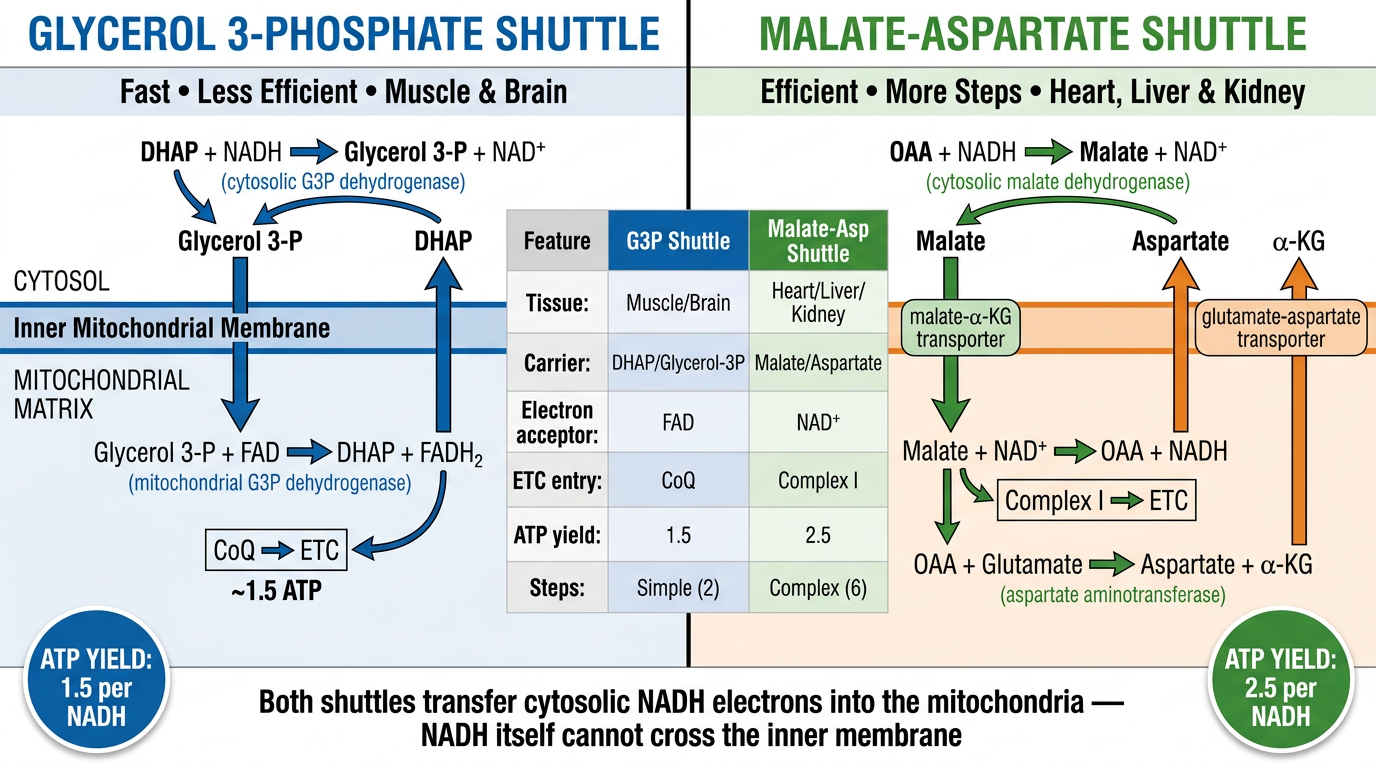
- Blue side - Glycerol 3-P shuttle with the simple 2-step cycle, FAD as the electron acceptor, and the 1.5 ATP yield
- Green/orange side - Malate-aspartate shuttle with the 6-step cycle, NAD⁺ as the acceptor, and the 2.5 ATP yield
- Center table - quick feature-by-feature comparison
- Membrane clearly shown separating cytosol from the mitochondrial matrix
Image is confusing
mkdir -p /tmp/workspace/shuttle-poster && ls /tmp/workspace/shuttle-poster/
~/shuttle-poster/poster.py
import matplotlib.pyplot as plt
import matplotlib.patches as mpatches
from matplotlib.patches import FancyArrowPatch, FancyBboxPatch
import matplotlib.patheffects as pe

fig = plt.figure(figsize=(20, 14))
fig.patch.set_facecolor('#F8F9FA')

# ── Title ──────────────────────────────────────────────────────────────────────
fig.text(0.5, 0.965, 'Mitochondrial Shuttle Systems', ha='center', va='top',
         fontsize=26, fontweight='bold', color='#1a1a2e')
fig.text(0.5, 0.940, 'How cytosolic NADH electrons cross the inner mitochondrial membrane',
         ha='center', va='top', fontsize=13, color='#555555', style='italic')

# ── Divider line ───────────────────────────────────────────────────────────────
fig.add_artist(plt.Line2D([0.03, 0.97], [0.925, 0.925], color='#cccccc', linewidth=1.5, transform=fig.transFigure))

# ═══════════════════════════════════════════════════════════════════════════════
# COLORS
# ═══════════════════════════════════════════════════════════════════════════════
BLUE      = '#1565C0'
BLUE_LITE = '#E3F2FD'
BLUE_MED  = '#90CAF9'
GREEN     = '#2E7D32'
GREEN_LIT = '#E8F5E9'
GREEN_MED = '#A5D6A7'
MEMB_CLR  = '#B0BEC5'
MEMB_TXT  = '#37474F'
BOX_RAD   = 0.012
ARROW_KW  = dict(arrowstyle='->', color='#333333', lw=2,
                 mutation_scale=18, connectionstyle='arc3,rad=0')

def box(ax, x, y, w, h, label, sublabel=None,
        fc='#E3F2FD', ec='#1565C0', fontsize=11, subfontsize=9):
    rect = FancyBboxPatch((x - w/2, y - h/2), w, h,
                          boxstyle=f'round,pad=0.01',
                          facecolor=fc, edgecolor=ec, linewidth=2, zorder=3)
    ax.add_patch(rect)
    ax.text(x, y + (0.018 if sublabel else 0), label,
            ha='center', va='center', fontsize=fontsize,
            fontweight='bold', color=ec, zorder=4)
    if sublabel:
        ax.text(x, y - 0.030, sublabel, ha='center', va='center',
                fontsize=subfontsize, color='#444444', zorder=4, style='italic')

def arrow(ax, x1, y1, x2, y2, color='#333333', label='', label_side='right'):
    ax.annotate('', xy=(x2, y2), xytext=(x1, y1),
                arrowprops=dict(arrowstyle='->', color=color, lw=2.2,
                                mutation_scale=18))
    if label:
        mx, my = (x1+x2)/2, (y1+y2)/2
        dx = 0.025 if label_side == 'right' else -0.025
        ax.text(mx + dx, my, label, ha='left' if label_side == 'right' else 'right',
                va='center', fontsize=8.5, color=color, style='italic')

def membrane_band(ax, y_top, y_bot, x_left=0.0, x_right=1.0):
    rect = mpatches.Rectangle((x_left, y_bot), x_right - x_left, y_top - y_bot,
                               facecolor=MEMB_CLR, alpha=0.35, zorder=1)
    ax.add_patch(rect)
    ax.axhline(y_top, color=MEMB_CLR, linewidth=2.5, zorder=2)
    ax.axhline(y_bot, color=MEMB_CLR, linewidth=2.5, zorder=2)

def zone_label(ax, x, y, text, color):
    ax.text(x, y, text, ha='center', va='center', fontsize=9,
            fontweight='bold', color=color,
            bbox=dict(fc='white', ec=color, alpha=0.85, boxstyle='round,pad=0.3'))

# ═══════════════════════════════════════════════════════════════════════════════
# LEFT PANEL — Glycerol 3-P Shuttle
# ═══════════════════════════════════════════════════════════════════════════════
ax1 = fig.add_axes([0.03, 0.09, 0.44, 0.83])
ax1.set_xlim(0, 1); ax1.set_ylim(0, 1)
ax1.axis('off')
ax1.set_facecolor(BLUE_LITE)

# Panel title
ax1.text(0.5, 0.965, 'GLYCEROL 3-PHOSPHATE SHUTTLE', ha='center', va='top',
         fontsize=15, fontweight='bold', color=BLUE)
ax1.text(0.5, 0.935, 'Skeletal Muscle  •  Brain', ha='center', va='top',
         fontsize=11, color=BLUE, style='italic')

# ATP badge
badge = FancyBboxPatch((0.32, 0.895), 0.36, 0.032,
                        boxstyle='round,pad=0.01', facecolor=BLUE, edgecolor=BLUE)
ax1.add_patch(badge)
ax1.text(0.50, 0.912, 'ATP YIELD:  ~1.5 per NADH', ha='center', va='center',
         fontsize=10.5, fontweight='bold', color='white')

# Zone labels
zone_label(ax1, 0.15, 0.80, 'CYTOSOL', BLUE)
zone_label(ax1, 0.15, 0.18, 'MATRIX', BLUE)

# Membrane
membrane_band(ax1, 0.535, 0.455)
ax1.text(0.85, 0.495, 'Inner\nMitochondrial\nMembrane', ha='center', va='center',
         fontsize=8, color=MEMB_TXT, fontweight='bold')

# ── CYTOSOL nodes ──
box(ax1, 0.30, 0.830, 0.22, 0.055, 'Glucose → Pyruvate',
    sublabel='(Glycolysis)', fc='white', ec=BLUE, fontsize=10)

box(ax1, 0.30, 0.730, 0.20, 0.055, 'NADH + H⁺',
    fc=BLUE_LITE, ec=BLUE, fontsize=11)

box(ax1, 0.70, 0.730, 0.20, 0.055, 'NAD⁺',
    fc='white', ec=BLUE, fontsize=11)

box(ax1, 0.30, 0.615, 0.24, 0.055, 'Glycerol 3-P',
    fc=BLUE_MED, ec=BLUE, fontsize=11)

box(ax1, 0.70, 0.615, 0.20, 0.055, 'DHAP',
    fc='white', ec=BLUE, fontsize=11)

# Cytosol arrows
arrow(ax1, 0.30, 0.803, 0.30, 0.758)               # Glucose → NADH
arrow(ax1, 0.30, 0.757, 0.30, 0.643)               # NADH → Glycerol 3-P
ax1.text(0.07, 0.700, 'Cytosolic\nG3P\nDehydrogenase',
         ha='center', va='center', fontsize=8.5, color=BLUE, style='italic')
arrow(ax1, 0.70, 0.643, 0.70, 0.757)               # DHAP → NAD+  (return)
arrow(ax1, 0.60, 0.730, 0.40, 0.730, color='#888888')  # NAD+ feeds back

# Cross-membrane arrows
arrow(ax1, 0.30, 0.588, 0.30, 0.477, color=BLUE, label='enters', label_side='left')
arrow(ax1, 0.70, 0.477, 0.70, 0.588, color='#888888', label='returns', label_side='right')

# ── MATRIX nodes ──
box(ax1, 0.30, 0.390, 0.24, 0.055, 'Glycerol 3-P',
    fc=BLUE_MED, ec=BLUE, fontsize=11)

box(ax1, 0.70, 0.390, 0.20, 0.055, 'DHAP',
    fc='white', ec=BLUE, fontsize=11)

box(ax1, 0.30, 0.270, 0.20, 0.055, 'FAD',
    fc='white', ec=BLUE, fontsize=11)

box(ax1, 0.70, 0.270, 0.22, 0.055, 'FADH₂',
    fc='#FFCC02', ec='#E65100', fontsize=11)

box(ax1, 0.50, 0.140, 0.34, 0.055, 'CoQ → ETC',
    sublabel='(bypasses Complex I)', fc='#FF8F00', ec='#E65100', fontsize=11)

ax1.text(0.07, 0.340, 'Mitochondrial\nG3P\nDehydrogenase',
         ha='center', va='center', fontsize=8.5, color=BLUE, style='italic')

arrow(ax1, 0.30, 0.363, 0.30, 0.298)               # G3P → FAD
arrow(ax1, 0.30, 0.298, 0.59, 0.298, color=BLUE)   # FAD → FADH2
arrow(ax1, 0.70, 0.363, 0.70, 0.298)               # G3P → DHAP
arrow(ax1, 0.59, 0.270, 0.70, 0.298, color='#888888')
arrow(ax1, 0.50, 0.243, 0.50, 0.168, color='#E65100', label='→ 1.5 ATP')

# ═══════════════════════════════════════════════════════════════════════════════
# RIGHT PANEL — Malate-Aspartate Shuttle
# ═══════════════════════════════════════════════════════════════════════════════
ax2 = fig.add_axes([0.52, 0.09, 0.45, 0.83])
ax2.set_xlim(0, 1); ax2.set_ylim(0, 1)
ax2.axis('off')
ax2.set_facecolor(GREEN_LIT)

# Panel title
ax2.text(0.5, 0.965, 'MALATE-ASPARTATE SHUTTLE', ha='center', va='top',
         fontsize=15, fontweight='bold', color=GREEN)
ax2.text(0.5, 0.935, 'Heart  •  Liver  •  Kidney', ha='center', va='top',
         fontsize=11, color=GREEN, style='italic')

# ATP badge
badge2 = FancyBboxPatch((0.32, 0.895), 0.36, 0.032,
                         boxstyle='round,pad=0.01', facecolor=GREEN, edgecolor=GREEN)
ax2.add_patch(badge2)
ax2.text(0.50, 0.912, 'ATP YIELD:  ~2.5 per NADH', ha='center', va='center',
         fontsize=10.5, fontweight='bold', color='white')

# Zone labels
zone_label(ax2, 0.15, 0.80, 'CYTOSOL', GREEN)
zone_label(ax2, 0.15, 0.18, 'MATRIX', GREEN)

# Membrane
membrane_band(ax2, 0.535, 0.455)
ax2.text(0.86, 0.495, 'Inner\nMitochondrial\nMembrane', ha='center', va='center',
         fontsize=8, color=MEMB_TXT, fontweight='bold')

# Transporter labels on membrane
ax2.text(0.28, 0.495, 'Malate/α-KG\ntransporter', ha='center', va='center',
         fontsize=7.5, color='#4A148C', fontweight='bold',
         bbox=dict(fc='#EDE7F6', ec='#4A148C', boxstyle='round,pad=0.2'))
ax2.text(0.68, 0.495, 'Glu/Asp\ntransporter', ha='center', va='center',
         fontsize=7.5, color='#BF360C', fontweight='bold',
         bbox=dict(fc='#FBE9E7', ec='#BF360C', boxstyle='round,pad=0.2'))

# ── CYTOSOL nodes ──
box(ax2, 0.50, 0.840, 0.22, 0.050, 'Glucose → Pyruvate',
    sublabel='(Glycolysis)', fc='white', ec=GREEN, fontsize=10)

box(ax2, 0.22, 0.745, 0.20, 0.050, 'OAA', fc='white', ec=GREEN, fontsize=11)
box(ax2, 0.50, 0.745, 0.20, 0.050, 'NADH', fc=GREEN_LIT, ec=GREEN, fontsize=11)
box(ax2, 0.78, 0.745, 0.20, 0.050, 'NAD⁺', fc='white', ec=GREEN, fontsize=11)

box(ax2, 0.22, 0.630, 0.20, 0.050, 'Malate', fc=GREEN_MED, ec=GREEN, fontsize=11)

box(ax2, 0.78, 0.630, 0.20, 0.050, 'Aspartate', fc='#FFCCBC', ec='#BF360C', fontsize=10)
box(ax2, 0.78, 0.560, 0.20, 0.050, 'α-KG', fc='#FFCCBC', ec='#BF360C', fontsize=10)

ax2.text(0.50, 0.690, 'Cytosolic malate\ndehydrogenase', ha='center', va='center',
         fontsize=8, color=GREEN, style='italic')
ax2.text(0.50, 0.600, 'Aspartate\naminotransferase\n(cytosolic)', ha='center',
         va='center', fontsize=7.5, color='#BF360C', style='italic')

# Cytosol arrows
arrow(ax2, 0.50, 0.815, 0.50, 0.770)               # Gluc → NADH
arrow(ax2, 0.40, 0.745, 0.32, 0.745)               # NADH → OAA side
arrow(ax2, 0.22, 0.720, 0.22, 0.655)               # OAA → Malate
arrow(ax2, 0.60, 0.745, 0.68, 0.745)               # NADH → NAD+
# OAA + Glu → Asp + α-KG  in cytosol (return cycle)
ax2.annotate('', xy=(0.78, 0.655), xytext=(0.68, 0.745),
             arrowprops=dict(arrowstyle='->', color='#BF360C', lw=1.8, mutation_scale=16,
                             connectionstyle='arc3,rad=-0.3'))

# Cross-membrane arrows
arrow(ax2, 0.22, 0.605, 0.22, 0.477, color='#4A148C', label='Malate in', label_side='left')
arrow(ax2, 0.68, 0.477, 0.68, 0.555, color='#BF360C', label='Asp out', label_side='right')
arrow(ax2, 0.33, 0.477, 0.33, 0.555, color='#4A148C', label='α-KG out', label_side='left')

# ── MATRIX nodes ──
box(ax2, 0.22, 0.390, 0.20, 0.050, 'Malate', fc=GREEN_MED, ec=GREEN, fontsize=11)
box(ax2, 0.50, 0.390, 0.20, 0.050, 'NAD⁺', fc='white', ec=GREEN, fontsize=11)

box(ax2, 0.22, 0.280, 0.20, 0.050, 'OAA', fc='white', ec=GREEN, fontsize=11)
box(ax2, 0.50, 0.280, 0.22, 0.050, 'NADH', fc='#C8E6C9', ec=GREEN, fontsize=12)

box(ax2, 0.78, 0.335, 0.20, 0.050, 'Aspartate', fc='#FFCCBC', ec='#BF360C', fontsize=10)
box(ax2, 0.78, 0.260, 0.20, 0.050, 'α-KG', fc='#FFCCBC', ec='#BF360C', fontsize=10)
box(ax2, 0.78, 0.185, 0.20, 0.050, 'Glutamate', fc='#FFCCBC', ec='#BF360C', fontsize=10)

box(ax2, 0.36, 0.155, 0.30, 0.050, 'Complex I → ETC',
    sublabel='(full NADH yield!)', fc='#388E3C', ec='#1B5E20', fontsize=11)

ax2.text(0.50, 0.340, 'Mitochondrial malate\ndehydrogenase', ha='center', va='center',
         fontsize=8, color=GREEN, style='italic')
ax2.text(0.78, 0.130, 'Aspartate\naminotransferase\n(matrix)', ha='center', va='center',
         fontsize=7.5, color='#BF360C', style='italic')

# Matrix arrows
arrow(ax2, 0.22, 0.365, 0.22, 0.305)               # Malate → OAA
arrow(ax2, 0.40, 0.390, 0.60, 0.390)               # pull NAD+
arrow(ax2, 0.40, 0.280, 0.39, 0.280)
arrow(ax2, 0.32, 0.280, 0.39, 0.280)
arrow(ax2, 0.40, 0.280, 0.61, 0.280, color=GREEN)  # OAA → NADH
arrow(ax2, 0.50, 0.255, 0.45, 0.180, color='#1B5E20', label='→ 2.5 ATP')
# Asp ↔ α-KG cycle in matrix
ax2.annotate('', xy=(0.78, 0.210), xytext=(0.78, 0.310),
             arrowprops=dict(arrowstyle='->', color='#BF360C', lw=1.8, mutation_scale=16))

# ── Cycle-back arrows (glutamate/aspartate from matrix → transporters) ──
arrow(ax2, 0.68, 0.335, 0.68, 0.477, color='#BF360C')  # Asp goes up to transporter
arrow(ax2, 0.33, 0.390, 0.33, 0.477, color='#4A148C')  # α-KG up

# ═══════════════════════════════════════════════════════════════════════════════
# BOTTOM COMPARISON TABLE
# ═══════════════════════════════════════════════════════════════════════════════
ax3 = fig.add_axes([0.03, 0.01, 0.94, 0.072])
ax3.set_xlim(0, 1); ax3.set_ylim(0, 1)
ax3.axis('off')
ax3.set_facecolor('#1a1a2e')

headers  = ['Feature', 'Glycerol 3-P Shuttle', 'Malate-Aspartate Shuttle']
row1     = ['Tissue',      'Skeletal Muscle, Brain',    'Heart, Liver, Kidney']
row2     = ['Electron carrier', 'DHAP ↔ Glycerol 3-P', 'OAA ↔ Malate + Asp/Glu']
row3     = ['Electron acceptor', 'FAD',                 'NAD⁺']
row4     = ['ETC entry',   'CoQ  (skips Complex I)',     'Complex I  (full chain)']
row5     = ['ATP / NADH',  '~1.5 ATP',                  '~2.5 ATP']

col_x    = [0.08, 0.38, 0.72]
col_clrs = ['#CFD8DC', BLUE_MED, GREEN_MED]

for ci, (cx, txt, cc) in enumerate(zip(col_x, headers, ['#ECEFF1', BLUE_MED, GREEN_MED])):
    ax3.text(cx, 0.82, txt, ha='center', va='center', fontsize=10,
             fontweight='bold', color='#1a1a2e',
             bbox=dict(fc=cc, ec='none', boxstyle='round,pad=0.3', alpha=0.95))

for ri, row in enumerate([row1, row2, row3, row4, row5]):
    y = 0.62 - ri * 0.145
    clrs = ['#ECEFF1', '#E3F2FD', '#E8F5E9']
    for ci, (cx, val) in enumerate(zip(col_x, row)):
        ax3.text(cx, y, val, ha='center', va='center',
                 fontsize=9, color='#1a1a2e',
                 bbox=dict(fc=clrs[ci], ec='none', boxstyle='round,pad=0.2', alpha=0.80))

plt.savefig('/tmp/workspace/shuttle-poster/mitochondrial_shuttles.png',
            dpi=150, bbox_inches='tight', facecolor=fig.get_facecolor())
print("Saved.")
cd /tmp/workspace/shuttle-poster && python poster.py 2>&1
mitochondrial shuttles
Image · PNG
- Left panel (blue) - Glycerol 3-P shuttle: simple 2-node cycle, DHAP ↔ Glycerol 3-P as carriers, electrons land on FAD → CoQ, yields 1.5 ATP
- Right panel (green/orange) - Malate-aspartate shuttle: the 6-step cycle with malate, OAA, aspartate, glutamate, α-KG, and the two membrane transporters clearly labeled, electrons enter at Complex I, yields 2.5 ATP
- Grey band = inner mitochondrial membrane, separating cytosol (top) from matrix (bottom) in each panel
- Bottom table = side-by-side feature comparison