
Vit b metabolism
vitamin B complex metabolism coenzyme functions diagram
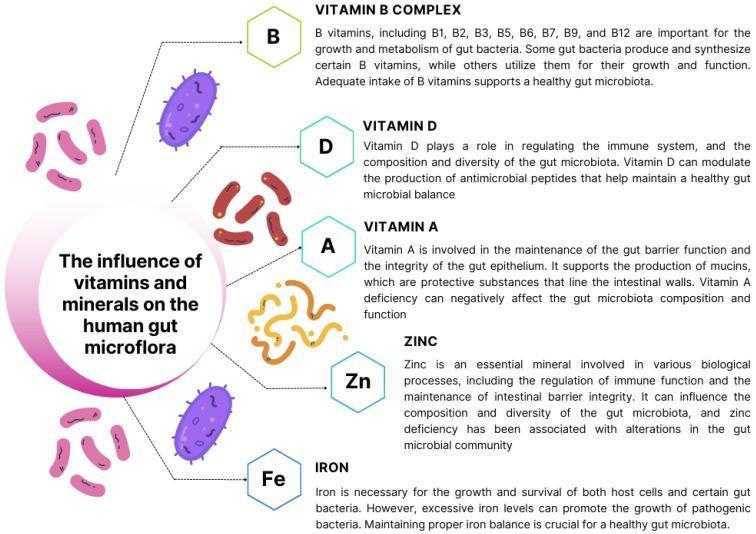
Educational infographic titled 'The influence of vitamins and minerals on the human gut microflora,' illustrating the physiological roles of specific micronutrients in gastrointestinal health. The diagram features a central hub connected to five key nutrients: Vitamin B complex, Vitamin D, Vitamin A, Zinc (Zn), and Iron (Fe). Each micronutrient is associated with distinct stylized representations of gut bacteria: Vitamin B is linked to purple oval-shaped bacteria, Vitamin D to reddish-brown rod-shaped bacilli, and Vitamin A to yellow-orange curvy, filamentous structures. Zinc is depicted by small yellow dots, and Iron is associated with pinkish rod-shaped microorganisms. Accompanying text descriptions detail how Vitamin B complex supports bacterial growth and metabolism; Vitamin D regulates immune function and antimicrobial peptide production; Vitamin A maintains gut barrier integrity and epithelial health; Zinc influences microbial diversity and immune regulation; and Iron balance is critical for the survival of beneficial bacteria while preventing the overgrowth of pathogenic species. The infographic serves as a summary of micronutrient-microbiome interactions and their clinical relevance to human homeostasis.
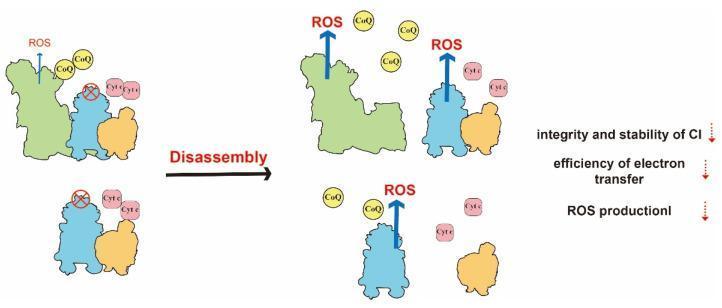
A pathophysiology diagram illustrating the mitochondrial respiratory chain dysfunction resulting from the disassembly of supercomplexes (SCs). The visual compares two states: an organized supercomplex and a disassembled state. On the left, Complex I (CI, green), Complex III (CIII, blue), and Complex IV (CIV, orange) are closely associated in a functional supercomplex, with Coenzyme Q (CoQ) and Cytochrome c (Cyt c) in close proximity to facilitate efficient electron transfer. A red 'X' on CIII signifies a defect. Following a 'Disassembly' arrow, the right side depicts the complexes separated. This structural breakdown leads to a longer diffusion distance for CoQ and Cyt c, represented by their wider dispersion. The educational focus is on the consequences of SC disassembly: increased production of Reactive Oxygen Species (ROS), indicated by larger blue arrows; decreased efficiency of electron transfer; and reduced integrity and stability of Complex I. Text annotations explicitly list these three deleterious physiological effects, emphasizing the role of SCs in maintaining efficient oxidative phosphorylation and cellular energy metabolism.
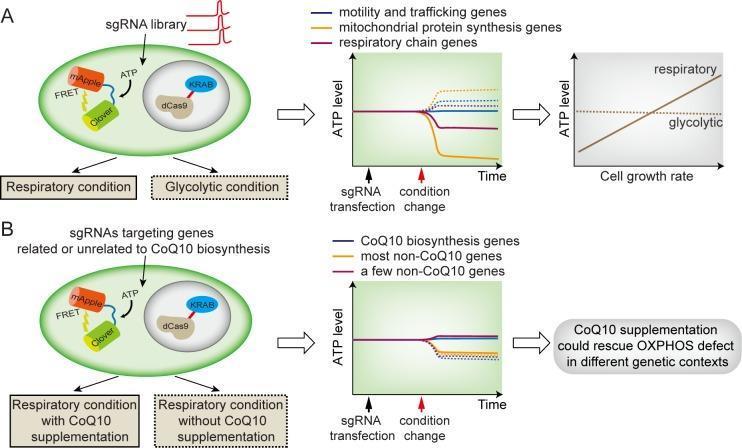
This medical research diagram illustrates a high-throughput screening assay using CRISPRi and a FRET-based ATP biosensor to study mitochondrial metabolism and Coenzyme Q10 (CoQ10) rescue. Panel A depicts the assay design where a library of sgRNAs targets specific gene categories—including motility and trafficking, mitochondrial protein synthesis, and respiratory chain genes—under respiratory and glycolytic conditions. A corresponding line graph shows time-dependent changes in ATP levels following sgRNA transfection, highlighting how respiratory chain gene knockdown significantly reduces ATP under respiratory conditions compared to glycolytic ones. A final graph correlates these ATP levels with cell growth rates. Panel B focuses on CoQ10 supplementation, comparing genes related to CoQ10 biosynthesis with non-CoQ10 genes. The central graph demonstrates that CoQ10 supplementation can rescue ATP production in the presence of oxidative phosphorylation (OXPHOS) defects. The schematic summarizes the clinical potential of CoQ10 for treating mitochondrial disorders by showing rescue across diverse genetic contexts.
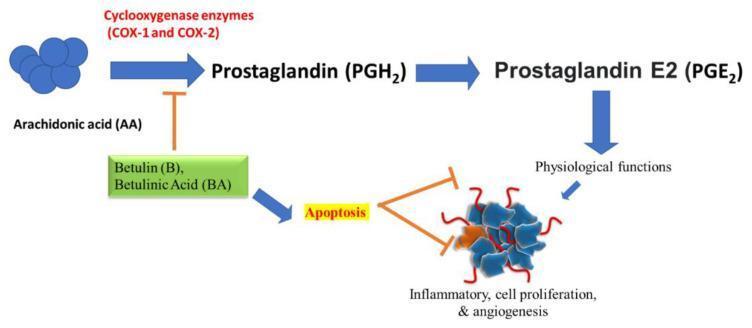
A pathophysiology diagram illustrating the molecular signaling pathway of arachidonic acid (AA) metabolism and its modulation by the natural compounds Betulin (B) and Betulinic Acid (BA). The primary pathway shows AA converting to Prostaglandin (PGH2) via Cyclooxygenase enzymes (COX-1 and COX-2), which is further metabolized into Prostaglandin E2 (PGE2). PGE2 is shown to mediate physiological functions. The educational focus of the diagram is the anti-inflammatory and anti-cancer mechanism of Betulin and Betulinic Acid. These compounds are depicted inhibiting the conversion of AA to PGH2 (indicated by a brown T-bar inhibitory symbol). Additionally, Betulin and Betulinic Acid are shown promoting apoptosis. This induced apoptosis subsequently inhibits downstream pathological processes including inflammation, cell proliferation, and angiogenesis (depicted as a complex cluster with red vascular-like tendrils). The diagram effectively visualizes how triterpenoids can interfere with the COX-2-mediated prostaglandin pathway to arrest tumor growth and reduce inflammatory responses.
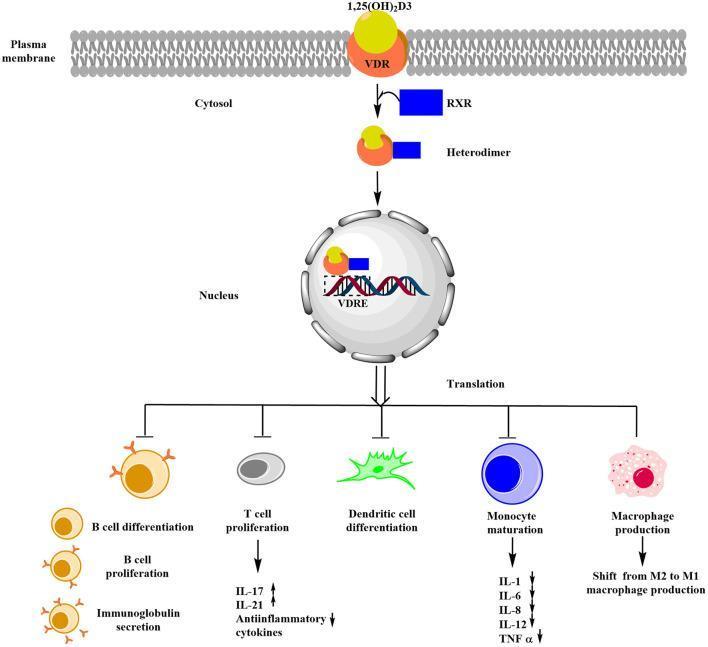
This pathophysiology diagram illustrates the signaling pathway of Vitamin D3 (1,25(OH)2D3) and its role in immune regulation. The process begins at the plasma membrane where Vitamin D3 binds to the Vitamin D Receptor (VDR). In the cytosol, the Retinoid X Receptor (RXR) is recruited to form a VDR-RXR heterodimer complex. This complex translocates into the nucleus and binds to Vitamin D Response Elements (VDRE) on the DNA. Through translation, this pathway exerts multiple immunomodulatory effects: it inhibits B-cell differentiation, B-cell proliferation, and immunoglobulin secretion; inhibits T-cell proliferation (decreasing IL-17 and IL-21 while increasing anti-inflammatory cytokines); and inhibits dendritic cell differentiation. It further influences monocyte maturation by downregulating pro-inflammatory cytokines including IL-1, IL-6, IL-8, IL-12, and TNF-alpha. Additionally, the diagram shows an effect on macrophage production, specifically a shift from M2 to M1 macrophage production. This schematic summarizes the mechanisms by which Vitamin D modulates the immune system in clinical contexts such as Celiac Disease (CD).
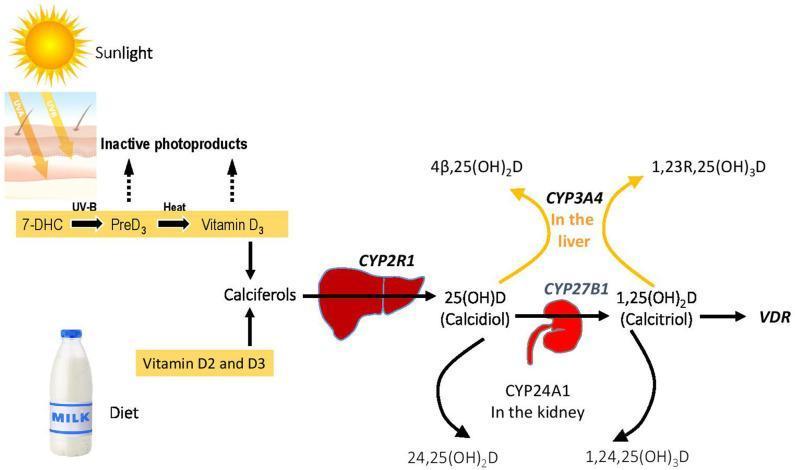
This pathophysiology diagram illustrates the metabolic pathway of Vitamin D homeostasis and its associated genetic enzymes. The process begins with two sources: endogenous synthesis in the skin via Sunlight (UV-B) converting 7-DHC to PreD3 and then to Vitamin D3 (Cholecalciferol) through heat, and dietary intake (Vitamin D2 and D3). These converge into 'Calciferols'. The primary activation pathway shows the liver enzyme CYP2R1 hydroxylating calciferols into 25(OH)D (Calcidiol). This metabolite then moves to the kidney, where CYP27B1 converts it to the active form, 1,25(OH)2D (Calcitriol), which binds to the Vitamin D Receptor (VDR). The diagram also highlights catabolic inactivation pathways: in the kidney, CYP24A1 converts 25(OH)D and 1,25(OH)2D into inactive products (24,25(OH)2D and 1,24,25(OH)3D respectively). In the liver, CYP3A4 facilitates an alternative inactivation route, producing 4β,25(OH)2D and 1,23R,25(OH)3D. Key genes involved in Vitamin D-Dependent Rickets (VDDR) are highlighted in bold, emphasizing the clinical significance of these enzymatic steps in mineral metabolism.
Vitamin B Complex - Metabolism
Vitamin B1 - Thiamine
- Coenzyme for oxidative decarboxylation of alpha-keto acids:
- Pyruvate → Acetyl-CoA (pyruvate dehydrogenase complex)
- Alpha-ketoglutarate → Succinyl-CoA (in TCA cycle)
- Branched-chain alpha-keto acids
- Required for the pentose phosphate pathway (transketolase reaction)
- Guyton & Hall, p. 878
Vitamin B2 - Riboflavin
- Hydrogen carriers in mitochondrial oxidative systems
- Accept hydrogen from food substrates (via dehydrogenases) → pass to the electron transport chain
- Components of Complex I (NADH dehydrogenase, via FMN) and Complex II (succinate dehydrogenase, via FAD)
- Also involved in fatty acid beta-oxidation (FADH2 generation)
- Guyton & Hall, p. 878
Vitamin B3 - Niacin (Nicotinic Acid)
- Major hydrogen acceptors - accept H⁺ from food substrates (carbohydrates, fats, proteins) via dehydrogenases
- NAD+ is central to glycolysis, TCA cycle, and beta-oxidation
- NADP+ is used in anabolic reactions (fatty acid synthesis, the pentose phosphate pathway)
- Can be synthesized endogenously from tryptophan (60 mg tryptophan → 1 mg niacin)
- Guyton & Hall, p. 879
Vitamin B5 - Pantothenic Acid
- CoA is essential for:
- Pyruvate → Acetyl-CoA (entry into TCA cycle)
- Beta-oxidation of fatty acids (as fatty acyl-CoA)
- Cholesterol and steroid hormone synthesis
- Acetylation reactions (e.g., acetylcholine synthesis)
- ACP participates in fatty acid synthesis
- Guyton & Hall, p. 879
Vitamin B6 - Pyridoxine
- Coenzyme for transamination reactions (synthesis and interconversion of amino acids)
- Involved in decarboxylation of amino acids:
- DOPA → Dopamine
- 5-HTP → Serotonin
- Glutamate → GABA
- Histidine → Histamine
- Required for heme synthesis (delta-aminolevulinic acid synthase)
- Transport of some amino acids across cell membranes
- Glycogen phosphorylase co-factor
- Guyton & Hall, p. 879
Vitamin B7 - Biotin
- Coenzyme for carboxylation reactions:
- Pyruvate carboxylase: Pyruvate → Oxaloacetate (gluconeogenesis)
- Acetyl-CoA carboxylase: Acetyl-CoA → Malonyl-CoA (fatty acid synthesis)
- Propionyl-CoA carboxylase: Propionyl-CoA → Methylmalonyl-CoA (odd-chain fatty acids, branched-chain AAs)
Vitamin B9 - Folic Acid (Folate)
- Carrier of one-carbon units for nucleotide synthesis:
- Purine synthesis (C2 and C8 of the purine ring)
- dTMP synthesis from dUMP (thymidylate synthase)
- Key form: N5-methyl-THF - donates methyl group to B12 in the methionine cycle
- Essential for DNA replication and cell division
- Basic Medical Biochemistry, 6e; Yamada's Gastroenterology
Vitamin B12 - Cobalamin
- Methionine synthase (requires methylcobalamin): Homocysteine + N5-methyl-THF → Methionine + THF
- This regenerates active THF for DNA synthesis
- Also produces S-adenosyl-methionine (SAM), the universal methyl donor
- Methylmalonyl-CoA mutase (requires adenosylcobalamin): L-methylmalonyl-CoA → Succinyl-CoA
- Connects odd-chain fatty acid and branched-chain AA catabolism to the TCA cycle
- Food protein → gastric proteases release B12
- B12 binds haptocorrin (R-protein) (protects in acidic stomach)
- In duodenum, pancreatic proteases digest haptocorrin → B12 released
- B12 binds intrinsic factor (IF) (from gastric parietal cells)
- IF-B12 complex absorbed in terminal ileum via receptor-mediated endocytosis
-
Megaloblastic anemia
-
Subacute combined degeneration of spinal cord (posterior + lateral columns demyelination) → peripheral neuropathy, ataxia, dementia
-
Pernicious anemia: autoimmune destruction of parietal cells / anti-IF antibodies
-
Elevated homocysteine and methylmalonic acid (diagnostic markers)
-
Yamada's Gastroenterology; Guyton & Hall, p. 880
Summary Table
| Vitamin | Active Coenzyme | Key Metabolic Role | Classic Deficiency |
|---|---|---|---|
| B1 Thiamine | TPP | Decarboxylation of alpha-keto acids | Beriberi, Wernicke's encephalopathy |
| B2 Riboflavin | FMN, FAD | ETC hydrogen carriers (oxidative phosphorylation) | Angular stomatitis, corneal vascularization |
| B3 Niacin | NAD+, NADP+ | Oxidation/reduction in glycolysis, TCA, FA synthesis | Pellagra (3 Ds) |
| B5 Pantothenate | CoA, ACP | Acyl transfer (pyruvate→acetyl-CoA, FA oxidation/synthesis) | Rare |
| B6 Pyridoxine | PLP | Transamination, decarboxylation, heme synthesis | Sideroblastic anemia, seizures |
| B7 Biotin | Biotin | Carboxylation reactions (gluconeogenesis, FA synthesis) | Dermatitis, alopecia (raw eggs) |
| B9 Folate | THF (FH4) | One-carbon transfers (nucleotide/DNA synthesis) | Megaloblastic anemia, neural tube defects |
| B12 Cobalamin | Methylcobalamin, Adenosylcobalamin | Methionine synthesis, methylmalonyl-CoA → succinyl-CoA | Megaloblastic anemia + subacute combined degeneration |