
explain AS, AR, MR and MS in detail
aortic stenosis echocardiogram valve
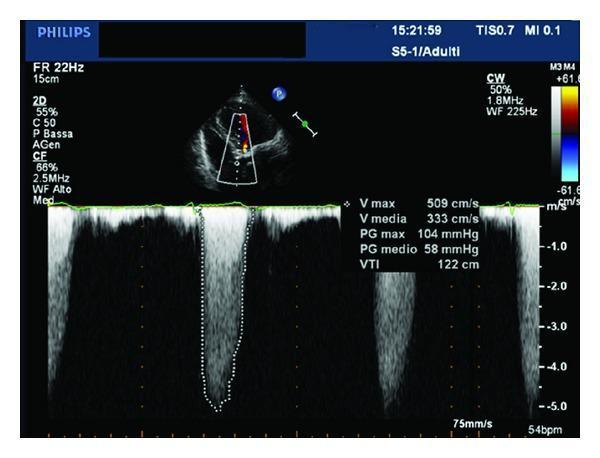
Transthoracic echocardiogram (TTE) image demonstrating severe aortic valve stenosis. The upper panel shows a 2D sector view with color Doppler mapping over the aortic valve, highlighting turbulent high-velocity flow. The lower panel displays a Continuous Wave (CW) spectral Doppler waveform obtained at 1.8MHz. Hemodynamic measurements indicate severe stenosis: a peak velocity (V max) of 509 cm/s, a mean velocity (V media) of 333 cm/s, a peak pressure gradient (PG max) of 104 mmHg, and a mean pressure gradient (PG medio) of 58 mmHg. The Velocity Time Integral (VTI) is recorded at 122 cm. Technical settings include a sweep speed of 75mm/s and a heart rate of 54 bpm. This diagnostic image illustrates the quantification of valvular obstruction through spectral Doppler analysis, essential for grading the severity of calcific or degenerative aortic valve disease in clinical cardiology.
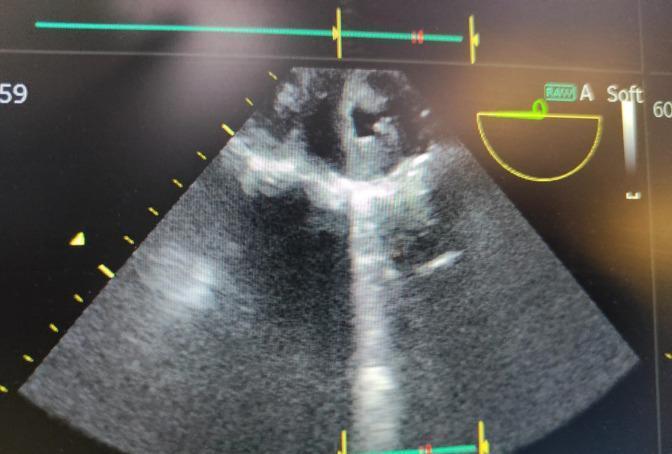
A 2-D transthoracic echocardiogram (TTE) in grayscale, demonstrating severe aortic valve stenosis. The image shows the aortic valve leaflets with significant thickening and increased echogenicity, indicating calcification or fibrosis. The valve orifice is markedly narrowed during systole. Distal to the stenotic valve, there is a region of speckled, high-amplitude echoes suggesting turbulent blood flow and mild aortic regurgitation. The echocardiographic view captures the cardiac anatomy in a sector format, with depth markers along the left margin and an electrocardiogram (ECG) trace at the top for cardiac cycle synchronization. This diagnostic image illustrates key hemodynamic changes associated with valvular heart disease, suitable for teaching aortic valve pathology and the assessment of stenotic severity in a clinical setting.
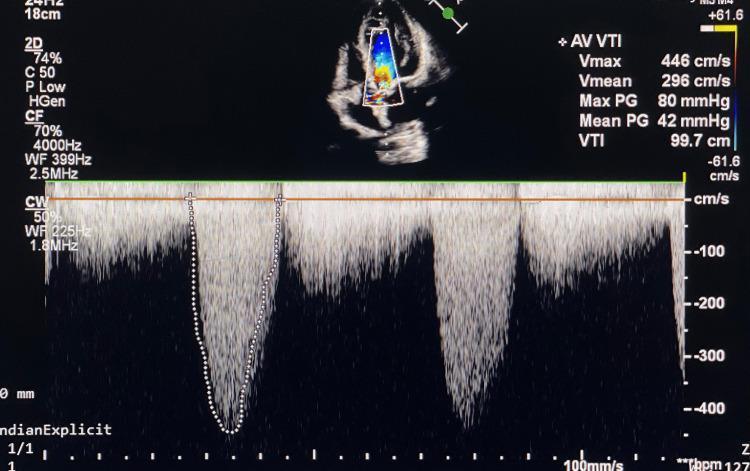
A diagnostic image showing a continuous-wave (CW) Doppler echocardiogram of the aortic valve, utilized for assessing hemodynamics in a patient with severe aortic stenosis. The display is divided into a top section featuring a 2D transthoracic apical five-chamber view with color flow mapping and a bottom section showing the spectral Doppler tracing. The spectral envelope is dense and high-velocity, appearing below the baseline, indicating high-speed flow away from the transducer. Quantitative hemodynamic measurements for the aortic valve (AV VTI) are displayed on the right: a maximum velocity (Vmax) of 446 cm/s, a mean velocity (Vmean) of 296 cm/s, a peak pressure gradient (Max PG) of 80 mmHg, a mean pressure gradient (Mean PG) of 42 mmHg, and a velocity time integral (VTI) of 99.7 cm. These parameters are diagnostic of severe aortic stenosis. The tracing shows a typical dagger-shaped or triangular morphology associated with valvular obstruction. This visual is intended for cardiology education regarding valvular heart disease and Doppler quantification.
mitral stenosis mitral regurgitation valve diagram
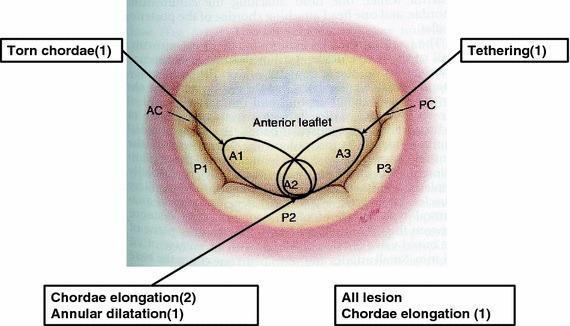
This medical illustration depicts an anatomical diagram of the mitral valve from an atrial perspective, detailing the segmental anatomy and associated valvular pathologies related to mitral regurgitation. The anterior leaflet is divided into segments A1, A2, and A3, while the posterior leaflet shows segments P1, P2, and P3. The anterior commissure (AC) and posterior commissure (PC) are also marked. The diagram maps specific structural etiologies to these segments: 'Torn chordae' near the AC/P1 area; 'Chordae elongation' and 'Annular dilatation' at the P2/A2 segment; and 'Tethering' near the PC/P3 region. A generalized note for 'All lesion chordae elongation' is also included. This visual summarizes Carpentier’s functional classification, illustrating how specific subvalvular and annular abnormalities contribute to mitral valve dysfunction. It serves as an educational tool for cardiology and cardiothoracic surgery to understand the spatial distribution of mitral apparatus pathologies.
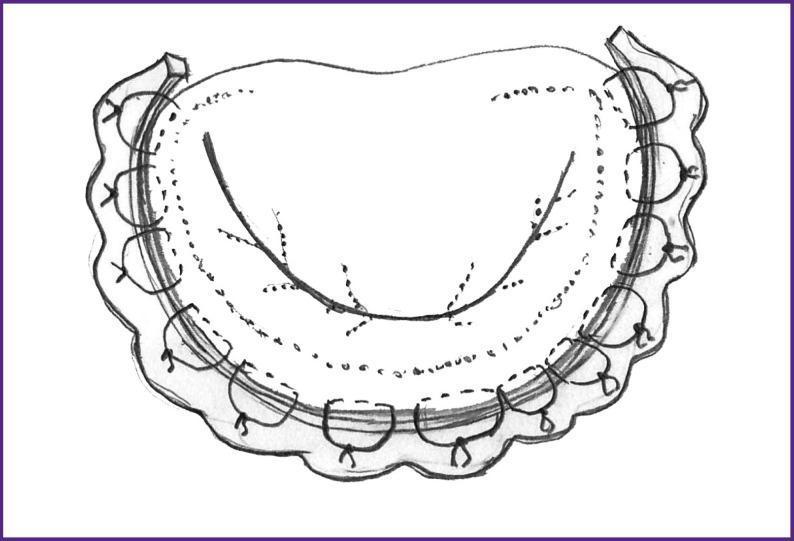
This medical illustration depicts an anatomical diagram of the mitral valve following a mitral valve plasty procedure for ischemic mitral regurgitation. The diagram focuses on the reinforcement of the annulus fibrosus using an autopericardial strip. The strip is positioned circumferentially along the posterior portion of the annulus, extending beyond the commissures to achieve annuloplasty and reduction of the valvular orifice. Multiple U-shaped sutures are visible, tied and evenly spaced along the outer perimeter of the strip, securing it to the underlying fibrous ring. Centrally, the valve leaflets are shown with a clear line of coaptation, indicating successful restoration of valve competence. Fine dotted lines and markings on the leaflet surfaces represent the structural integration and the satisfactory contact zone achieved post-correction. This illustration serves as an educational tool for cardiac surgery, demonstrating the surgical technique for autopericardial ring annuloplasty to treat valvular insufficiency.
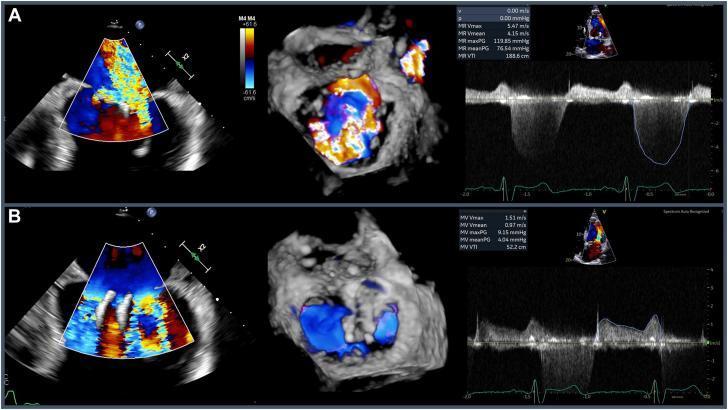
Multi-panel pre-procedure echocardiographic assessment of mixed mitral valve disease. Panel A displays a transesophageal echocardiogram (TEE) bicommissural view (60 degrees) with color Doppler and 3D reconstruction, revealing severe mitral regurgitation. The imaging shows eccentric lateral and medial regurgitant jets with mosaic turbulent flow. Corresponding pulse wave Doppler demonstrates holosystolic flow with a high maximum velocity (Vmax) of 5.47 m/s. Panel B utilizes the same TEE views to evaluate mitral stenosis. Color Doppler and 3D imaging show turbulent flow across the valve orifice. Pulse wave Doppler quantification indicates a peak gradient of 9 mmHg and a mean gradient of 4 mmHg, consistent with moderate mitral stenosis. This composite image serves as a clinical diagnostic tool for evaluating structural valvular disease, specifically assessing regurgitant jet morphology, flow velocity, and pressure gradients across the mitral valve in a patient with prior MitraClip interventions.
aortic regurgitation AR diastolic murmur clinical signs
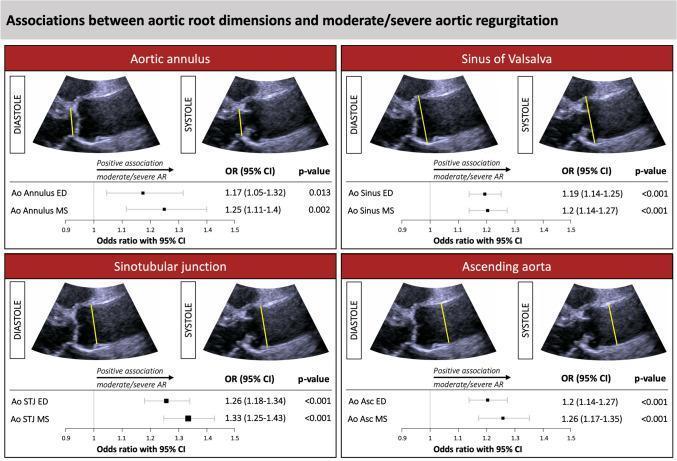
Educational infographic and clinical imaging composite illustrating the associations between aortic root dimensions and moderate/severe aortic regurgitation (AR). The image is divided into four quadrants, each focusing on a specific anatomical region: Aortic Annulus, Sinus of Valsalva, Sinotubular Junction (STJ), and Ascending Aorta. Each quadrant contains: 1. Diagnostic Images: Side-by-side parasternal long-axis view echocardiograms labeled 'Diastole' and 'Systole.' Yellow calipers (linear markers) demonstrate the internal diameter measurement technique at each specific aortic level. 2. Statistical Forest Plots: Below the echocardiograms, forest plots show the odds ratio (OR) with 95% confidence intervals (CI) for end-diastolic (ED) and mid-systolic (MS) measurements. Across all four anatomical levels, the odds ratios are consistently >1.0 (ranging from 1.17 to 1.33), indicating a significant positive association where larger aortic root dimensions correlate with a higher risk of moderate/severe AR. The p-values for these associations are consistently <0.05. The data is derived from multivariate logistic regression adjusted for cardiovascular risk factors like hypertension and diabetes.
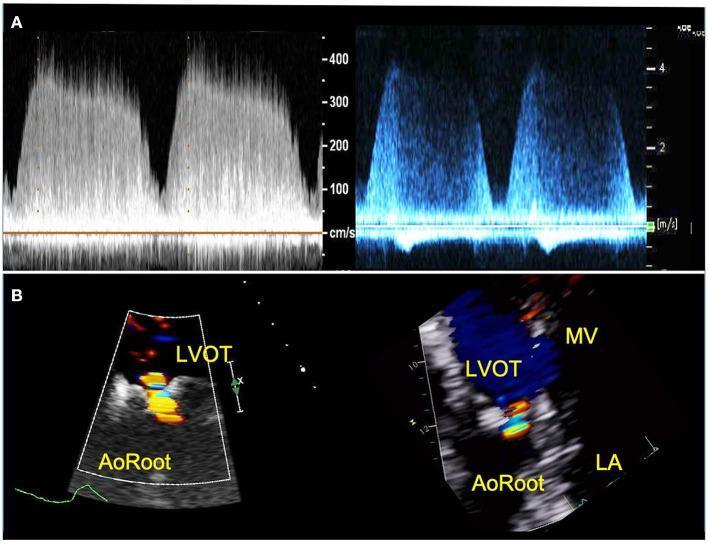
Transthoracic echocardiography (TTE) comparison between a 3D-printed circulatory flow model (left) and a clinical patient (right) evaluating aortic regurgitation (AR). Row A displays Continuous Wave (CW) Doppler spectral profiles, illustrating comparable peak velocities (approx. 400 cm/s) and similar decrescendo waveform envelopes during the diastolic phase, indicating consistent hemodynamics between the in vitro model and the in vivo subject. Row B presents Color Doppler flow mapping in the parasternal long-axis view. These images demonstrate a multi-colored regurgitant jet originating at the aortic valve and extending through the aortic root (AoRoot) into the left ventricular outflow tract (LVOT). In the patient image, the jet is seen passing the mitral valve (MV) toward the left atrium (LA). The color maps assist in assessing AR severity by visualizing the vena contracta width and jet area relative to the LVOT. The imagery demonstrates the utility of patient-specific 3D modeling for replicating complex valvular regurgitation patterns under varying hemodynamic conditions.
Valvular Heart Disease: AS, AR, MR, and MS
1. Aortic Stenosis (AS)
Definition & Etiology
- Calcific/degenerative AS - Most common in adults >65. Progressive calcium deposition on a trileaflet aortic valve over decades.
- Bicuspid aortic valve - Congenital anomaly (1-2% of population); presents 1-2 decades earlier (age 40-60s) due to abnormal stress on the two leaflets.
- Rheumatic AS - Due to rheumatic fever; leaflet fusion at commissures; almost always coexists with mitral valve disease.
Pathophysiology
- Myocardial oxygen demand rises (thick wall) while supply falls (compression of subendocardial vessels)
- Eventually, LV systolic dysfunction develops
- Cardiac output falls and symptoms emerge
Clinical Features
| Symptom | Mean Survival Without AVR |
|---|---|
| Angina | ~5 years |
| Syncope | ~3 years |
| Heart failure (dyspnea) | ~1-2 years |
- Harsh, late-peaking (crescendo-decrescendo) systolic ejection murmur at right 2nd intercostal space, radiating to carotids
- Slow-rising, small-volume pulse (pulsus parvus et tardus) - may be absent in elderly due to arterial stiffness
- Diminished or absent A2 (aortic component of S2)
- S4 gallop (due to stiff LV)
- Sustained, heaving apex beat (due to LV hypertrophy)
Investigations
- ECG: LVH pattern (voltage criteria + ST/T changes in lateral leads), LBBB in advanced disease
- CXR: May show post-stenotic aortic dilatation, calcified aortic valve, cardiomegaly in late disease
- Echocardiography (gold standard): Calcified, restricted valve leaflets; high transvalvular gradient; reduced AVA by continuity equation; LVH; reduced diastolic filling
- CT calcium scoring: Useful to confirm severe AS in low-gradient cases (Agatston score ≥3,000 in men, ≥1,600 in women = severe)
Grading of Severity
| Grade | AVA | Peak Velocity | Mean Gradient |
|---|---|---|---|
| Mild | >1.5 cm² | <3 m/s | <20 mmHg |
| Moderate | 1.0-1.5 cm² | 3-4 m/s | 20-40 mmHg |
| Severe | <1.0 cm² | ≥4 m/s | ≥40 mmHg |
Management
- Asymptomatic AS: Serial monitoring; avoid strenuous exercise in severe AS; AVR when symptoms develop or LVEF drops <50%
- Symptomatic severe AS: Aortic valve replacement (AVR) - Class I indication
- Surgical AVR (SAVR): Standard for age <65 or low/intermediate surgical risk
- Transcatheter AVR (TAVR): Preferred for age >75 or high surgical risk; also recommended (with shared decision-making) in ages 65-75
2. Aortic Regurgitation (AR)
Definition & Etiology
- Bicuspid aortic valve
- Rheumatic heart disease
- Infective endocarditis (leaflet destruction/perforation)
- Myxomatous degeneration
- Hypertensive aortic root dilatation (most common in older adults)
- Aortic dissection (acute AR emergency)
- Marfan syndrome, Ehlers-Danlos syndrome
- Ankylosing spondylitis, reactive arthritis (spondyloarthropathies)
- Syphilitic aortitis (now rare)
Pathophysiology
- LV dilates beyond compensatory capacity
- Afterload increases (Laplace's law)
- LVEF falls and irreversible LV damage occurs - this is the critical point for surgery
Clinical Features
- Exertional dyspnea (most common presenting symptom)
- Orthopnea, PND
- Angina (palpitations + bounding pulse sensation at rest/lying down)
- Palpitations
| Sign | Description |
|---|---|
| Corrigan's pulse | Water-hammer/collapsing pulse - rapid rise and fall |
| Quincke's sign | Visible capillary pulsations in nail bed |
| De Musset's sign | Head nodding with each heartbeat |
| Duroziez's sign | Systolic + diastolic murmur over femoral artery with compression |
| Traube's sign | "Pistol shot" sounds over femoral artery |
| Müller's sign | Visible pulsations of the uvula |
| Hill's sign | Popliteal BP > brachial BP by >20 mmHg |
- Early diastolic decrescendo murmur at left sternal border (heard best in expiration, sitting forward)
- Austin Flint murmur - low-pitched mid-diastolic rumble at apex (regurgitant jet strikes anterior mitral leaflet, causing functional mitral stenosis)
- Displaced, volume-overloaded apex beat (hyperdynamic)
- S3 in advanced disease
Investigations
- ECG: LVH with volume overload pattern (tall R waves, Q waves in lateral leads)
- CXR: Cardiomegaly (boot-shaped LV), dilated ascending aorta
- Echo: Dilated LV; premature closure of mitral valve (acute AR); fluttering of anterior mitral leaflet; regurgitant jet by color Doppler; pressure half-time; holodiastolic flow reversal in descending aorta (severe AR)
Grading (ACC/AHA Staging)
| Stage | Definition |
|---|---|
| A | At risk (bicuspid valve, aortic root disease) - no AR |
| B | Progressive mild-moderate AR, normal LV |
| C1 | Asymptomatic severe AR, normal LVEF (>55%), mild-moderate LV dilation |
| C2 | Asymptomatic severe AR, LVEF ≤55% or LVESD >50 mm |
| D | Symptomatic severe AR |
Management
- Medical: ACE inhibitors/ARBs for hypertension and aortic root dilatation; diuretics for symptom control; avoid beta-blockers (heart rate reduction prolongs diastole → more regurgitation)
- AVR Indications:
- Stage D (symptomatic severe AR) - Class I
- Stage C2 (LVEF ≤55% or LVESD >50 mm) - Class I
- Concomitant surgery on heart - Class I
- Acute AR: Emergency AVR + hemodynamic support (vasodilators, intra-aortic balloon pump contraindicated)
3. Mitral Stenosis (MS)
Definition & Etiology
- Rheumatic heart disease (RHD) - by far the most common cause (>90% in developing countries). Group A streptococcal pharyngitis → acute rheumatic fever → immune-mediated valve damage
- Degenerative MS (DMS) - mitral annular calcification (MAC), more common in elderly Western patients
- Congenital - parachute mitral valve
- Post-procedural - after mitral valve repair/replacement
- Rare: Carcinoid, systemic lupus, mucopolysaccharidoses, methysergide use
Pathophysiology
- LA pressure rises → LA dilatation
- Pulmonary venous hypertension → pulmonary edema (especially with tachycardia, which shortens diastole)
- Reactive pulmonary arterial hypertension → right heart failure (RV dilation, tricuspid regurgitation)
- Atrial fibrillation - due to LA dilation; AF is both a consequence and an accelerant of MS (increases heart rate → less diastolic filling time → worse obstruction)
- LA stasis → thrombus formation (especially in left atrial appendage) → systemic embolism/stroke
Clinical Features
| MVA | Severity | Gradient |
|---|---|---|
| 1.5-2.0 cm² | Mild | Gradient only on exercise |
| 1.0-1.5 cm² | Moderate | Gradient at rest; symptoms on exertion |
| <1.0 cm² | Severe | High gradient at rest; severe symptoms |
- Exertional dyspnea (most common)
- Orthopnea, PND, pulmonary edema
- Hemoptysis (rupture of bronchopulmonary veins; pink frothy sputum in acute pulmonary edema)
- Palpitations (AF)
- Systemic embolic events (stroke)
- Hoarseness - Ortner's syndrome (enlarged LA compresses left recurrent laryngeal nerve)
- Loud S1 (mitral leaflets are wide open in diastole and snap shut forcefully)
- Opening snap (OS) - high-pitched sound early in diastole when the valve snaps open; the shorter the S2-OS interval, the more severe the MS (higher LA pressure)
- Low-pitched, rumbling mid-diastolic murmur at the apex; best heard with bell in left lateral decubitus position
- Presystolic accentuation of murmur (due to atrial contraction forcing blood through valve; lost in AF)
- Tapping apex - not displaced (small underfilled LV)
- Signs of pulmonary hypertension: loud P2, right ventricular heave, features of TR
- Malar flush (mitral facies) - in severe, longstanding MS
Investigations
- ECG: P mitrale (bifid P in lead II, biphasic P in V1) - signs of LA enlargement; AF; RVH if pulmonary hypertension develops
- CXR: Enlarged LA (double density at right cardiac border, splaying of carina), Kerley B lines, upper lobe diversion of pulmonary vessels
- Echo: Thickened, fused leaflets; restricted opening; "hockey stick" deformity; doming of anterior mitral leaflet; planimetry of MVA; pressure half-time method for MVA; LA enlargement; estimation of pulmonary pressures
- Wilkins Score (echocardiographic score for balloon valvuloplasty suitability): grades leaflet mobility, thickness, calcification, and subvalvular thickening - score ≤8 is favorable
Management
- Medical:
- Rate control (beta-blockers preferred) for AF; avoid tachycardia
- Anticoagulation (warfarin, target INR 2-3) for AF or prior embolism
- Diuretics for pulmonary congestion
- Penicillin prophylaxis against recurrent streptococcal infection (secondary prophylaxis)
- Intervention (for symptomatic severe MS, MVA ≤1.5 cm²):
- Percutaneous mitral balloon valvuloplasty (PMBV/PMC) - first choice if anatomy is favorable (Wilkins score ≤8, no LA thrombus, no more than mild MR). Replicates surgical commissurotomy.
- Surgical mitral commissurotomy or valve replacement - if anatomy is unfavorable or PMBV not available
4. Mitral Regurgitation (MR)
Definition & Etiology
- Myxomatous degeneration / Mitral Valve Prolapse (MVP) - most common cause in developed countries; leaflet prolapse with or without chordal rupture; Barlow's disease (redundant billowing leaflets) vs. fibro-elastic deficiency (thin, elongated chords)
- Rheumatic heart disease
- Infective endocarditis
- Connective tissue disorders (Marfan, Ehlers-Danlos)
- Trauma, radiation
- Ischemic MR - papillary muscle dysfunction/infarction displaces leaflets
- Dilated cardiomyopathy - LV dilation moves papillary muscles laterally → leaflet tethering
- Atriogenic MR - LA/annular dilation from chronic AF or HFpEF
| Type | Leaflet Motion | Examples |
|---|---|---|
| I | Normal | Annular dilation, perforation, cleft |
| II | Excessive (prolapse) | MVP, ruptured chordae |
| IIIa | Restricted in systole + diastole | Rheumatic disease |
| IIIb | Restricted in systole only | Ischemic/functional MR |
Pathophysiology
- Chronic MR: LA dilates and accommodates the extra volume (compliant) → LA pressure may remain near normal for years → minimal pulmonary symptoms early. LV undergoes eccentric hypertrophy (volume overload). Over time, LV remodeling leads to LV dysfunction. Because the LV has a low-impedance "pop-off" into the LA, LVEF is artificially elevated in MR - an LVEF of 55-60% in MR may already represent significant LV dysfunction (normal LVEF thresholds don't apply).
- Acute MR (papillary muscle rupture in MI, chordal rupture): The normal-sized, non-dilated LA suddenly receives a large regurgitant volume → LA pressure spikes → acute pulmonary edema. A loud holosystolic murmur may paradoxically be softer (small pressure gradient as LA pressure rises).
Clinical Features
- Exertional dyspnea, fatigue (due to reduced forward output)
- Palpitations (AF - very common)
- Progressive orthopnea, PND in advanced disease
- Sudden severe pulmonary edema
- Cardiogenic shock
- Emergency presentation
- Pansystolic (holosystolic) murmur at apex, radiating to axilla (typical of leaflet prolapse/rheumatic)
- Exception: MVP causes a mid-late systolic click followed by late systolic murmur
- Soft S1 (mitral leaflets don't close firmly)
- S3 gallop (due to rapid LV filling with large regurgitant volume returning from LA)
- Displaced, hyperdynamic apex beat (LV volume overload)
- Signs of pulmonary hypertension in advanced disease
- Standing/Valsalva (decreases LV volume) → click moves earlier, murmur longer
- Squatting (increases LV volume) → click moves later, murmur shorter
Investigations
- ECG: LVH, P mitrale (LA enlargement), AF is common
- CXR: Enlarged LA and LV; pulmonary venous congestion; may see regurgitant jet effect
- Echo (gold standard): Identifies mechanism and severity; LVEF, LV dimensions (LVESD), LA size; vena contracta; regurgitant volume/fraction; ERO area; pulmonary pressures; 3D TEE for surgical planning
- Cardiac MRI: Most accurate for regurgitant volumes when echo is inconclusive
| Parameter | Severe |
|---|---|
| Vena contracta | >0.7 cm |
| Regurgitant volume | ≥60 mL/beat |
| Regurgitant fraction | ≥50% |
| ERO | ≥0.4 cm² (primary) / ≥0.2 cm² (secondary) |
Management
- Asymptomatic: Active surveillance; surgery for LV dilation (LVESD ≥40 mm), LVEF ≤60%, new AF, or pulmonary HTN (PASP >50 mmHg). Mitral repair strongly preferred over replacement.
- Symptomatic: Surgery (mitral repair/replacement) - Class I
- Optimize heart failure therapy first (GDMT: ACE-I/ARB/ARNI, beta-blocker, aldosterone antagonist)
- Cardiac resynchronization therapy (CRT) if LBBB present
- If MR persists despite GDMT: MitraClip (transcatheter edge-to-edge repair) - FDA approved for high-surgical-risk patients with primary MR and for HF patients with secondary MR
- Surgery has much less benefit in secondary MR (high recurrence)
- Emergent surgery
- Bridge with IV vasodilators (nitroprusside) to reduce afterload and increase forward flow
- Intra-aortic balloon pump (IABP) to reduce afterload
Quick Comparison Summary
| Feature | AS | AR | MS | MR |
|---|---|---|---|---|
| Valve | Aortic | Aortic | Mitral | Mitral |
| Lesion | Stenotic | Regurgitant | Stenotic | Regurgitant |
| LV pattern | Concentric hypertrophy | Eccentric hypertrophy | Small/normal (underfilled) | Eccentric hypertrophy |
| LA | Normal early | Normal early | Markedly enlarged | Enlarged |
| Key murmur | Systolic ejection (harsh, late-peaking) | Early diastolic decrescendo | Mid-diastolic rumble + OS | Pansystolic at apex |
| Classic cause | Calcific/bicuspid | Root dilatation / bicuspid | Rheumatic fever | MVP / rheumatic |
| Key complication | Sudden death, HF, syncope | LV failure | AF, stroke, pulmonary HTN | AF, LV dysfunction |
| Definitive Rx | AVR (surgical or TAVR) | AVR | PMBV or commissurotomy | Repair/replacement |