
Difference between pc mra tof mra and tolerate 3d
PC MRA vs TOF MRA vs contrast enhanced 3D MRA differences radiology
https://mriquestions.com/phase-contrast-mra.html
TOF MRA time of flight magnetic resonance angiography circle of Willis
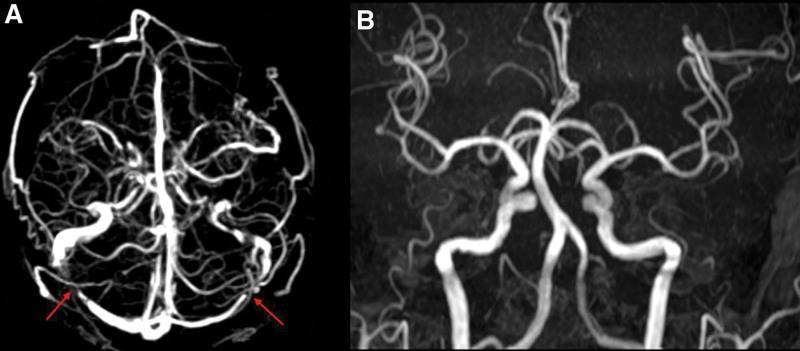
This diagnostic image pair displays neurovascular imaging of a 39-year-old male. Image A is a 3D Time-of-Flight Magnetic Resonance Venography (TOF-MRV) reconstruction in an axial-oblique orientation. It highlights the intracranial venous drainage system, specifically pointing out flow void signals in the bilateral transverse sinuses (indicated by red arrows). This lack of expected signal in a TOF sequence may suggest venous sinus stenosis or thrombosis, correlating with clinical findings of idiopathic intracranial hypertension (IIH). Image B is a Time-of-Flight Magnetic Resonance Angiography (TOF-MRA) reconstruction focusing on the arterial circulation, including the Circle of Willis and its primary branches. This image demonstrates normal arterial blood flow with no evidence of significant stenosis, aneurysm, or vascular malformation. Together, these images serve to differentiate between venous outflow obstruction and arterial pathology in the context of elevated intracranial pressure.
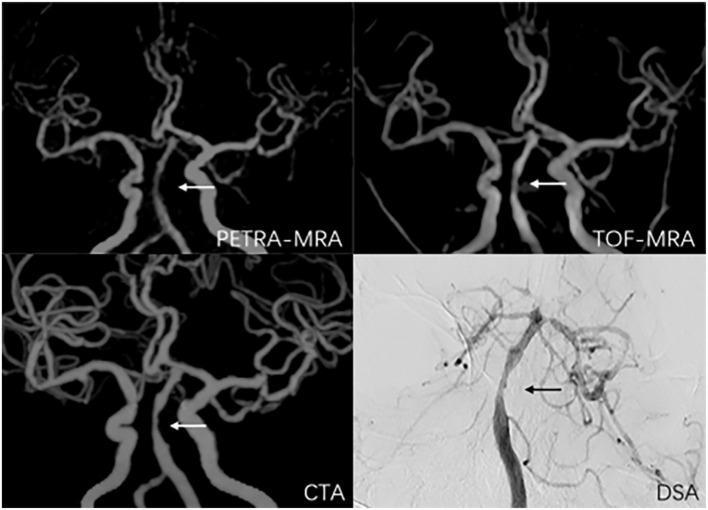
This diagnostic comparison chart displays a 2x2 grid of intracranial vascular imaging modalities in a 56-year-old male. The modalities include Pointwise Encoding Time Reduction with Radial Acquisition Magnetic Resonance Angiography (PETRA-MRA), Time-of-Flight MRA (TOF-MRA), Computed Tomography Angiography (CTA), and Digital Subtraction Angiography (DSA). Each image provides an anterior view of the intracranial vasculature, focusing on the Circle of Willis and its major branches. A focal lesion demonstrating symptomatic basilar artery stenosis is identified by arrows in all four panels. The PETRA-MRA, TOF-MRA, and CTA panels show three-dimensional reconstructions with bone removal, highlighting the varying degrees of focal luminal narrowing (ranging from 51.1% to 69.7% across modalities). The DSA panel serves as the gold-standard two-dimensional projection, showing high-contrast opacification of the basilar artery and posterior circulation. This comparison illustrates the diagnostic performance, contrast resolution, and morphological assessment of intracranial atherosclerotic disease across different non-invasive and invasive imaging techniques.
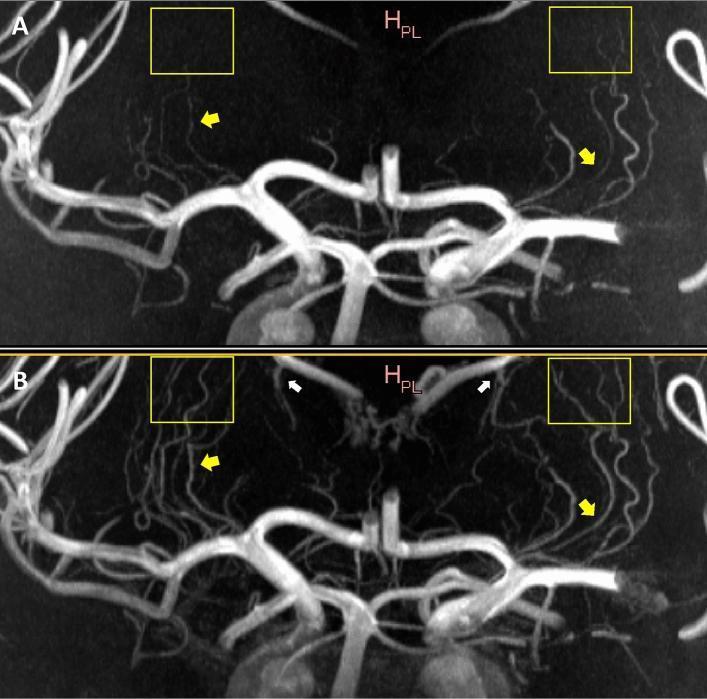
This Comparison Chart features two coronal plane Maximum Intensity Projection (MIP) diagnostic images evaluating intracranial vasculature using Magnetic Resonance Angiography (MRA). Image A displays a standard Time-of-Flight (ToF) MRA, while Image B shows a Contrast-Enhanced (CE) ToF MRA. The images highlight the Circle of Willis and its branches, specifically the Middle Cerebral Artery (MCA) and the Lenticulostriate Arteries (LSAs). Yellow arrows and boxes indicate regions where CE ToF MRA (B) provides superior signal intensity and improved sharpness of distal LSA branches compared to the signal loss seen in standard ToF (A). Additionally, white arrows in Image B demonstrate the increased prominence of the venous system, including the Choroidal and Thalamostriate veins draining into the Internal Cerebral Veins. This visual comparison illustrates the diagnostic advantages of contrast enhancement in improving small vessel visualization and reducing signal drop-off, though it introduces mild venous contamination. The content is suitable for neuroradiology education focusing on vascular imaging techniques and neuroanatomy.
PC MRA vs TOF MRA vs Contrast-Enhanced 3D MRA (TRICKS/TWIST)
1. Time-of-Flight (TOF) MRA
- Blood signal comes from inflow of unsaturated protons
- Short TR saturates stationary tissue (background suppressed)
- As blood travels deeper into the slab, it also gets saturated and loses signal ("in-plane saturation" artifact)
- Relies on T1 properties of blood
| 2D TOF | 3D TOF | |
|---|---|---|
| Slice thickness | Thin individual slices | Thin partitions within a slab |
| Sensitivity to slow flow | Better (less saturation) | Worse (in-plane saturation) |
| SNR/resolution | Lower | Higher |
| Motion artifacts | Slice-to-slice misregistration | Corrupts entire slab |
| Best use | Long vessels (aorta, femoral arteries) | Compact regions (circle of Willis, carotid bifurcation) |
- No contrast agent needed
- Excellent background suppression
- Best technique for intracranial arteries (circle of Willis)
- High spatial resolution
- Signal loss from in-plane saturation (vessels running parallel to the slab)
- Long TR needed = longer scan times
- Cannot distinguish arteries from veins without saturation bands
- Slow flow and turbulence cause signal drop (overestimates stenosis)
- T1-bright material (subacute thrombus, fat, methemoglobin) can mimic flowing blood ("T1 shine-through" artifact)
- Scan must be done axially (time-inefficient for large volumes)
2. Phase Contrast (PC) MRA
- Two acquisitions with opposite polarity flow-encoding gradients
- Subtraction of the two data sets cancels stationary tissue signal
- Vessel signal = proportional to velocity
- Must select VENC (velocity encoding) matched to expected peak velocity - if too low, aliasing occurs; if too high, SNR drops
- 2D PC: Fast, projection image, often used as a scout
- 3D PC: Higher resolution, flow directionality along all 3 axes; displayed as a "speed image" (signal proportional to flow magnitude)
- No contrast needed
- Background signal fully eliminated (no T1 shine-through problem)
- Can quantify flow velocity and direction - unique capability
- Better for slow flow (venous structures) with appropriate VENC
- Used for MR venography (MRV) - superior for dural venous sinus thrombosis
- Can image CSF flow at the foramen magnum (CSF flow studies)
- Not affected by T1-bright stationary tissue that fools TOF
- Longer scan times than TOF
- VENC must be chosen correctly before scanning
- Generally inferior spatial resolution compared to 3D TOF or CE-MRA
- Complex, operator-dependent
- Turbulent/complex flow causes phase dispersion and signal loss
- Intracranial MR venography (dural sinus thrombosis)
- CSF flow quantification
- Cardiac flow measurement (aortic regurgitation, shunt quantification)
- Renal and mesenteric flow
- 4D flow MRI for hemodynamic analysis
- Situations where TOF may be degraded (hemorrhage, thrombus)
3. Contrast-Enhanced 3D MRA (CE-3D MRA) / TRICKS / TWIST
- Gadolinium dose: 0.1-0.3 mmol/kg at 2-3 mL/sec IV
- Scan acquired during first pass of the bolus (arterial phase)
- 3D volume of ~30-50 partitions acquired in 5-50 seconds
- Timing is critical - bolus must coincide with data acquisition
- Methods for timing: test bolus (2 mL test dose then manual trigger), or automated bolus detection
- Repeatedly acquires multiple 3D volumes in rapid succession (<10 sec per volume)
- Generates a dynamic/4D MRA - shows arterial, capillary, and venous phases sequentially
- Temporal resolution prioritized over spatial resolution
- Eliminates the need for precise bolus timing
- Shows real-time hemodynamics and AVM shunting patterns
- No in-plane saturation artifact (flow direction/speed irrelevant)
- Handles slow flow, turbulence, and tortuous vessels well
- Large FOV possible (carotid/vertebral arteries in the neck)
- Better differentiation of high-grade stenosis from occlusion
- Much faster than TOF for large vascular territories
- TRICKS/4D adds temporal/hemodynamic information (AVM, venous phase timing)
- Requires IV gadolinium (risk of NSF in severe renal failure, Gd deposition)
- Spatial resolution lower than 3D TOF if temporal resolution is prioritized (TRICKS)
- Presaturation bands ineffective with Gd present
- Venous contamination can occur if timing is off
Summary Comparison Table
| Feature | TOF MRA | PC MRA | CE-3D MRA / TRICKS |
|---|---|---|---|
| Contrast needed | No | No | Yes (gadolinium) |
| Signal source | Inflow (unsaturated spins) | Phase shift from velocity | Gd T1 shortening |
| Flow quantification | No | Yes (unique) | No |
| Flow direction info | No | Yes | No |
| Best for | Intracranial arteries | MR venography, CSF flow | Neck vessels, large FOV |
| In-plane saturation | Major problem | Not an issue | Not an issue |
| T1 shine-through | Problem (thrombus mimics flow) | Not a problem | Not applicable |
| Slow flow sensitivity | Poor (2D better than 3D) | Good (adjust VENC) | Good |
| Scan time | Moderate | Longer | Fast (TRICKS very fast) |
| Spatial resolution | High | Moderate | High (TRICKS: lower) |
| Temporal resolution | None | None | Excellent (TRICKS/TWIST) |
| Stenosis assessment | Overestimates | Overestimates | Most accurate |
| Renal failure | Safe | Safe | Avoid (NSF risk) |
- TOF = best for intracranial arteries (no contrast, high resolution, but can't handle slow flow or in-plane vessels)
- PC = the only one that can measure and quantify flow - used for venography and CSF studies
- CE-3D / TRICKS = best for large vessels and neck, most accurate for stenosis grading, TRICKS adds real-time hemodynamics (AVM shunting, venous phase timing)